
- Author / Uploaded
- Cindi Howson
BusinessObjects XI (Release 2): The Complete Reference
BusinessObjects XI: The Complete Reference ® Cindi Howson McGraw-Hill New York Chicago San Francisco Lisbon London Mad
1,872 574 22MB
Pages 673 Page size 398 x 500 pts Year 2007
Recommend Papers


File loading please wait...
Citation preview
BusinessObjects XI: The Complete Reference ®
Cindi Howson
McGraw-Hill New York Chicago San Francisco Lisbon London Madrid Mexico City Milan New Delhi San Juan Seoul Singapore Sydney Toronto
Copyright © 2006 by The McGraw-Hill Companies. All rights reserved. Manufactured in the United States of America. Except as permitted under the United States Copyright Act of 1976, no part of this publication may be reproduced or distributed in any form or by any means, or stored in a database or retrieval system, without the prior written permission of the publisher. 0-07-149128-7 The material in this eBook also appears in the print version of this title: 0-07-226265-6. All trademarks are trademarks of their respective owners. Rather than put a trademark symbol after every occurrence of a trademarked name, we use names in an editorial fashion only, and to the benefit of the trademark owner, with no intention of infringement of the trademark. Where such designations appear in this book, they have been printed with initial caps. McGraw-Hill eBooks are available at special quantity discounts to use as premiums and sales promotions, or for use in corporate training programs. For more information, please contact George Hoare, Special Sales, at [email protected] or (212) 904-4069. TERMS OF USE This is a copyrighted work and The McGraw-Hill Companies, Inc. (“McGraw-Hill”) and its licensors reserve all rights in and to the work. Use of this work is subject to these terms. Except as permitted under the Copyright Act of 1976 and the right to store and retrieve one copy of the work, you may not decompile, disassemble, reverse engineer, reproduce, modify, create derivative works based upon, transmit, distribute, disseminate, sell, publish or sublicense the work or any part of it without McGraw-Hill’s prior consent. You may use the work for your own noncommercial and personal use; any other use of the work is strictly prohibited. Your right to use the work may be terminated if you fail to comply with these terms. THE WORK IS PROVIDED “AS IS.” McGRAW-HILL AND ITS LICENSORS MAKE NO GUARANTEES OR WARRANTIES AS TO THE ACCURACY, ADEQUACY OR COMPLETENESS OF OR RESULTS TO BE OBTAINED FROM USING THE WORK, INCLUDING ANY INFORMATION THAT CAN BE ACCESSED THROUGH THE WORK VIA HYPERLINK OR OTHERWISE, AND EXPRESSLY DISCLAIM ANY WARRANTY, EXPRESS OR IMPLIED, INCLUDING BUT NOT LIMITED TO IMPLIED WARRANTIES OF MERCHANTABILITY OR FITNESS FOR A PARTICULAR PURPOSE. McGraw-Hill and its licensors do not warrant or guarantee that the functions contained in the work will meet your requirements or that its operation will be uninterrupted or error free. Neither McGraw-Hill nor its licensors shall be liable to you or anyone else for any inaccuracy, error or omission, regardless of cause, in the work or for any damages resulting therefrom. McGraw-Hill has no responsibility for the content of any information accessed through the work. Under no circumstances shall McGraw-Hill and/or its licensors be liable for any indirect, incidental, special, punitive, consequential or similar damages that result from the use of or inability to use the work, even if any of them has been advised of the possibility of such damages. This limitation of liability shall apply to any claim or cause whatsoever whether such claim or cause arises in contract, tort or otherwise. DOI: 10.1036/0072262656
To BONYMAUG, a dedicated bunch
About the Author Cindi Howson is the President of ASK, a BI consultancy. She has worked with Business Objects since 1994, helping customers around the world implement and optimize their deployments. As an industry analyst, she authors the BIScorecard TM product reviews, teaches for TDWI, and writes for Intelligent Enterprise. You can contact her at [email protected].
About the Contributing Author Elizabeth Newbould is the practice principal for Business Intelligence at Dataspace, Incorporated (www.dataspace.com), one of the U.S.’s foremost data warehousing consultancies. With more than 15 years’ experience implementing complex data warehousing and business intelligence solutions for Fortune 500 companies, Elizabeth has contributed to the success of her customers by applying proven methods and expertise in a range of industries including automotive, legal, manufacturing, and health care. Elizabeth can be reached at [email protected].
About the Technical Editors David Taylor has been an employee of Business Objects (through the acquisition of Crystal Decisions) for five years. He is based in Atlanta and is currently a senior sales consultant in their Telecommunications practice. He has been in the information technology sector for more than 15 years, working with Fortune 500 companies in an ERP, product development, and business intelligence capacity. Richard Foster has been an Atlanta based employee of Business Objects for eight years and is currently a principal sales consultant. He has been in the information technology sector for more than 25 years in various capacities including software sales support, software development, post sales implementation, hardware sales support, and several roles within corporate IT organizations.
Copyright © 2006 by The McGraw-Hill Companies. Click here for terms of use.
Contents at a Glance Part I Getting Ready for BusinessObjects XI 1 2 3 4 5
Introduction to Business Intelligence . . . . . . . . . . . . . . . . . . . . . . . . . . . . . . . Goals of Deploying BusinessObjects XI . . . . . . . . . . . . . . . . . . . . . . . . . . . . Understanding Your Users . . . . . . . . . . . . . . . . . . . . . . . . . . . . . . . . . . . . . . . . . Marketing BusinessObjects XI . . . . . . . . . . . . . . . . . . . . . . . . . . . . . . . . . . . . . Under the Covers: Migrating to a New Architecture . . . . . . . . . . . . . . . . . .
3 23 37 49 63
Part II A Better Universe 6 7 8 9 10 11 12 13 14 15 16
Universe Design Principles . . . . . . . . . . . . . . . . . . . . . . . . . . . . . . . . . . . . . . . . Using Designer to Build a Basic Universe . . . . . . . . . . . . . . . . . . . . . . . . . . . Universe Joins . . . . . . . . . . . . . . . . . . . . . . . . . . . . . . . . . . . . . . . . . . . . . . . . . . . Classes and Objects . . . . . . . . . . . . . . . . . . . . . . . . . . . . . . . . . . . . . . . . . . . . . . List of Values . . . . . . . . . . . . . . . . . . . . . . . . . . . . . . . . . . . . . . . . . . . . . . . . . . . . Advanced Objects . . . . . . . . . . . . . . . . . . . . . . . . . . . . . . . . . . . . . . . . . . . . . . . . Multidimensional Analysis . . . . . . . . . . . . . . . . . . . . . . . . . . . . . . . . . . . . . . . . Securing the System . . . . . . . . . . . . . . . . . . . . . . . . . . . . . . . . . . . . . . . . . . . . . . Design Principles: Where to Put the Intelligence . . . . . . . . . . . . . . . . . . . . . Minimizing Universe Maintenance . . . . . . . . . . . . . . . . . . . . . . . . . . . . . . . . . Getting Ready for Production . . . . . . . . . . . . . . . . . . . . . . . . . . . . . . . . . . . . . .
93 107 143 179 207 229 273 283 329 347 369
Part III Reporting and Analysis 17 18 19 20
Navigating InfoView . . . . . . . . . . . . . . . . . . . . . . . . . . . . . . . . . . . . . . . . . . . . . Working with Documents . . . . . . . . . . . . . . . . . . . . . . . . . . . . . . . . . . . . . . . . . Analyzing the Data . . . . . . . . . . . . . . . . . . . . . . . . . . . . . . . . . . . . . . . . . . . . . . . Creating a New Query . . . . . . . . . . . . . . . . . . . . . . . . . . . . . . . . . . . . . . . . . . . .
393 417 441 475
v
vi
BusinessObjects XI: The Complete Reference
21 22 23 24
Advanced Report and Chart Formatting . . . . . . . . . . . . . . . . . . . . . . . . . . . . . Formulas and Variables . . . . . . . . . . . . . . . . . . . . . . . . . . . . . . . . . . . . . . . . . . . Complex Queries . . . . . . . . . . . . . . . . . . . . . . . . . . . . . . . . . . . . . . . . . . . . . . . . . Desktop Intelligence . . . . . . . . . . . . . . . . . . . . . . . . . . . . . . . . . . . . . . . . . . . . . .
497 535 591 611
Bibliography
.....................................................
637
...........................................................
639
Index
For more information about this title, click here
Contents Foreword . . . . . . . . . . . . . . . . . . . . . . . . . . . . . . . . . . . . . . . . . . . . . . . . . . . . . . . . xvii Acknowledgments . . . . . . . . . . . . . . . . . . . . . . . . . . . . . . . . . . . . . . . . . . . . . . . . xix Introduction . . . . . . . . . . . . . . . . . . . . . . . . . . . . . . . . . . . . . . . . . . . . . . . . . . . . . . xxi
Part I Getting Ready for BusinessObjects XI 1
Introduction to Business Intelligence . . . . . . . . . . . . . . . . . . . . . . . . . . . . . . . The Background of Business Intelligence . . . . . . . . . . . . . . . . . . . . . . . . . . . . . Business Intelligence Is Born . . . . . . . . . . . . . . . . . . . . . . . . . . . . . . . . . Data Warehouse Speeds BI Adoption . . . . . . . . . . . . . . . . . . . . . . . . . . The Internet Influence . . . . . . . . . . . . . . . . . . . . . . . . . . . . . . . . . . . . . . . A Broader BI Suite . . . . . . . . . . . . . . . . . . . . . . . . . . . . . . . . . . . . . . . . . . . . . . . . Data Integration . . . . . . . . . . . . . . . . . . . . . . . . . . . . . . . . . . . . . . . . . . . . Query and Reporting . . . . . . . . . . . . . . . . . . . . . . . . . . . . . . . . . . . . . . . . Analysis . . . . . . . . . . . . . . . . . . . . . . . . . . . . . . . . . . . . . . . . . . . . . . . . . . . Analytic Applications . . . . . . . . . . . . . . . . . . . . . . . . . . . . . . . . . . . . . . . Dashboards and Scorecards . . . . . . . . . . . . . . . . . . . . . . . . . . . . . . . . . . Data Mining . . . . . . . . . . . . . . . . . . . . . . . . . . . . . . . . . . . . . . . . . . . . . . . . The History of Business Objects the Company . . . . . . . . . . . . . . . . . . . . . . . . Product Innovation . . . . . . . . . . . . . . . . . . . . . . . . . . . . . . . . . . . . . . . . . The Future . . . . . . . . . . . . . . . . . . . . . . . . . . . . . . . . . . . . . . . . . . . . . . . . . . . . . . . Summary . . . . . . . . . . . . . . . . . . . . . . . . . . . . . . . . . . . . . . . . . . . . . . . . . . . . . . . .
3 3 6 8 9 10 10 13 14 16 16 17 19 19 21 21
2
Goals of Deploying BusinessObjects XI . . . . . . . . . . . . . . . . . . . . . . . . . . . . IT Goals . . . . . . . . . . . . . . . . . . . . . . . . . . . . . . . . . . . . . . . . . . . . . . . . . . . . . . . . . Reporting Directly Against a Transaction System . . . . . . . . . . . . . . . . Business Goals . . . . . . . . . . . . . . . . . . . . . . . . . . . . . . . . . . . . . . . . . . . . . . . . . . . BI Standardization: A Joint Goal . . . . . . . . . . . . . . . . . . . . . . . . . . . . . . . . . . . . Measures of Success . . . . . . . . . . . . . . . . . . . . . . . . . . . . . . . . . . . . . . . . . . . . . . . ROI as a Measure of Success . . . . . . . . . . . . . . . . . . . . . . . . . . . . . . . . . . Summary . . . . . . . . . . . . . . . . . . . . . . . . . . . . . . . . . . . . . . . . . . . . . . . . . . . . . . . .
23 24 25 27 30 31 34 35
3
Understanding Your Users . . . . . . . . . . . . . . . . . . . . . . . . . . . . . . . . . . . . . . . . . What Is Segmentation? . . . . . . . . . . . . . . . . . . . . . . . . . . . . . . . . . . . . . . . . . . . . Others Who Affect Implementation Efforts . . . . . . . . . . . . . . . . . . . . . . . . . . . Gatekeepers . . . . . . . . . . . . . . . . . . . . . . . . . . . . . . . . . . . . . . . . . . . . . . . .
37 37 41 41
vii
viii
BusinessObjects XI: The Complete Reference
Influencers . . . . . . . . . . . . . . . . . . . . . . . . . . . . . . . . . . . . . . . . . . . . . . . . . Deciders . . . . . . . . . . . . . . . . . . . . . . . . . . . . . . . . . . . . . . . . . . . . . . . . . . . When to Analyze Segments . . . . . . . . . . . . . . . . . . . . . . . . . . . . . . . . . . . . . . . . Project Roles . . . . . . . . . . . . . . . . . . . . . . . . . . . . . . . . . . . . . . . . . . . . . . . . . . . . . Summary . . . . . . . . . . . . . . . . . . . . . . . . . . . . . . . . . . . . . . . . . . . . . . . . . . . . . . . .
42 43 44 44 47
4
Marketing BusinessObjects XI . . . . . . . . . . . . . . . . . . . . . . . . . . . . . . . . . . . . . When to Develop a Marketing Plan . . . . . . . . . . . . . . . . . . . . . . . . . . . . . . . . . Elements of a BI Marketing Plan . . . . . . . . . . . . . . . . . . . . . . . . . . . . . . . . . . . . Situation Analysis . . . . . . . . . . . . . . . . . . . . . . . . . . . . . . . . . . . . . . . . . . . . . . . . . Marketing Mix: The Four Ps . . . . . . . . . . . . . . . . . . . . . . . . . . . . . . . . . . . . . . . . Product . . . . . . . . . . . . . . . . . . . . . . . . . . . . . . . . . . . . . . . . . . . . . . . . . . . . Price . . . . . . . . . . . . . . . . . . . . . . . . . . . . . . . . . . . . . . . . . . . . . . . . . . . . . . Place . . . . . . . . . . . . . . . . . . . . . . . . . . . . . . . . . . . . . . . . . . . . . . . . . . . . . . Promotion . . . . . . . . . . . . . . . . . . . . . . . . . . . . . . . . . . . . . . . . . . . . . . . . . Approaches to Training . . . . . . . . . . . . . . . . . . . . . . . . . . . . . . . . . . . . . . . . . . . . Customizing per Segment . . . . . . . . . . . . . . . . . . . . . . . . . . . . . . . . . . . . . . . . . . Summary . . . . . . . . . . . . . . . . . . . . . . . . . . . . . . . . . . . . . . . . . . . . . . . . . . . . . . . .
49 49 50 50 53 53 55 56 56 60 61 62
5
Under the Covers: Migrating to a New Architecture . . . . . . . . . . . . . . . . . . File-Based Repository . . . . . . . . . . . . . . . . . . . . . . . . . . . . . . . . . . . . . . . . . . . . . Optimized Processes . . . . . . . . . . . . . . . . . . . . . . . . . . . . . . . . . . . . . . . . . . . . . . Migration . . . . . . . . . . . . . . . . . . . . . . . . . . . . . . . . . . . . . . . . . . . . . . . . . . . . . . . . Planning Your Migration . . . . . . . . . . . . . . . . . . . . . . . . . . . . . . . . . . . . . Testing the New Environment . . . . . . . . . . . . . . . . . . . . . . . . . . . . . . . . Implementation Phase: Going Live with Your BusinessObjects XI Migration . . . . . . . . . . . . . . . . . . . . . . . . . . . . . . . . . . . . . . . . . . . . . . . Ramp Up and Redesign . . . . . . . . . . . . . . . . . . . . . . . . . . . . . . . . . . . . . . Import Wizard . . . . . . . . . . . . . . . . . . . . . . . . . . . . . . . . . . . . . . . . . . . . . . . . . . . . Report Conversion . . . . . . . . . . . . . . . . . . . . . . . . . . . . . . . . . . . . . . . . . . . . . . . . Summary . . . . . . . . . . . . . . . . . . . . . . . . . . . . . . . . . . . . . . . . . . . . . . . . . . . . . . . .
63 63 65 67 69 75 78 78 79 85 89
Part II A Better Universe 6
Universe Design Principles . . . . . . . . . . . . . . . . . . . . . . . . . . . . . . . . . . . . . . . . Keep It Simple . . . . . . . . . . . . . . . . . . . . . . . . . . . . . . . . . . . . . . . . . . . . . . . . . . . . Technical Realities . . . . . . . . . . . . . . . . . . . . . . . . . . . . . . . . . . . . . . . . . . Align with Business Goals . . . . . . . . . . . . . . . . . . . . . . . . . . . . . . . . . . . . . . . . . Existing Data Warehouse . . . . . . . . . . . . . . . . . . . . . . . . . . . . . . . . . . . . . New Data Warehouse . . . . . . . . . . . . . . . . . . . . . . . . . . . . . . . . . . . . . . . Transaction System . . . . . . . . . . . . . . . . . . . . . . . . . . . . . . . . . . . . . . . . . . Evolving the Universe . . . . . . . . . . . . . . . . . . . . . . . . . . . . . . . . . . . . . . . . . . . . . Universe Components . . . . . . . . . . . . . . . . . . . . . . . . . . . . . . . . . . . . . . . . . . . . . Parameters . . . . . . . . . . . . . . . . . . . . . . . . . . . . . . . . . . . . . . . . . . . . . . . . . Classes and Objects . . . . . . . . . . . . . . . . . . . . . . . . . . . . . . . . . . . . . . . . . Tables, Joins, and Contexts . . . . . . . . . . . . . . . . . . . . . . . . . . . . . . . . . . .
93 93 94 95 95 95 96 96 98 98 98 99
Contents
How Designer Works . . . . . . . . . . . . . . . . . . . . . . . . . . . . . . . . . . . . . . . . . . . . . . Universe Storage During Development . . . . . . . . . . . . . . . . . . . . . . . . Universe Storage for Deployment . . . . . . . . . . . . . . . . . . . . . . . . . . . . . Crystal Business Views . . . . . . . . . . . . . . . . . . . . . . . . . . . . . . . . . . . . . . . . . . . . Summary . . . . . . . . . . . . . . . . . . . . . . . . . . . . . . . . . . . . . . . . . . . . . . . . . . . . . . . .
103 103 103 105 106
7
Using Designer to Build a Basic Universe . . . . . . . . . . . . . . . . . . . . . . . . . . . Launching Designer . . . . . . . . . . . . . . . . . . . . . . . . . . . . . . . . . . . . . . . . . . . . . . . Opening a Universe . . . . . . . . . . . . . . . . . . . . . . . . . . . . . . . . . . . . . . . . . . . . . . . Folders and Domains . . . . . . . . . . . . . . . . . . . . . . . . . . . . . . . . . . . . . . . . . . . . . . Designer Workspace . . . . . . . . . . . . . . . . . . . . . . . . . . . . . . . . . . . . . . . . . . . . . . . Designer Toolbars . . . . . . . . . . . . . . . . . . . . . . . . . . . . . . . . . . . . . . . . . . . . . . . . . Universe Parameters . . . . . . . . . . . . . . . . . . . . . . . . . . . . . . . . . . . . . . . . . . . . . . Definition Tab . . . . . . . . . . . . . . . . . . . . . . . . . . . . . . . . . . . . . . . . . . . . . . Summary Tab . . . . . . . . . . . . . . . . . . . . . . . . . . . . . . . . . . . . . . . . . . . . . . Strategies Tab . . . . . . . . . . . . . . . . . . . . . . . . . . . . . . . . . . . . . . . . . . . . . . Controls Tab . . . . . . . . . . . . . . . . . . . . . . . . . . . . . . . . . . . . . . . . . . . . . . . SQL Tab . . . . . . . . . . . . . . . . . . . . . . . . . . . . . . . . . . . . . . . . . . . . . . . . . . . Links Tab . . . . . . . . . . . . . . . . . . . . . . . . . . . . . . . . . . . . . . . . . . . . . . . . . . Parameter Tab . . . . . . . . . . . . . . . . . . . . . . . . . . . . . . . . . . . . . . . . . . . . . . Universe Connections . . . . . . . . . . . . . . . . . . . . . . . . . . . . . . . . . . . . . . . . . . . . . Connection Types . . . . . . . . . . . . . . . . . . . . . . . . . . . . . . . . . . . . . . . . . . . Two Approaches to Login Parameters . . . . . . . . . . . . . . . . . . . . . . . . . Advanced Connection Parameters . . . . . . . . . . . . . . . . . . . . . . . . . . . . Custom Connection Parameters . . . . . . . . . . . . . . . . . . . . . . . . . . . . . . . Creating a Connection Step-by-Step . . . . . . . . . . . . . . . . . . . . . . . . . . . Designer Options . . . . . . . . . . . . . . . . . . . . . . . . . . . . . . . . . . . . . . . . . . . . . . . . . Database Options . . . . . . . . . . . . . . . . . . . . . . . . . . . . . . . . . . . . . . . . . . . Quick Design Wizard . . . . . . . . . . . . . . . . . . . . . . . . . . . . . . . . . . . . . . . . . . . . . . Summary . . . . . . . . . . . . . . . . . . . . . . . . . . . . . . . . . . . . . . . . . . . . . . . . . . . . . . . .
107 107 108 109 110 110 114 114 115 116 124 125 129 130 131 132 132 135 137 137 138 138 139 142
8
Universe Joins . . . . . . . . . . . . . . . . . . . . . . . . . . . . . . . . . . . . . . . . . . . . . . . . . . . Join Graphics . . . . . . . . . . . . . . . . . . . . . . . . . . . . . . . . . . . . . . . . . . . . . . . . . . . . . Show Row Count . . . . . . . . . . . . . . . . . . . . . . . . . . . . . . . . . . . . . . . . . . . Basic Joins . . . . . . . . . . . . . . . . . . . . . . . . . . . . . . . . . . . . . . . . . . . . . . . . . . . . . . . Cardinality . . . . . . . . . . . . . . . . . . . . . . . . . . . . . . . . . . . . . . . . . . . . . . . . . Outer Joins . . . . . . . . . . . . . . . . . . . . . . . . . . . . . . . . . . . . . . . . . . . . . . . . . . . . . . . About ANSI 92 or SQL 92 . . . . . . . . . . . . . . . . . . . . . . . . . . . . . . . . . . . . . . . . . . Setting Universe Parameters for ANSI 92 . . . . . . . . . . . . . . . . . . . . . . . Loops and Contexts . . . . . . . . . . . . . . . . . . . . . . . . . . . . . . . . . . . . . . . . . . . . . . . Valid Business Questions That Demand Contexts . . . . . . . . . . . . . . . Inserting a New Context . . . . . . . . . . . . . . . . . . . . . . . . . . . . . . . . . . . . . Processing Contexts on the RDBMS . . . . . . . . . . . . . . . . . . . . . . . . . . . Chasm Traps and Contexts . . . . . . . . . . . . . . . . . . . . . . . . . . . . . . . . . . . Fan Traps and Many-to-Many Joins . . . . . . . . . . . . . . . . . . . . . . . . . . . Contexts Versus Aliases . . . . . . . . . . . . . . . . . . . . . . . . . . . . . . . . . . . . . .
143 143 146 146 149 150 153 153 154 155 156 163 166 168 168
ix
x
BusinessObjects XI: The Complete Reference
Composite Keys and Complex Joins . . . . . . . . . . . . . . . . . . . . . . . . . . . . . . . . . Aliases . . . . . . . . . . . . . . . . . . . . . . . . . . . . . . . . . . . . . . . . . . . . . . . . . . . . . . . . . . Detecting Aliases . . . . . . . . . . . . . . . . . . . . . . . . . . . . . . . . . . . . . . . . . . . Renaming the Alias . . . . . . . . . . . . . . . . . . . . . . . . . . . . . . . . . . . . . . . . . Inserting Aliases Manually . . . . . . . . . . . . . . . . . . . . . . . . . . . . . . . . . . . Self-Joins and Aliases . . . . . . . . . . . . . . . . . . . . . . . . . . . . . . . . . . . . . . . . . . . . . . Forcing a Join . . . . . . . . . . . . . . . . . . . . . . . . . . . . . . . . . . . . . . . . . . . . . . Shortcut Joins . . . . . . . . . . . . . . . . . . . . . . . . . . . . . . . . . . . . . . . . . . . . . . . . . . . . Summary . . . . . . . . . . . . . . . . . . . . . . . . . . . . . . . . . . . . . . . . . . . . . . . . . . . . . . . .
168 171 171 173 174 175 176 177 178
9
Classes and Objects . . . . . . . . . . . . . . . . . . . . . . . . . . . . . . . . . . . . . . . . . . . . . . The Universe Pane . . . . . . . . . . . . . . . . . . . . . . . . . . . . . . . . . . . . . . . . . . . . . . . . Types of Objects . . . . . . . . . . . . . . . . . . . . . . . . . . . . . . . . . . . . . . . . . . . . . . . . . . Dimension . . . . . . . . . . . . . . . . . . . . . . . . . . . . . . . . . . . . . . . . . . . . . . . . . Measure . . . . . . . . . . . . . . . . . . . . . . . . . . . . . . . . . . . . . . . . . . . . . . . . . . . Detail . . . . . . . . . . . . . . . . . . . . . . . . . . . . . . . . . . . . . . . . . . . . . . . . . . . . . Object Ordering . . . . . . . . . . . . . . . . . . . . . . . . . . . . . . . . . . . . . . . . . . . . . . . . . . Naming Conventions . . . . . . . . . . . . . . . . . . . . . . . . . . . . . . . . . . . . . . . . . . . . . . Customer Oriented . . . . . . . . . . . . . . . . . . . . . . . . . . . . . . . . . . . . . . . . . . Clear . . . . . . . . . . . . . . . . . . . . . . . . . . . . . . . . . . . . . . . . . . . . . . . . . . . . . . Consistent . . . . . . . . . . . . . . . . . . . . . . . . . . . . . . . . . . . . . . . . . . . . . . . . . Concise . . . . . . . . . . . . . . . . . . . . . . . . . . . . . . . . . . . . . . . . . . . . . . . . . . . . Warning: Cutting and Pasting Objects and Object IDs . . . . . . . . . . . . Working with Classes and Objects . . . . . . . . . . . . . . . . . . . . . . . . . . . . . . . . . . . Rename an Object . . . . . . . . . . . . . . . . . . . . . . . . . . . . . . . . . . . . . . . . . . . Delete an Object . . . . . . . . . . . . . . . . . . . . . . . . . . . . . . . . . . . . . . . . . . . . Hide . . . . . . . . . . . . . . . . . . . . . . . . . . . . . . . . . . . . . . . . . . . . . . . . . . . . . . Modify a Dimension . . . . . . . . . . . . . . . . . . . . . . . . . . . . . . . . . . . . . . . . Object Keys . . . . . . . . . . . . . . . . . . . . . . . . . . . . . . . . . . . . . . . . . . . . . . . . Source Information . . . . . . . . . . . . . . . . . . . . . . . . . . . . . . . . . . . . . . . . . . Modify a Detail or Attribute . . . . . . . . . . . . . . . . . . . . . . . . . . . . . . . . . . . . . . . . Insert a Measure . . . . . . . . . . . . . . . . . . . . . . . . . . . . . . . . . . . . . . . . . . . . . . . . . . About Aggregates . . . . . . . . . . . . . . . . . . . . . . . . . . . . . . . . . . . . . . . . . . . Object Formats . . . . . . . . . . . . . . . . . . . . . . . . . . . . . . . . . . . . . . . . . . . . . . . . . . . Summary . . . . . . . . . . . . . . . . . . . . . . . . . . . . . . . . . . . . . . . . . . . . . . . . . . . . . . . .
179 179 180 181 181 183 183 185 185 186 186 187 187 187 188 189 190 190 196 199 200 201 203 204 206
10
List of Values . . . . . . . . . . . . . . . . . . . . . . . . . . . . . . . . . . . . . . . . . . . . . . . . . . . . How List of Values Works . . . . . . . . . . . . . . . . . . . . . . . . . . . . . . . . . . . . . . . . . . List of Values Settings . . . . . . . . . . . . . . . . . . . . . . . . . . . . . . . . . . . . . . . . . . . . . When to Disable LOVS . . . . . . . . . . . . . . . . . . . . . . . . . . . . . . . . . . . . . . Simple Customization . . . . . . . . . . . . . . . . . . . . . . . . . . . . . . . . . . . . . . . . . . . . . Adding a Description Object to an ID Object . . . . . . . . . . . . . . . . . . . . Cascading Lists of Values . . . . . . . . . . . . . . . . . . . . . . . . . . . . . . . . . . . . Tabular vs. Hierarchical Views . . . . . . . . . . . . . . . . . . . . . . . . . . . . . . . . Reusable Lists of Values . . . . . . . . . . . . . . . . . . . . . . . . . . . . . . . . . . . . . . . . . . . Incorporating Personal Data Files . . . . . . . . . . . . . . . . . . . . . . . . . . . . . . . . . . . Summary . . . . . . . . . . . . . . . . . . . . . . . . . . . . . . . . . . . . . . . . . . . . . . . . . . . . . . . .
207 207 210 211 212 213 217 222 225 226 228
Contents
11
Advanced Objects . . . . . . . . . . . . . . . . . . . . . . . . . . . . . . . . . . . . . . . . . . . . . . . . Reducing Maintenance with Base Objects and @Select . . . . . . . . . . . . . . . . . The SQL Editor . . . . . . . . . . . . . . . . . . . . . . . . . . . . . . . . . . . . . . . . . . . . . . . . . . . Some Caveats about SQL Functions . . . . . . . . . . . . . . . . . . . . . . . . . . . . . . . . . SQL Parameters and the PRM File . . . . . . . . . . . . . . . . . . . . . . . . . . . . . Multiple Arguments and Prompt Messages . . . . . . . . . . . . . . . . . . . . . Condition Objects . . . . . . . . . . . . . . . . . . . . . . . . . . . . . . . . . . . . . . . . . . . . . . . . . Time Conditions . . . . . . . . . . . . . . . . . . . . . . . . . . . . . . . . . . . . . . . . . . . . Objects with Prompts: Interactive Objects . . . . . . . . . . . . . . . . . . . . . . . . . . . . Pseudo Optional Prompts . . . . . . . . . . . . . . . . . . . . . . . . . . . . . . . . . . . . Reusing Interactive Objects with @Variable . . . . . . . . . . . . . . . . . . . . . Reusing Interactive Objects with @Where . . . . . . . . . . . . . . . . . . . . . . Prompts in Objects vs. Reports . . . . . . . . . . . . . . . . . . . . . . . . . . . . . . . . Aggregate Awareness . . . . . . . . . . . . . . . . . . . . . . . . . . . . . . . . . . . . . . . . . . . . . Creating Aggregate Fact Tables . . . . . . . . . . . . . . . . . . . . . . . . . . . . . . . Identifying Dimension Tables Irrelevant to Aggregate Tables . . . . . Adding Aggregate Awareness to Measure Objects . . . . . . . . . . . . . . . Specifying Which Objects Are Not Compatible with the Aggregate Table . . . . . . . . . . . . . . . . . . . . . . . . . . . . . . . . . . . . . . . Testing and Viewing SQL Statements . . . . . . . . . . . . . . . . . . . . . . . . . . Derived Tables . . . . . . . . . . . . . . . . . . . . . . . . . . . . . . . . . . . . . . . . . . . . . . . . . . . HTML Links . . . . . . . . . . . . . . . . . . . . . . . . . . . . . . . . . . . . . . . . . . . . . . . . . . . . . About HTML . . . . . . . . . . . . . . . . . . . . . . . . . . . . . . . . . . . . . . . . . . . . . . . Popular SQL Functions . . . . . . . . . . . . . . . . . . . . . . . . . . . . . . . . . . . . . . . . . . . . Concatenated . . . . . . . . . . . . . . . . . . . . . . . . . . . . . . . . . . . . . . . . . . . . . . . Time Objects . . . . . . . . . . . . . . . . . . . . . . . . . . . . . . . . . . . . . . . . . . . . . . . If-Then-Else Logic with CASE . . . . . . . . . . . . . . . . . . . . . . . . . . . . . . . . Count . . . . . . . . . . . . . . . . . . . . . . . . . . . . . . . . . . . . . . . . . . . . . . . . . . . . . Rank . . . . . . . . . . . . . . . . . . . . . . . . . . . . . . . . . . . . . . . . . . . . . . . . . . . . . . Ratio to Report . . . . . . . . . . . . . . . . . . . . . . . . . . . . . . . . . . . . . . . . . . . . . Summary . . . . . . . . . . . . . . . . . . . . . . . . . . . . . . . . . . . . . . . . . . . . . . . . . . . . . . . .
229 229 230 230 231 234 234 238 239 242 243 243 244 244 246 247 247
12
Multidimensional Analysis . . . . . . . . . . . . . . . . . . . . . . . . . . . . . . . . . . . . . . . . What Is Multidimensional Analysis? . . . . . . . . . . . . . . . . . . . . . . . . . . . . . . . . Time Hierarchy . . . . . . . . . . . . . . . . . . . . . . . . . . . . . . . . . . . . . . . . . . . . . . . . . . . Limitations with Automatic Time Hierarchy . . . . . . . . . . . . . . . . . . . . Custom Hierarchies . . . . . . . . . . . . . . . . . . . . . . . . . . . . . . . . . . . . . . . . . OLAP Universes . . . . . . . . . . . . . . . . . . . . . . . . . . . . . . . . . . . . . . . . . . . . . . . . . . Summary . . . . . . . . . . . . . . . . . . . . . . . . . . . . . . . . . . . . . . . . . . . . . . . . . . . . . . . .
273 273 274 276 276 278 282
13
Securing the System . . . . . . . . . . . . . . . . . . . . . . . . . . . . . . . . . . . . . . . . . . . . . . The Enterprise Environment: What Needs Securing . . . . . . . . . . . . . . . . . . . Introducing the Central Management Console . . . . . . . . . . . . . . . . . . . . . . . . Transition Notes: Crystal and BusinessObjects . . . . . . . . . . . . . . . . . . Authentication . . . . . . . . . . . . . . . . . . . . . . . . . . . . . . . . . . . . . . . . . . . . . . . . . . . Enterprise Authentication . . . . . . . . . . . . . . . . . . . . . . . . . . . . . . . . . . . .
283 283 284 286 288 288
250 252 256 258 258 261 261 261 263 266 269 270 271
xi
xii
BusinessObjects XI: The Complete Reference
Adding a User . . . . . . . . . . . . . . . . . . . . . . . . . . . . . . . . . . . . . . . . . . . . . . External Authentication with Windows NT . . . . . . . . . . . . . . . . . . . . . Defining Groups . . . . . . . . . . . . . . . . . . . . . . . . . . . . . . . . . . . . . . . . . . . . Planning for Authorization . . . . . . . . . . . . . . . . . . . . . . . . . . . . . . . . . . . . . . . . . Understanding Your Company’s Organization . . . . . . . . . . . . . . . . . . Access Levels . . . . . . . . . . . . . . . . . . . . . . . . . . . . . . . . . . . . . . . . . . . . . . . Folders and Categories . . . . . . . . . . . . . . . . . . . . . . . . . . . . . . . . . . . . . . Checking Rights . . . . . . . . . . . . . . . . . . . . . . . . . . . . . . . . . . . . . . . . . . . . Centralized or Decentralized Security: Who’s My Supervisor? . . . . . . . . . . Designating a Supervisor for a Group . . . . . . . . . . . . . . . . . . . . . . . . . . Allowing Supervisors to Add Users . . . . . . . . . . . . . . . . . . . . . . . . . . . Granting Access to Universes . . . . . . . . . . . . . . . . . . . . . . . . . . . . . . . . . . . . . . . Further Securing the Data: Column- and Row-Level Security . . . . . . . . . . . Object-Level Security . . . . . . . . . . . . . . . . . . . . . . . . . . . . . . . . . . . . . . . . Object Restrictions . . . . . . . . . . . . . . . . . . . . . . . . . . . . . . . . . . . . . . . . . . Universe Parameter Restrictions: Connection, Controls, SQL . . . . . . Row Restrictions . . . . . . . . . . . . . . . . . . . . . . . . . . . . . . . . . . . . . . . . . . . . Table Mappings . . . . . . . . . . . . . . . . . . . . . . . . . . . . . . . . . . . . . . . . . . . . . Setting Restriction Priorities . . . . . . . . . . . . . . . . . . . . . . . . . . . . . . . . . . Previewing Net Restrictions . . . . . . . . . . . . . . . . . . . . . . . . . . . . . . . . . . Summary . . . . . . . . . . . . . . . . . . . . . . . . . . . . . . . . . . . . . . . . . . . . . . . . . . . . . . . .
290 292 293 294 294 295 297 302 304 304 305 307 309 309 312 317 318 322 324 326 327
14
Design Principles: Where to Put the Intelligence . . . . . . . . . . . . . . . . . . . . . What Is Intelligence? . . . . . . . . . . . . . . . . . . . . . . . . . . . . . . . . . . . . . . . . . . . . . . Places for Intelligence . . . . . . . . . . . . . . . . . . . . . . . . . . . . . . . . . . . . . . . . . . . . . Evaluating the Pros and Cons of Each Alternative . . . . . . . . . . . . . . . . . . . . . OLAP Databases . . . . . . . . . . . . . . . . . . . . . . . . . . . . . . . . . . . . . . . . . . . . User Objects . . . . . . . . . . . . . . . . . . . . . . . . . . . . . . . . . . . . . . . . . . . . . . . . User Reports . . . . . . . . . . . . . . . . . . . . . . . . . . . . . . . . . . . . . . . . . . . . . . . Summary . . . . . . . . . . . . . . . . . . . . . . . . . . . . . . . . . . . . . . . . . . . . . . . . . . . . . . . .
329 329 330 331 331 340 341 346
15
Minimizing Universe Maintenance . . . . . . . . . . . . . . . . . . . . . . . . . . . . . . . . . Linked Universes . . . . . . . . . . . . . . . . . . . . . . . . . . . . . . . . . . . . . . . . . . . . . . . . . What Gets Linked . . . . . . . . . . . . . . . . . . . . . . . . . . . . . . . . . . . . . . . . . . . . . . . . . How Linking Works . . . . . . . . . . . . . . . . . . . . . . . . . . . . . . . . . . . . . . . . . . . . . . . How to Add a Link . . . . . . . . . . . . . . . . . . . . . . . . . . . . . . . . . . . . . . . . . . . . . . . . Permanently Importing Universe Components . . . . . . . . . . . . . . . . . . . . . . . Removing a Link . . . . . . . . . . . . . . . . . . . . . . . . . . . . . . . . . . . . . . . . . . . . . . . . . Object Sort Order . . . . . . . . . . . . . . . . . . . . . . . . . . . . . . . . . . . . . . . . . . . . . . . . . Approaches to Development, Test, and Production Universes . . . . . . . . . . . Multiple CMSs and BIAR files . . . . . . . . . . . . . . . . . . . . . . . . . . . . . . . . Test Folders . . . . . . . . . . . . . . . . . . . . . . . . . . . . . . . . . . . . . . . . . . . . . . . . Multiple Designers . . . . . . . . . . . . . . . . . . . . . . . . . . . . . . . . . . . . . . . . . . . . . . . . Metadata Integration . . . . . . . . . . . . . . . . . . . . . . . . . . . . . . . . . . . . . . . . . . . . . . Summary . . . . . . . . . . . . . . . . . . . . . . . . . . . . . . . . . . . . . . . . . . . . . . . . . . . . . . . .
347 347 349 350 350 352 353 353 354 355 360 365 367 368
Contents
16
Getting Ready for Production . . . . . . . . . . . . . . . . . . . . . . . . . . . . . . . . . . . . . . Universe Integrity . . . . . . . . . . . . . . . . . . . . . . . . . . . . . . . . . . . . . . . . . . . . . . . . . Checking as You Go . . . . . . . . . . . . . . . . . . . . . . . . . . . . . . . . . . . . . . . . . Universe Documentation . . . . . . . . . . . . . . . . . . . . . . . . . . . . . . . . . . . . . . . . . . Quality Assurance Checklist . . . . . . . . . . . . . . . . . . . . . . . . . . . . . . . . . . . . . . . . Benchmark Reports . . . . . . . . . . . . . . . . . . . . . . . . . . . . . . . . . . . . . . . . . . . . . . . Use Cases . . . . . . . . . . . . . . . . . . . . . . . . . . . . . . . . . . . . . . . . . . . . . . . . . . Performance Bottlenecks . . . . . . . . . . . . . . . . . . . . . . . . . . . . . . . . . . . . . Monitoring User Activity . . . . . . . . . . . . . . . . . . . . . . . . . . . . . . . . . . . . . . . . . . Summary . . . . . . . . . . . . . . . . . . . . . . . . . . . . . . . . . . . . . . . . . . . . . . . . . . . . . . . .
369 369 371 373 377 380 381 381 384 390
Part III Reporting and Analysis 17
Navigating InfoView . . . . . . . . . . . . . . . . . . . . . . . . . . . . . . . . . . . . . . . . . . . . . Logging In to InfoView . . . . . . . . . . . . . . . . . . . . . . . . . . . . . . . . . . . . . . . . . . . . About Passwords . . . . . . . . . . . . . . . . . . . . . . . . . . . . . . . . . . . . . . . . . . . The InfoView Panels . . . . . . . . . . . . . . . . . . . . . . . . . . . . . . . . . . . . . . . . . . . . . . The Header Panel . . . . . . . . . . . . . . . . . . . . . . . . . . . . . . . . . . . . . . . . . . . Navigation Panel . . . . . . . . . . . . . . . . . . . . . . . . . . . . . . . . . . . . . . . . . . . Accessing Documents . . . . . . . . . . . . . . . . . . . . . . . . . . . . . . . . . . . . . . . . . . . . . Organizing Documents . . . . . . . . . . . . . . . . . . . . . . . . . . . . . . . . . . . . . . InfoView Preferences . . . . . . . . . . . . . . . . . . . . . . . . . . . . . . . . . . . . . . . . . . . . . . General . . . . . . . . . . . . . . . . . . . . . . . . . . . . . . . . . . . . . . . . . . . . . . . . . . . . Document Options . . . . . . . . . . . . . . . . . . . . . . . . . . . . . . . . . . . . . . . . . . My InfoView Dashboard . . . . . . . . . . . . . . . . . . . . . . . . . . . . . . . . . . . . . . . . . . . Summary . . . . . . . . . . . . . . . . . . . . . . . . . . . . . . . . . . . . . . . . . . . . . . . . . . . . . . . .
393 393 395 396 396 396 400 402 404 404 407 412 415
18
Working with Documents . . . . . . . . . . . . . . . . . . . . . . . . . . . . . . . . . . . . . . . . . Opening a Document . . . . . . . . . . . . . . . . . . . . . . . . . . . . . . . . . . . . . . . . . . . . . . View Modes . . . . . . . . . . . . . . . . . . . . . . . . . . . . . . . . . . . . . . . . . . . . . . . . Navigation Map . . . . . . . . . . . . . . . . . . . . . . . . . . . . . . . . . . . . . . . . . . . . Understanding a Document’s Structure . . . . . . . . . . . . . . . . . . . . . . . . . . . . . . Components of a Report . . . . . . . . . . . . . . . . . . . . . . . . . . . . . . . . . . . . . . . . . . . Sections . . . . . . . . . . . . . . . . . . . . . . . . . . . . . . . . . . . . . . . . . . . . . . . . . . . Blocks . . . . . . . . . . . . . . . . . . . . . . . . . . . . . . . . . . . . . . . . . . . . . . . . . . . . . Variables and Cells . . . . . . . . . . . . . . . . . . . . . . . . . . . . . . . . . . . . . . . . . . Refreshing a Document . . . . . . . . . . . . . . . . . . . . . . . . . . . . . . . . . . . . . . . . . . . . Canceling a Query . . . . . . . . . . . . . . . . . . . . . . . . . . . . . . . . . . . . . . . . . . Time Limit Interruptions . . . . . . . . . . . . . . . . . . . . . . . . . . . . . . . . . . . . . Handling Prompts and Lists of Values . . . . . . . . . . . . . . . . . . . . . . . . . . . . . . . Customized Lists of Values . . . . . . . . . . . . . . . . . . . . . . . . . . . . . . . . . . . Multiple Prompts . . . . . . . . . . . . . . . . . . . . . . . . . . . . . . . . . . . . . . . . . . . Saving Documents . . . . . . . . . . . . . . . . . . . . . . . . . . . . . . . . . . . . . . . . . . . . . . . . Save To My Computer As . . . . . . . . . . . . . . . . . . . . . . . . . . . . . . . . . . . . Scheduling a Document . . . . . . . . . . . . . . . . . . . . . . . . . . . . . . . . . . . . . . . . . . . E-Mail Recipients . . . . . . . . . . . . . . . . . . . . . . . . . . . . . . . . . . . . . . . . . . .
417 417 418 419 420 421 422 422 423 423 424 425 425 427 428 429 430 431 433
xiii
xiv
BusinessObjects XI: The Complete Reference
Events . . . . . . . . . . . . . . . . . . . . . . . . . . . . . . . . . . . . . . . . . . . . . . . . . . . . . Viewing Instances and Status . . . . . . . . . . . . . . . . . . . . . . . . . . . . . . . . . Logging Off . . . . . . . . . . . . . . . . . . . . . . . . . . . . . . . . . . . . . . . . . . . . . . . . . . . . . . Summary . . . . . . . . . . . . . . . . . . . . . . . . . . . . . . . . . . . . . . . . . . . . . . . . . . . . . . . .
435 438 439 440
19
Analyzing the Data . . . . . . . . . . . . . . . . . . . . . . . . . . . . . . . . . . . . . . . . . . . . . . . The HTML Interactive Viewer . . . . . . . . . . . . . . . . . . . . . . . . . . . . . . . . . . . . . . Block Types . . . . . . . . . . . . . . . . . . . . . . . . . . . . . . . . . . . . . . . . . . . . . . . . . . . . . . Table . . . . . . . . . . . . . . . . . . . . . . . . . . . . . . . . . . . . . . . . . . . . . . . . . . . . . . Crosstab . . . . . . . . . . . . . . . . . . . . . . . . . . . . . . . . . . . . . . . . . . . . . . . . . . . Chart . . . . . . . . . . . . . . . . . . . . . . . . . . . . . . . . . . . . . . . . . . . . . . . . . . . . . . Master/Detail . . . . . . . . . . . . . . . . . . . . . . . . . . . . . . . . . . . . . . . . . . . . . . . . . . . . Sort . . . . . . . . . . . . . . . . . . . . . . . . . . . . . . . . . . . . . . . . . . . . . . . . . . . . . . . . . . . . . Breaks . . . . . . . . . . . . . . . . . . . . . . . . . . . . . . . . . . . . . . . . . . . . . . . . . . . . . . . . . . . Break Options . . . . . . . . . . . . . . . . . . . . . . . . . . . . . . . . . . . . . . . . . . . . . . Calculations . . . . . . . . . . . . . . . . . . . . . . . . . . . . . . . . . . . . . . . . . . . . . . . . . . . . . . Filter . . . . . . . . . . . . . . . . . . . . . . . . . . . . . . . . . . . . . . . . . . . . . . . . . . . . . . . . . . . . Removing the Filter . . . . . . . . . . . . . . . . . . . . . . . . . . . . . . . . . . . . . . . . . Measure Filters . . . . . . . . . . . . . . . . . . . . . . . . . . . . . . . . . . . . . . . . . . . . . Report Filters . . . . . . . . . . . . . . . . . . . . . . . . . . . . . . . . . . . . . . . . . . . . . . . Nested Filters . . . . . . . . . . . . . . . . . . . . . . . . . . . . . . . . . . . . . . . . . . . . . . Ranking . . . . . . . . . . . . . . . . . . . . . . . . . . . . . . . . . . . . . . . . . . . . . . . . . . . . . . . . . Server-Based Ranking . . . . . . . . . . . . . . . . . . . . . . . . . . . . . . . . . . . . . . . Drill . . . . . . . . . . . . . . . . . . . . . . . . . . . . . . . . . . . . . . . . . . . . . . . . . . . . . . . . . . . . . Understanding the Data . . . . . . . . . . . . . . . . . . . . . . . . . . . . . . . . . . . . . How Is the Data Aggregated? . . . . . . . . . . . . . . . . . . . . . . . . . . . . . . . . . Drill Down . . . . . . . . . . . . . . . . . . . . . . . . . . . . . . . . . . . . . . . . . . . . . . . . . Drill Up . . . . . . . . . . . . . . . . . . . . . . . . . . . . . . . . . . . . . . . . . . . . . . . . . . . Drill By . . . . . . . . . . . . . . . . . . . . . . . . . . . . . . . . . . . . . . . . . . . . . . . . . . . . Drill Across . . . . . . . . . . . . . . . . . . . . . . . . . . . . . . . . . . . . . . . . . . . . . . . . Snapshot . . . . . . . . . . . . . . . . . . . . . . . . . . . . . . . . . . . . . . . . . . . . . . . . . . . Drill Through To Detail . . . . . . . . . . . . . . . . . . . . . . . . . . . . . . . . . . . . . . . . . . . . Synchronized Drilling . . . . . . . . . . . . . . . . . . . . . . . . . . . . . . . . . . . . . . . Drill Options . . . . . . . . . . . . . . . . . . . . . . . . . . . . . . . . . . . . . . . . . . . . . . . Sharing Your Analysis: Discussions . . . . . . . . . . . . . . . . . . . . . . . . . . . . . . . . . . Summary . . . . . . . . . . . . . . . . . . . . . . . . . . . . . . . . . . . . . . . . . . . . . . . . . . . . . . . .
441 441 443 444 446 446 447 449 450 451 452 454 455 456 457 457 459 461 463 464 465 467 468 468 469 469 470 471 471 472 473
20
Creating a New Query . . . . . . . . . . . . . . . . . . . . . . . . . . . . . . . . . . . . . . . . . . . . Formulating a Business Question . . . . . . . . . . . . . . . . . . . . . . . . . . . . . . . . . . . Choosing a Query Panel . . . . . . . . . . . . . . . . . . . . . . . . . . . . . . . . . . . . . . . . . . . The Query Panel . . . . . . . . . . . . . . . . . . . . . . . . . . . . . . . . . . . . . . . . . . . . . . . . . . Building a Query Step-by-Step . . . . . . . . . . . . . . . . . . . . . . . . . . . . . . . . Result Objects . . . . . . . . . . . . . . . . . . . . . . . . . . . . . . . . . . . . . . . . . . . . . . . . . . . . Scope of Analysis . . . . . . . . . . . . . . . . . . . . . . . . . . . . . . . . . . . . . . . . . . . Query Filters . . . . . . . . . . . . . . . . . . . . . . . . . . . . . . . . . . . . . . . . . . . . . . . . . . . . . Adding a Query Filter . . . . . . . . . . . . . . . . . . . . . . . . . . . . . . . . . . . . . . . Operators . . . . . . . . . . . . . . . . . . . . . . . . . . . . . . . . . . . . . . . . . . . . . . . . . .
475 475 476 479 482 482 483 484 485 487
Contents
Operands . . . . . . . . . . . . . . . . . . . . . . . . . . . . . . . . . . . . . . . . . . . . . . . . . . Filters on Dates . . . . . . . . . . . . . . . . . . . . . . . . . . . . . . . . . . . . . . . . . . . . . Predefined Conditions . . . . . . . . . . . . . . . . . . . . . . . . . . . . . . . . . . . . . . . Prompts . . . . . . . . . . . . . . . . . . . . . . . . . . . . . . . . . . . . . . . . . . . . . . . . . . . Query Options . . . . . . . . . . . . . . . . . . . . . . . . . . . . . . . . . . . . . . . . . . . . . . . . . . . Query Refresh on Open . . . . . . . . . . . . . . . . . . . . . . . . . . . . . . . . . . . . . . OLAP Access . . . . . . . . . . . . . . . . . . . . . . . . . . . . . . . . . . . . . . . . . . . . . . . . . . . . . Summary . . . . . . . . . . . . . . . . . . . . . . . . . . . . . . . . . . . . . . . . . . . . . . . . . . . . . . . .
488 488 489 490 492 494 495 496
21
Advanced Report and Chart Formatting . . . . . . . . . . . . . . . . . . . . . . . . . . . . . The Formatting Toolbar . . . . . . . . . . . . . . . . . . . . . . . . . . . . . . . . . . . . . . . . . . . . What and How to Format . . . . . . . . . . . . . . . . . . . . . . . . . . . . . . . . . . . . . . . . . . Formatting a Cell . . . . . . . . . . . . . . . . . . . . . . . . . . . . . . . . . . . . . . . . . . . . . . . . . Formatting a Cell via Toolbar . . . . . . . . . . . . . . . . . . . . . . . . . . . . . . . . . The Formatting Dialog . . . . . . . . . . . . . . . . . . . . . . . . . . . . . . . . . . . . . . . Formatting in the Java Report Panel . . . . . . . . . . . . . . . . . . . . . . . . . . . . . . . . . Adding or Removing a Report . . . . . . . . . . . . . . . . . . . . . . . . . . . . . . . . Navigating Properties Within the Report Manager . . . . . . . . . . . . . . Inserting a New Table . . . . . . . . . . . . . . . . . . . . . . . . . . . . . . . . . . . . . . . Formatting Crosstabs . . . . . . . . . . . . . . . . . . . . . . . . . . . . . . . . . . . . . . . . Structure Mode . . . . . . . . . . . . . . . . . . . . . . . . . . . . . . . . . . . . . . . . . . . . . . . . . . . Additional Tabular Formatting . . . . . . . . . . . . . . . . . . . . . . . . . . . . . . . Additional Table Format Options . . . . . . . . . . . . . . . . . . . . . . . . . . . . . Alerters . . . . . . . . . . . . . . . . . . . . . . . . . . . . . . . . . . . . . . . . . . . . . . . . . . . . Formatting a Chart . . . . . . . . . . . . . . . . . . . . . . . . . . . . . . . . . . . . . . . . . . . . . . . . Chart Properties . . . . . . . . . . . . . . . . . . . . . . . . . . . . . . . . . . . . . . . . . . . . Chart Page Layout . . . . . . . . . . . . . . . . . . . . . . . . . . . . . . . . . . . . . . . . . . Page Layout . . . . . . . . . . . . . . . . . . . . . . . . . . . . . . . . . . . . . . . . . . . . . . . . . . . . . . Formatting Master/Detail Reports . . . . . . . . . . . . . . . . . . . . . . . . . . . . . . . . . . User Settings . . . . . . . . . . . . . . . . . . . . . . . . . . . . . . . . . . . . . . . . . . . . . . . . . . . . . Summary . . . . . . . . . . . . . . . . . . . . . . . . . . . . . . . . . . . . . . . . . . . . . . . . . . . . . . . .
497 497 499 499 499 501 504 506 507 507 510 512 513 517 521 525 526 530 530 533 534 534
22
Formulas and Variables . . . . . . . . . . . . . . . . . . . . . . . . . . . . . . . . . . . . . . . . . . . Web Intelligence Functions . . . . . . . . . . . . . . . . . . . . . . . . . . . . . . . . . . . . . . . . . Types of Formulas . . . . . . . . . . . . . . . . . . . . . . . . . . . . . . . . . . . . . . . . . . . . . . . . Syntax Differences Between Web Intelligence and Desktop Intelligence . . . . Creating a Formula Step-by-Step . . . . . . . . . . . . . . . . . . . . . . . . . . . . . . . . . . . . The HTML Report Panel Formula Editor . . . . . . . . . . . . . . . . . . . . . . . Saving Formulas as Variables . . . . . . . . . . . . . . . . . . . . . . . . . . . . . . . . . . . . . . . Creating a New Variable . . . . . . . . . . . . . . . . . . . . . . . . . . . . . . . . . . . . . Using Operators in Formulas . . . . . . . . . . . . . . . . . . . . . . . . . . . . . . . . . . . . . . . Mathematical . . . . . . . . . . . . . . . . . . . . . . . . . . . . . . . . . . . . . . . . . . . . . . . Conditional . . . . . . . . . . . . . . . . . . . . . . . . . . . . . . . . . . . . . . . . . . . . . . . . Logical . . . . . . . . . . . . . . . . . . . . . . . . . . . . . . . . . . . . . . . . . . . . . . . . . . . . Where . . . . . . . . . . . . . . . . . . . . . . . . . . . . . . . . . . . . . . . . . . . . . . . . . . . . . Context . . . . . . . . . . . . . . . . . . . . . . . . . . . . . . . . . . . . . . . . . . . . . . . . . . . . Function Specific . . . . . . . . . . . . . . . . . . . . . . . . . . . . . . . . . . . . . . . . . . . .
535 535 540 540 541 543 545 545 548 548 548 549 549 549 550
xv
xvi
BusinessObjects XI: The Complete Reference
Using Functions in Formulas . . . . . . . . . . . . . . . . . . . . . . . . . . . . . . . . . . . . . . . All Functions . . . . . . . . . . . . . . . . . . . . . . . . . . . . . . . . . . . . . . . . . . . . . . . Aggregate Functions . . . . . . . . . . . . . . . . . . . . . . . . . . . . . . . . . . . . . . . . Character Functions . . . . . . . . . . . . . . . . . . . . . . . . . . . . . . . . . . . . . . . . . Date and Time Functions . . . . . . . . . . . . . . . . . . . . . . . . . . . . . . . . . . . . . Document Functions . . . . . . . . . . . . . . . . . . . . . . . . . . . . . . . . . . . . . . . . DataProvider Functions . . . . . . . . . . . . . . . . . . . . . . . . . . . . . . . . . . . . . . Miscellaneous Functions . . . . . . . . . . . . . . . . . . . . . . . . . . . . . . . . . . . . . Logical Functions . . . . . . . . . . . . . . . . . . . . . . . . . . . . . . . . . . . . . . . . . . . Numeric Functions . . . . . . . . . . . . . . . . . . . . . . . . . . . . . . . . . . . . . . . . . . Calculation Contexts and Extended Syntax . . . . . . . . . . . . . . . . . . . . . Some Popular Formulas . . . . . . . . . . . . . . . . . . . . . . . . . . . . . . . . . . . . . Creating Variables in Desktop Intelligence . . . . . . . . . . . . . . . . . . . . . . . . . . . . Summary . . . . . . . . . . . . . . . . . . . . . . . . . . . . . . . . . . . . . . . . . . . . . . . . . . . . . . . .
550 550 551 557 564 568 569 571 575 577 582 586 588 590
23
Complex Queries . . . . . . . . . . . . . . . . . . . . . . . . . . . . . . . . . . . . . . . . . . . . . . . . . Multipass Queries . . . . . . . . . . . . . . . . . . . . . . . . . . . . . . . . . . . . . . . . . . . . . . . . Multiple Data Providers . . . . . . . . . . . . . . . . . . . . . . . . . . . . . . . . . . . . . . . . . . . Synchronizing Data Providers . . . . . . . . . . . . . . . . . . . . . . . . . . . . . . . . Measure Conditions/Having Clause . . . . . . . . . . . . . . . . . . . . . . . . . . . . . . . . Complex Query Filters . . . . . . . . . . . . . . . . . . . . . . . . . . . . . . . . . . . . . . . . . . . . OR Operand and Nested Conditions . . . . . . . . . . . . . . . . . . . . . . . . . . Combined Queries . . . . . . . . . . . . . . . . . . . . . . . . . . . . . . . . . . . . . . . . . . Subqueries . . . . . . . . . . . . . . . . . . . . . . . . . . . . . . . . . . . . . . . . . . . . . . . . . . . . . . . Creating a Subquery . . . . . . . . . . . . . . . . . . . . . . . . . . . . . . . . . . . . . . . . . Object Equal to Another Object . . . . . . . . . . . . . . . . . . . . . . . . . . . . . . . . . . . . . Summary . . . . . . . . . . . . . . . . . . . . . . . . . . . . . . . . . . . . . . . . . . . . . . . . . . . . . . . .
591 591 594 595 599 599 600 603 606 606 609 610
24
Desktop Intelligence . . . . . . . . . . . . . . . . . . . . . . . . . . . . . . . . . . . . . . . . . . . . . . Why Desktop Intelligence . . . . . . . . . . . . . . . . . . . . . . . . . . . . . . . . . . . . . . . . . . Online Mode vs. Offline Mode . . . . . . . . . . . . . . . . . . . . . . . . . . . . . . . . . . . . . . Types of Data Providers . . . . . . . . . . . . . . . . . . . . . . . . . . . . . . . . . . . . . . . . . . . Combining Personal Data Files with Corporate Data . . . . . . . . . . . . . Synchronizing Data Providers . . . . . . . . . . . . . . . . . . . . . . . . . . . . . . . . Complex Queries . . . . . . . . . . . . . . . . . . . . . . . . . . . . . . . . . . . . . . . . . . . . . . . . . Query on Query . . . . . . . . . . . . . . . . . . . . . . . . . . . . . . . . . . . . . . . . . . . . User-Defined Objects . . . . . . . . . . . . . . . . . . . . . . . . . . . . . . . . . . . . . . . . . . . . . . Advanced Formatting Capabilities . . . . . . . . . . . . . . . . . . . . . . . . . . . . . . . . . . Hiding a Table . . . . . . . . . . . . . . . . . . . . . . . . . . . . . . . . . . . . . . . . . . . . . . Templates and Standard Report Styles . . . . . . . . . . . . . . . . . . . . . . . . . User-Defined Hierarchies . . . . . . . . . . . . . . . . . . . . . . . . . . . . . . . . . . . . User-Defined Groups . . . . . . . . . . . . . . . . . . . . . . . . . . . . . . . . . . . . . . . . Publishing to the Repository . . . . . . . . . . . . . . . . . . . . . . . . . . . . . . . . . . . . . . . Summary . . . . . . . . . . . . . . . . . . . . . . . . . . . . . . . . . . . . . . . . . . . . . . . . . . . . . . . .
611 611 612 615 617 618 620 620 624 624 625 627 631 632 634 636
Bibliography
.....................................................
637
...........................................................
639
Index
Foreword
B
usiness Objects launched the modern business intelligence (BI) industry 16 years ago with a simple but profound idea: a “semantic layer” that would make it easy for nontechnical business users to access data from various databases and applications and create reports from their business systems without requiring programming help from the IT or IS department. In the years since, BI has evolved far beyond this modest goal into a comprehensive set of technologies that are, organization by organization, changing the way the world does business. BusinessObjects XI Release 2 is the latest BI platform from Business Objects and represents a major evolutionary step in the BI industry. It brings together all the tools a company needs, from enterprise information management (EIM) to analytics, to create a complete platform for business success. BusinessObjects XI makes it easier for more people throughout an organization to glean deep insight into the business, discover one version of the truth, and make better decisions. Cindi Howson is a highly respected consultant in the BI industry and an experienced writer of BI books. In BusinessObjects XI: The Complete Reference, she has created the ultimate BusinessObjects XI reference guide. It deserves an initial careful reading and then a permanent place within easy reach. BusinessObjects XI: The Complete Reference lays the groundwork for starting any BI initiative, presenting the key strategies and implementation considerations. It also offers excellent information on key concepts and features, and can save you time in planning your projects and help you navigate through a maze of choices. BusinessObjects XI: The Complete Reference is valuable for organizations of all shapes and sizes in both the public and private sectors, including large organizations, departments within large organizations, as well as small and medium-sized businesses. BusinessObjects XI: The Complete Reference also provides a look at the power of BusinessObjects XI to deliver ongoing business value far beyond any initial implementation. As Howson writes, “A business intelligence implementation is a project that you will never finish and is one in which the best you can do is to provide a starting point for users to make more informed decisions and discover opportunities.” In fact, BI is a never-ending process of discovering new ways to use BI and implementing solutions that lead to even more ways to use it. In all, more than 37,000 organizations and millions of individuals use solutions from Business Objects for this ongoing—and endlessly rewarding—journey, and many now recognize that BusinessObjects XI is the perfect vehicle for finding greater business value around every corner. One Business Objects customer, Emergency Medical Associates, a physician’s group that contracts to staff hospital emergency departments, first bought solutions from Business Objects for reporting on its operational systems. Once the BI system was deployed, however, the BI team recognized they could use BI to create a fully functional system-wide bio-surveillance system. Most recently they have implemented dashboards for performance management, and they believe they are just getting started. Companies that use BusinessObjects are some of the most innovative organizations in business today. Beyond the many features covered in BusinessObjects XI: The Complete Reference, BusinessObjects XI offers organizations substantial strategic benefits. It was developed with a focus on simplicity and enables organizations to offer business intelligence functionality
xvii Copyright © 2006 by The McGraw-Hill Companies. Click here for terms of use.
xviii
BusinessObjects XI: The Complete Reference
to all types of users throughout the organization. BusinessObjects XI is also a robust BI platform that enables standardization on a single BI system and encourages continuing customer innovation beyond reporting or query and analysis. Simplicity has always been a core design principle at Business Objects, and recently greater usability has become a driving force in the development of our products. BusinessObjects XI breaks new ground in this area, making it easier than ever to provide access to business intelligence throughout an organization. For example, new interface innovations, such as Intelligent Question, make it easy for even nontechnical business users to query data and get the vital business information they need when they need it. We also architected BusinessObjects XI to be the most complete BI platform with solutions for the entire BI lifecycle, from data integration and data quality to performance management and forecasting. It offers customers the ability to standardize on a single platform from a single vendor. With standardization, you have the opportunity to reap huge benefits that include much lower software licensing and hardware costs, far greater integration across all systems for greater accuracy and more confidence in a single version of the truth, and significantly less risk when it comes to regulatory compliance. By standardizing on one vendor, you also have one support path and a shorter learning curve, leading to higher productivity and faster time to benefit. Finally, BusinessObjects XI allows you to deploy a business intelligence environment that can be forever expanded and molded to foster continued innovation. As you implement your first project with reporting and drill-downs, then move on to another project that adds complex queries across multiple data sources, BusinessObjects XI: The Complete Reference will provide the concepts, strategies, and details you need to be successful. You can then take off on your own and explore even more sophisticated initiatives, using analytics for forecasting, or creating dashboards and scorecards for performance management. While BusinessObjects XI is the most complete and powerful BI suite on the market today, we at Business Objects know our task is far from finished. Howson’s comment that a BI project is never finished is based on the fact that our customers’ requirements continue to evolve very quickly, so our product must as well, with continual enhancements and innovations. With the wealth of information that exists outside the corporation, we see a different paradigm for accessing information. It is a Global Network of Business Intelligence that allows us to query data across multiple sources no matter where they exist on the Internet. We will also be delivering advanced solutions related to searching through unstructured data, processing both persistent and nonpersistent data, and managing the billions of bits of data that will be collected by RFID technologies. Our customers are pushing for these innovations, and we are right there with them. No doubt countless other innovations will be inspired by the latest technological advances. The years ahead will be exciting ones for anyone creating or using business intelligence systems, and in the same way that Business Objects pioneered the industry 16 years ago, we intend to continue to shape its future and provide our customers with solutions that make them smarter, more productive, and more competitive. As you turn the pages of this excellent reference guide, recognize that you are just beginning your journey through all the possible ways that Business Objects can change every aspect of the way you do business. Fortunately, Cindi Howson takes you on this journey one step at a time, so sit back, relax, and enjoy the ride. Bernard Liautaud Founder, Chairman of the Board, and Chief Strategy Officer Business Objects
Acknowledgments
F
irst and foremost, I must thank the readers of the first BusinessObjects: The Complete Reference. If you hadn’t helped to make the first book successful, the publisher and I would not have embarked on this second edition. Your e-mails, questions, kind words, constructive criticisms, and suggestions have helped shape this edition. Thank you to the McGraw-Hill publishing team for pulling everything together. When I see everything that goes on behind the scenes in bringing a book to a reader, I am sometimes astounded that this book was completed at all. Thank you to Lisa McClain who pushed hard for a second edition, despite my declarations that I could never survive another such endeavor. Thank you to copy editor Bob Campbell for ensuring all those product names were right and for teaching me multiple times how to spell dialog. Thank you to Carolyn Welch for moving the product along in editorial and production, and to Jody McKenzie for making it all look nice in print. Thank you Alex for keeping track of all the moving parts. Thank you to the power house of an analyst relations team at Business Objects—Rebecca Adams, Danielle Guinebertière, and Tracy Eiler—who supported me through this process by ensuring I had access to multiple software versions and channeling dozens of nit-picky, sometimes obscure questions to product marketing and management. Thank you to those who provided the answers: Paul Ross, Darren Cunningham, James Thomas, Howard Jung, Steve, and others. Thank you to the demo team, particularly John Kreisa and Alexis Guinebertière, who urgently provided new keys and beta software that allowed this book to be brought to market sooner. Thank you to Bernard Liautaud for writing the Foreword at the 11th hour, and, of course, for creating a successful company and product that I have been fortunate to work with. With so many sweeping changes in this software release, both the publisher and I thought that using a technical editor internal to Business Objects might give us a leg up on software changes. I thank David Taylor and Richard Foster for taking on such a difficult and thankless task, and John Care for recommending them. David, in particular, thank you for continuing to argue with me and quadruple test aspects that we disagreed on. Thank you to Elizabeth Newbould at Dataspace, technical editor extraordinaire for the first edition, who came to my rescue in writing Chapter 22. I would be lost without my colleagues and business partners who make working in this space simply more fun: Wayne Eckerson, Mark Myers, Knute Holum, and Al Hughes. Thank you to Nigel Pendse for his wit and contribution to Chapter 2. Thank you to my clients who keep me grounded in reality and who give meaning to all this work. I am grateful when customers willingly share their insights, in particular Chris Sieverts, Jonathan Rothman, Paul Zanis, and Tom Nather. As with any book, much of it is written at crazy times, and I once again thank my family for their unwavering support, personal sacrifices, and for always believing in me. Keith, I promise, I won’t start on another book, oh, for at least six weeks J, as long as SOFFC wins the cup again! Megan, ready for that butterfly race? And Sam, let’s go throw that football (better yet, you throw it, I’ll just cheer). Teresa, are you still free for lunch?
xix Copyright © 2006 by The McGraw-Hill Companies. Click here for terms of use.
This page intentionally left blank
Introduction
E
arly in this project, the publisher and I thought this book would be based on BusinessObjects XI Release 1. When the vendor accelerated the timeline for XI Release 2, we decided to rewrite the book for this version, initially using a beta version of the software and then revising against the production version of XI Release 2. Software Modules Covered Business Objects’ product line is ever expanding, and herein lies a dilemma with the publishing industry: The Complete Reference brand does not imply the complete XI product line. Although I would have been glad if this book were published under a different title (lest you think it covers every module within XI), the reality is that you then would not be able to find the book via major booksellers. To manage expectations, please be aware that the following modules are not covered in-depth in this book: building reports with Crystal Reports (there are numerous other books that cover this topic), Data Integrator, Dashboard Manager, Performance Manager, Planning, and Live Office. As many of you have made excellent suggestions to cover some of these modules, lack of coverage simply became a matter of scope and time. Sample Data For the first edition of this book, I tried to make your learning experience more exciting by using BusinessObjects 5i to provide interesting insights about wine prices and ratings (New Zealand Sauvignon Blancs are your best buy!). Because there were so many changes in the product with XI Release 2, I have relied mainly on the familiar, vendorsupplied eFashion and Island Resorts Marketing universes for the current edition of this book. Both use Microsoft Access databases and are part of the standard installation routine. The eFashion universe is based on fictional data from a retail-clothing store. It contains three years of sales and promotion costs for 211 fashion products and 13 stores. The Island Resorts Marketing universe contains reservation and sales information by customer and resort. When I wanted to demonstrate specific Oracle RDBMS or Microsoft SQL Server capabilities, I used sample data installed as part of these RDBMS. For Oracle, I used 9i and predominantly the Sales History (SH) tables. For SQL Server, I used SQL Server 2000 and the Northwind Products database.
What’s Inside Part I, “Getting Ready for BusinessObjects XI,” introduces Business Objects (the company), the history of business intelligence, and key aspects of the product line. Project managers in particular will find Part I useful in understanding the people and communication issues that affect a business intelligence implementation. With the myriad product choices and deployment approaches, Part I will help you stay focused on the users and business values of your implementation. For existing customers, Chapter 5 is an essential read in understanding changes in the architecture and planning your migration. Part II, “A Better Universe,” covers universe design, maintenance, and securing content through the Central Management Console. As you deploy BusinessObjects XI across the enterprise, there are choices about where to build the intelligence in relational tables, OLAP
xxi Copyright © 2006 by The McGraw-Hill Companies. Click here for terms of use.
xxii
BusinessObjects XI: The Complete Reference
databases, the universe, and the reports. As well, the larger your company’s deployment, the greater the need for test and production environments, a quality assurance process, and usage monitoring. Part II explains the tools to do this. Even if you are an end-user, you will want to skim Part II to better drive your business requirements into the universe design. Part III, “Reporting and Analysis,” covers the end-user tools: InfoView portal, Web Intelligence in depth, and advanced features of Desktop Intelligence. Part III is when you finally get the return on your business intelligence investment as users explore and analyze data in ways never before possible. Part III covers the basics of accessing standard reports and exploring the data, as well as the advanced techniques of creating queries, formatting documents, defining powerful report formulas, and leveraging advanced features.
Conventions This book uses the following conventions: Convention
Used For
Bold
Information you enter in a dialog box
SMALL CAPS
Keys such as DELETE or BACKSPACE
Courier font
SQL syntax, Designer and Web Intelligence formula functions, or data source table and column names
Italics
Classes and object names as well as input variables
Business Objects
The company
BusinessObjects
The full client product
BusinessObjects XI
The platform and suite of products
I
PART
Getting Ready for BusinessObjects XI
CHAPTER 1 Introduction to Business Intelligence CHAPTER 2 Goals of Deploying BusinessObjects XI CHAPTER 3 Understanding Your Users CHAPTER 4 Marketing BusinessObjects XI CHAPTER 5 Under the Covers: Migrating to a New Architecture
Copyright © 2006 by The McGraw-Hill Companies. Click here for terms of use.
This page intentionally left blank
1
CHAPTER
Introduction to Business Intelligence “Study the past if you would divine the future”—Confucius
B
usiness intelligence is a way of exploring data to improve business performance, whether to drive profitability or to manage costs. It is not a technology you implement and then put in maintenance mode; it is an approach that evolves, morphs, and starts over again as the business climate changes, the users discover new opportunities to leverage information, and technology changes. When you implement business intelligence tools, the focus of the project is not to finish, but rather to deliver a certain amount of value and functionality within a predefined period. Never has this been more true than now with BusinessObjects XI, as a broader set of functionality, serving diverse user needs, has been brought onto a common platform. As you implement XI, you will need to prioritize which applications and interfaces you will leverage most. Will your project be bottom up: sort out the infrastructure to lower BI costs? Or top down: deliver scorecards to align and measure business performance? Much of your implementation approach will depend upon where you are on the business intelligence lifecycle and whether or not you are completely new to BusinessObjects XI, a long-time Business Objects customer, or a long-time Crystal customer. The purpose of this chapter is to provide some insight as to how business intelligence evolved and is still evolving, so that you can assess where your company is in the BI lifecycle, where your users are today, and where they are heading. You’ll see how Business Objects, the company and the product, have evolved with their customers and the industry, bringing the dream of business intelligence to more users and beyond traditional corporate boundaries. In many cases, Business Object’s innovations have shaped and redefined the market.
The Background of Business Intelligence The need to access information is not new. After all, people have always needed data to make informed decisions, although a number of errors in decision-making processes are still prevalent, including gut feel. As a type of technology, though, business intelligence is relatively young and emerged as a distinct market in the early 1990s. Pre–business intelligence, it was expensive and time-consuming to get access to the right data. If you
3 Copyright © 2006 by The McGraw-Hill Companies. Click here for terms of use.
4
Part I:
Getting Ready for BusinessObjects XI
are just starting out on the journey of business intelligence, you may find it hard to believe there was a time when information access was more painful than it is today. There are signs that BI has not quite delivered everything we hoped it would. For example, according to a TDWI survey, less than 20 percent of company employees use a BI tool on a regular basis. As BI technology evolves, and with a number of innovations in BusinessObjects XI, I expect this BI penetration to improve dramatically in the next few years. Customers are equally optimistic, expecting the percentage of active BI users to increase to 40 percent in the next three years. Prior to business intelligence, decision-makers predominantly relied on the following sources of information: • Printed reports, generated on a periodic basis by mainframe-based systems. If a critical measure were missing from the printed report, you had to wait months for IT to create a custom report. • Manually populated spreadsheets, which provided a bit more flexibility than printed reports. Unlike today, when users may export data from a report, or better yet, use BusinessObjects Live Office to dynamically import data into a spreadsheet, in the late 1980s, field personnel would call in their sales figures to an analyst, who would manually enter data into a spreadsheet. This allowed for some form of analysis on monthly data at best. With manual data entry, there was enormous room for human error and a higher degree of data discrepancies, as rarely did the manually populated spreadsheet match the source system. • Gut feel still provided the best form of decision-making, as managers were close to the markets and the customers, and markets did not change at the pace they do today. If a manager had access to quantitative numbers, there was a high degree of distrust of the numbers, and rightly so. After all, the data was stale and the manual collection processes fallible.
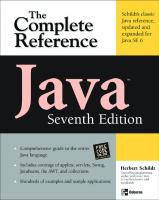
C AUTION As you deploy BusinessObjects XI, never underestimate the role and “hold” these legacy reporting systems continue to have over users. If you make BusinessObjects XI appear any more difficult than legacy reporting systems, your project risks failure. You are trying to change in a matter of months decision-making processes that have existed for decades. Custom-developed decision support systems (DSSs) and executive information systems (EISs) attempted to overcome some of the limitations of these original information sources. Decision support systems took the data from mainframe-based transaction systems and presented the results to users in a parameterized form. Users would enter a couple of parameters, such as time period, customer, country, and product. The DSS then displayed results in a tabular format. The beauty of this was that it was easy to use, significantly more so than wading through pages of paper-based reports. If you wanted to graph something, however, you had to re-key the data into a spreadsheet. If you wanted to view a different data subject, this was generally not possible. Decision support systems generally provided insight into only one subject of data at a time. Each function generally had its own custom transaction system (see Figure 1-1), making it almost impossible to share information across functions. When a customer placed an order, the order entry system maintained its own customer codes. To generate an invoice, the accounts
Chapter 1:
Introduction to Business Intelligence
FIGURE 1-1 Each function had its own custom-built transaction system and corresponding DSS.
PART I
receivable department would have to reenter the order into its own accounting system, which most likely used a different set of customer codes. If you wanted to combine actual sales data (accounts receivable) with shipment dates (orders), it was generally not possible. Early decision support systems with their proprietary nature gave way to executive information systems (EISs) in the late 1980s. Executive information systems were expensive to implement but provided graphical dashboards based on a broader set of information, sometimes with feeds from external data sources. At the time, products such as Lightship by Pilot Software, Inc., Forest and Trees by Platinum Technology, and Commander Decision by Comshare, Incs, were breakthrough applications and in high demand. The fundamental problem with EIS systems was that E stood for executive. Companies soon realized that not only executives but all decision-makers needed access to information. Some savvy marketing companies later would tout their products as everyone’s information system. However, until organizations fixed the back-end data, the stale, silo-based information could not be actionable, regardless of how pretty it looked in a dashboard or a briefing book. At the time, data warehousing was not a generally accepted technology, so moving beyond silo-based information systems was mission impossible. What surprises me is that even today, the most often cited barrier to a successful enterprise BI deployment is lack of an integrated data architecture. Fail to address the back-end systems, and your BusinessObjects XI implementation will fail. Potentially, the latest approaches to dashboards (and other innovations) make the concept of everyone’s information system a greater reality. I find Business Objects’ recent advertising campaign both appropriate and amusing, since it highlights some of the historical mistakes in the BI industry. One ad shows a warehouse employee with a tag line “Meet the CEO of shocks and spokes.” The ad emphasizes that BI belongs in the hands of every employee in an organization, not just in the hands of a few executives.
5
6
Part I:
Getting Ready for BusinessObjects XI
Business Intelligence Is Born In the early 1990s, a number of business and technological factors merged to drive and enable the creation of a new breed of tools, business intelligence, as shown in Figure 1-2. Several factors drove the need for more information, faster. With the fall of the Berlin wall, the signing of NAFTA, the endless possibility of emerging markets, and economic prosperity, growth and globalization were the mantra for many organizations. However, to operate a global company, companies need access to global or multiregional data. The function- and region-based DSSs could no longer satisfy users’ needs. Silo-based EISs broke. At the same time, PCs were becoming common office tools. Users were increasingly analyzing data via spreadsheets or PC-based graphics programs. With this limited data analysis, users put pressure on IT to deliver more robust reports. IT could not keep pace with the demand. Personal computing both drove business intelligence and enabled client/server computing. A number of technological advances became enablers for business intelligence. First, large corporations began implementing enterprise resource planning (ERP) systems, such as SAP, PeopleSoft, and Oracle Financials. With these implementations, companies hoped to: (1) reduce the number and complexity of custom transaction systems, (2) meet the business demands for growth and globalization, and (3) derive the productivity and cost benefits of business process reengineering. With ERP systems (Figure 1-3), companies implement modules that share common business data. Each module includes rules that ensure a company is following its intended business processes. For example, in generating
FIGURE 1-2 The business intelligence explosion
Chapter 1:
Introduction to Business Intelligence
FIGURE 1-3
ERP systems ensure data integration and adherence to standard processes.
PART I
a customer order, the shipment is not scheduled until a price has been agreed upon and inventory is available. Modules share information with one another. The same customer information used to process the order is used to invoice the customer. When a customer places the order and the product is shipped, this information is integrated with the accounts receivable module to generate an invoice. With the proprietary transaction systems shown in Figure 1-1, data was double-entered, and customer IDs were specific to each system. With an integrated ERP system, an accountant no longer re-keys the information into a separate system; all reference data is shared across the multiple modules. (See Figure 1-3.) If the productivity and business process reengineering savings were not enough to incite a company to replace their legacy systems with an ERP, then the threats of year 2000 issues were. Initially, ERP vendors promised they would provide insight into a company’s business. It was a false promise. ERP systems provide the infrastructure that makes the insight possible,
7
8
Part I:
Getting Ready for BusinessObjects XI
but the insight comes only when business intelligence tools and a data architecture are implemented in conjunction with the ERP system. System integrators and consultants, eager to assist with ERP implementations, only fueled this misconception. Some companies recognized that the newly implemented ERP system would not be able to replace all the information requirements that custom reports and DSS systems provided. Although ERPs helped streamline operations and eliminate duplicate data entry, they did nothing to simplify data access. The second key enabler to business intelligence was client/server computing. With PCs on many users’ desktops, companies could shift much of the processing power from mainframes to PCs, at a significantly lower cost. All of the sexy charts that made EISs so appealing could easily be rendered on an MS Windows or Apple desktop. The user interface was much more intuitive than mainframe-based reports and programming languages. For the first time, companies could purchase best-of-breed products and the components worked together. Okay, so they needed some brute force and perhaps some aggressive vendor sessions, but they did work, a shock for many who previously had single-vendor solutions. While client/server computing placed greater demands on BI, the Web has brought BI to even more users. In some respects, the client/server computing that was once a catalyst for BI can now be an obstacle (that and a general resistance to change). With client/server computing, BI software and database connectivity had to be installed on every user’s desktop. With the Web, BI users only need access to a browser. Customers have been rethinking their corporate intranets and BI infrastructure to better leverage the Web. In some circumstances, the Web has both expedited and hindered broader BI adoption. Because many Crystal Report consumers required little report-based interactivity, the Web became the perfect delivery vehicle for those reports. Meanwhile, the huge installed base of BusinessObjects classic users has slowed the adoption of Web Intelligence. Also, prior to XI Release 2, there was significantly more functionality in the BusinessObjects desktop interface than in Web Intelligence. Despite some strong selling points of the Web-based interface, few BusinessObjects classic report users were willing to give up the familiarity and robustness of the desktop tool.
Data Warehouse Speeds BI Adoption The data warehouse was the biggest enabler for powerful reporting and BI’s initial wave of success. A data warehouse extracts information from the ERP and aggregates it to allow for fast analysis of vast amounts of data. Some initial data warehouse projects were deemed failures, costing millions of dollars and producing no measurable benefits after years of effort. Fortunately, industry consultants quickly remedied the data warehouse approach, proposing subject-oriented data marts that can be built in smaller time frames. Ideally, a central data warehouse still acts as the platform to populate the data marts. As a technology, data marts and data warehousing allow IT to safely isolate the transaction system from the reporting system. A slow query does not halt order processing. As a business application, data warehousing allows users to analyze broader sets of data with dimensional hierarchies. When analyzing data in either an ERP or a proprietary transaction system, the queries are still limited to a particular module or set of tables. I suspect that one reason that BusinessObjects is so widely deployed without a data warehouse is that it provides unique capabilities to
Chapter 1:
Introduction to Business Intelligence
The Internet Influence With the Internet boom of the late 1990s, the Web has had a dramatic impact on BI. A large deployment in a client/server deployment may have been in the thousands; in a Web deployment, it’s tens of thousands. What once was viewed as a departmental application is now considered an enterprise resource. In some cases, the corporate intranet is no longer the deployment boundary, as customers and suppliers can also access rich BI content from a browser. ERP/Transaction System
Data Warehouse / Data Mart
Goal is to process orders, post journal entries
Goal is to provide access to information to improve revenues, manage costs, improve customer service, achieve strategic goals
Current information with very little history
Larger amounts of history allow multiyear trend analysis, this year versus last year comparisons
Real-time information
Information extracted on a periodic basis (hourly, daily, weekly, and so on)
Detailed data down to the line item or level of data entry
Aggregated data but increasingly granular
Fast inputs, but slow queries
Read-only; tuned for fast queries
Normalized tables in thousands
Denormalized star or snowflake schemas with fewer tables
Rarely hierarchical groupings
Hierarchical groups give level of time, chart of accounts, product groupings, customer groups, and so on
Fixed reports by one detailed dimension (cost center, plant, order number)
Fixed or ad hoc reporting and analysis by multiple dimensions across all business functions
TABLE 1-1 Comparison of Transaction Systems with Data Warehouses
PART I
report authors to circumvent these constraints. With BusinessObjects, report authors can query multiple subject areas and stitch the results together seamlessly, locally. Synchronized multiple data providers is probably the single most anticipated feature in Web Intelligence XI Release 2. With a data warehouse, the data is combined into one subject area or business view, allowing users to perform analyses that cut across multiple business processes. This approach puts significantly less strain on the BI application and is more scalable than attempting to put so much logic within one report. As the data is aggregated, data warehouses can contain years of history, allowing users to analyze trends; ERP and transaction systems often contain only current data at the most granular level of detail preventing any kind of trend analysis. Table 1-1 compares some of the different purposes and features of a transaction system with those of a data warehouse.
9
10
Part I:
Getting Ready for BusinessObjects XI
To leverage the Web, many BI vendors have re-architected their products. The industry still hotly debates Web delivery and authoring approaches. A browser interface is not always as intuitive as a Windows environment and lacks the maturity and consistent design of Windows-based applications. For this reason, Business Objects is continuing to provide a desktop authoring tool, Crystal Reports, for high-fidelity production-style reports, developed by professional report authors. Web Intelligence, meanwhile, is a purely Webbased authoring tool, ideally for business users who may not need all the advanced design tools that an IT developer requires. Yet to provide a certain amount of intuitiveness, Web Intelligence has two interfaces: an applet that has a richer design experience and a zerofootprint HTML version that is more wizard-like for basic reports. Desktop Intelligence, formerly called BusinessObjects classic, allows long-time customers to preserve their report development investments while offering a migration strategy. The user interface is only one aspect of a Web-based BI deployment that the industry and customers alike need to rethink. The other is clearly the architecture. BusinessObjects XI Release 1 (released December 2004) certainly was about integrating the Crystal and BusinessObjects product lines, but it was also about providing a scalable architecture for Web-based BI. As deployments grow increasingly larger, with 24 by 7 access, and no downtime, the architecture must be more fault-tolerant and use shared services (discussed more in Chapter 5).
A Broader BI Suite Since its inception, the BI market has been highly fragmented. In the last couple of years, many vendors, including Business Objects, have offered innovations or acquisitions to span multiple BI market segments. While customers may be willing to integrate a database from one vendor with a query tool from a different vendor, they may not be willing to do the same for, say, a dashboard tool and query tool. Customers have moved from departmental, à la carte purchases of multiple BI components to centralized purchases of tightly integrated suites. The degree to which you must understand individual BI market segments is dependent upon the stage of your implementation and your company’s philosophy of seeking best-ofbreed solutions versus an integrated solution. It’s also important to understand the vendor’s partnership strategy for those segments in which Business Objects is less of a market leader. The sections that follow describe some of the main BI market segments. Figure 1-4 shows how some of the market segments relate to components of a BusinessObjects XI architecture.
Data Integration Data integration or extract, transform, and load (ETL) tools used to be distinct from the BI suite, and with some vendors, they still are. Their job is to take the data from the source ERP or transaction system and then to cleanse and aggregate it to load in a data warehouse or data mart. Simply getting the data into an OLAP database or RDBMS does not in itself provide business value. As business users attempt to answer questions with the data, the ETL process often changes to extract more data, clean the data, or transform it to add robust business calculations.
Chapter 1: Introduction to Business Intelligence
FIGURE 1-4 Components of a BusinessObjects XI deployment
11
PART I
12
Part I:
Getting Ready for BusinessObjects XI
In 2002, Business Objects acquired Acta Technology, a leading ETL vendor, and rebranded the product as BusinessObjects Data Integrator. The company increasingly views data quality and integrity as key to the success of any BI or EPM deployment and a component of its Enterprise Information Management (EIM) strategy. With any BI implementation, much of the success rests with the information architecture. Provide users with bad data, and the BI tool that is the window to this bad data will take the blame; provide users with good data, and the BI tool will enjoy the credit. In the company’s official product line diagram, EIM is central (see Figure 1-5). To this end, the company continues to enhance Data Integrator, acquiring EII vendor Medience (Q4 2005) as a way of providing access to distributed data sources in real time, and launched Data Federator in Q2 2006. In April 2006, Business Objects acquired privately held Firstlogic as a way of improving data quality. As of 2004, sales from Data Integrator accounted for less than 5 percent of Business Objects’ total license revenues, but this increased to roughly 10 percent in 2005. Data Integrator is one of the company’s fastest growing segments, with sales increasing 51 percent year-over-year. As an ETL solution, Data Integrator continues to compete with pure-play ETL vendors such as Informatica as well as ETL solutions from RDBMS vendors such as Oracle Warehouse Builder or Microsoft Integration Services (formerly DTS). It’s perfectly reasonable to use a third-party ETL solution as part of your BusinessObjects XI deployment. However, because Business Objects also owns not just the ETL piece of the BI architecture shown in Figure 1-4
FIGURE 1-5 BusinessObjects XI product line diagram. Reproduced with permission of Business Objects.
Chapter 1:
Introduction to Business Intelligence
Query and Reporting Query and reporting is the process of querying a database and then formatting it for readability and analysis. This is the segment in which BusinessObjects initially was launched in the early 1990s, and its origins help explain why its SQL generation is so robust. Over the years, the prevalence of query and reporting tools has led this market segment to become synonymous with business intelligence, even though business intelligence encompasses so much more. With query and reporting, users may query a data mart or a data warehouse, or they may query a transaction system. Some define “reporting” as the process of formatting a report to enable analysis, while others define reporting as the delivery and distribution of standard reports throughout an organization. In 2003, Business Objects acquired Crystal Decisions, traditionally considered an enterprise reporting vendor. Hmmm, but wasn’t BusinessObjects used for reporting as well? Yes, and herein lies a potential source of confusion that you must manage as part of your deployment. For sake of clarity, I’ll refer to Crystal Reports as a “production” reporting tool and Web Intelligence as a “management” reporting tool. But don’t pigeonhole these tools as reserved for certain users or data sources. As I’ll explain next, while there are some clear differentiators between the two, there also is potential for overlap. The needs within production reporting are often different than the needs within management reporting. Yet sometimes, the needs blur and the lines cross—and just as you can use a hammer to get a screw into the wall, you can use a production reporting tool for management reporting. The converse, however, is not true: rarely can you use a management-style query and reporting tool to develop production-style reports. The tool may not support the pixel-perfect layouts, normalized data sources, or programmability that IT developers demand. With management-style query and reporting, the source is more often a data warehouse (though not always). Whereas IT develops production reports, power users and casual business users develop their own reports. The following table compares some additional characteristics that help distinguish production-style reports from management-style reports. These characteristics are by no means absolutes. Neither of these segments is precise. For example, Web Intelligence reports can be used individually, departmentally, or enterprise-wide. Crystal Reports would rarely be developed for an individual user and are more often enterprise-wide. Similarly, bursting a report and pushing it to numerous recipients is often considered a strong point of Crystal Reports, yet this is also possible with Web Intelligence reports (although it requires different processes and server resources).
PART I
but also the front-end pieces, the vendor has extended the ETL integration to the business users. In this regard, while viewing any report, a business user can see the data lineage, transformations, and business descriptions. This information is taken directly from Data Integrator and populated into the universe. This integration allows for a broader type of impact analysis. When the source information changes, an administrator can identify which data warehouse table columns, which universes, and ultimately which business reports are affected. In cases in which Crystal Report instances have been used for maintaining historical data, Data Integrator can access these report instances to populate a data warehouse.
13
14
Part I:
Getting Ready for BusinessObjects XI
Characteristic
Production
Management
User interface
Crystal Reports
Web Intelligence
Primary author
IT developer
Power user or business user
Purpose
Complete an operational task, fulfill regulatory reporting requirement
Decision-making and analysis
Report delivery
Portal, paper, or e-bill, embedded in application
Portal, e-mail
Report bursting
Burst to thousands
Schedule individually
Print quality
Pixel-perfect
Presentation quality
Number of report authors
Few
100s or 1000s
Number of report consumers
10s of 1000s
100s or 1000s
Predominant data source
OLTP—real time
Data warehouse or mart, occasionally OLTP
Level of data detail
Granular
Aggregated
Scope
Operational
Tactical, strategic
Usage
Fixed reports
Fixed or interactive reports, ad hoc queries
(Source: BIScorecard.com)
Production-style query and reporting is the process of querying an OLTP database and then formatting it to create a document, perhaps an invoice, a bank statement, a check, a list of open orders, or a fixed report consumed by thousands of users. In creating these reports, developers often require dynamic and programmatic control over the layout. These are some reasons that Crystal Reports is embedded in so many applications, with native connectivity to dozens of data sources. When the reporting is not against the transaction system, it may be against an operational data store or detailed data within a data warehouse. An invoice looks the same month to month; users have little desire to tailor its appearance (unlike a management report). This is Crystal Reports’ sweet spot. Management-style query and reporting is intended for users who want to author their own reports. They are less concerned with the precise layout (since they aren’t trying to generate an invoice) but do want charts and tables quickly and intuitively. This is Web Intelligence’s sweet spot. Most organizations have the need for both types of tools, although in smaller organizations, you may choose one or the other.
Analysis BusinessObjects XI provides query, reporting, and analysis in one interface, Web Intelligence, that generates a dynamic microcube based on the query results. Online Analytical Processing
Chapter 1:
Introduction to Business Intelligence
NOTE DOLAP used to be an acronym for Desktop OLAP because the processing initially occurred on the desktop. However, Dynamic OLAP is a more appropriate acronym, as the processing can occur in either a desktop environment or a mid-tier application server, but in either case, the cache is built dynamically without any explicit user or administrative tasks. These approaches differ in where the aggregations, calculations, and processing are performed. The following table compares some of the vendors and their different approaches to OLAP: Architecture
Primary Difference
Vendor
ROLAP
Calculations done in a relational database.
IBM DB2 Cube Views, SAP/BW, and Microsoft Analysis Services can also act as ROLAP but most often use MOLAP
MOLAP
Calculations performed in a serverbased multidimensional database. Cubes provide write-access for inputting budget data or performing what-if analysis.
Hyperion Essbase, Microsoft Analysis Services
HOLAP
Aggregations in a cache but with seamless drill-through to relational.
Microsoft Analysis Services
DOLAP
Calculations performed on the desktop or Enterprise Server to build a microcube. Cubes are read-only.
Web Intelligence
Given these traditional OLAP architectures, it’s not surprising that many customers are not sure where to classify Web Intelligence or Desktop Intelligence. I often call it a DOLAP solution because the cache is built dynamically, either on the desktop in the case of Desktop Intelligence or on the Enterprise Server in the case of Web Intelligence. However, it is also a ROLAP approach because it provides automatically drill-through to detail, server-based ranking, aggregate navigation, and other capabilities while leveraging the data storage of the RDBMS. The only architecture you can say it is not is MOLAP. You might deploy BusinessObjects XI instead of a MOLAP solution or in addition to a MOLAP solution.
PART I
(OLAP) has historically been a distinct market segment of BI. OLAP databases were often implemented as separate solutions from a query and reporting tool. With OLAP-aware universes (new in XI Release 2), Web Intelligence users can analyze data in OLAP databases such as Hyperion Essbase, Microsoft Analysis Services, IBM DB2 Cube Views, or SAP BW. Crystal Reports can also access OLAP databases natively for richer report design against these data sources. OLAP Intelligence offers users access to OLAP databases as well. In its broadest sense, OLAP provides multidimensional analysis with different dimensions and different levels of detail. Capabilities such as drill-down, rotate, and swap are OLAP features. OLAP, though, has some clear definitions set forth by E.F. Codd (the father of the RDBMS) in 1993. OLAP itself can be further divided into different approaches: relational (ROLAP), multidimensional (MOLAP), hybrid (HOLAP), or dynamic (DOLAP).
15
16
Part I:
Getting Ready for BusinessObjects XI
Analytic Applications Henry Morris of International Data Corporation (IDC) coined the term analytic application. For software to be considered an analytic application, IDC says it must have the following characteristics: • It must function independently of the transaction or source systems. • It must extract, transform, and integrate data from multiple sources and allow for time-based analysis. • It must automate a group of tasks related to optimizing particular business processes. At one point, analytic applications seemed to be the next big wave of BI, and yet many vendors who dove headfirst into the segment later retrenched. Business Objects has always had a much stronger “build” than “buy” mentality. I hesitate to use the term “build,” as it is reminiscent of developing an application from scratch, coding in a programming language. The “build” approach with analytic applications is more appropriately described as “customize,” in which developers and users assemble objects and templates to deliver an application. With Application Foundation (initially released in 1999), Business Objects provided a development platform for companies to build their own analytic applications and management dashboards, specifying their own process rules and best practices. The initial product met with mixed success and was largely constrained by the full-client BusinessObjects. With the release of XI, the company rebranded its analytic applications as Performance Management Applications. This solution has a number of prebuilt applications such as Customer Intelligence, Finance Intelligence, and Supply Chain Intelligence, to name a few, all rewritten leveraging Web Intelligence XI. Analytic Solutions are prepackaged data models built with Data Integrator that are available for retail, CPG, and finance. One of the larger segments of analytic applications involves budgeting, planning, and financial consolidation software. In the past, Business Objects preferred to partner with vendors of such solutions even as part of its Performance Manager product. In August 2005, the company acquired SRC software. SRC uses relational storage for planning data, allowing customers to readily integrate SRC within a BusinessObjects XI deployment. The vendor plans to provide prebuilt planning universes and greater security integration in the future. Business Objects continues to partner with other vendors in this segment, including Geac Computer and Cartesis.
Dashboards and Scorecards The terms dashboard and scorecard are often used interchangeably, although there is a difference. In its simplest terms, a dashboard is a collection of information, similar to a dashboard in your car. It might include • A map that color codes where sales are performing well or poorly • A gauge chart that shows if expenses are over/under budget • A trend line that tracks stock outs
Chapter 1:
Introduction to Business Intelligence
Data Mining Data mining is a particular kind of analysis that discovers patterns in data using specific algorithms such as decision trees, neural networks, clustering, and so on. Data mining is used for predictive analytics and is forward-looking, whereas query and reporting tools
FIGURE 1-6 Strategy map within Performance Manager
PART I
Whereas dashboards present multiple numbers in different ways, a scorecard focuses on a given metric and compares it to a target. In analyzing performance versus the target, a scorecard may provide a strategy map (see Figure 1-6) and track accountability. Scorecard products are often certified by the Balanced Scorecard Collaborative. Business Objects offers Dashboard Manager as a dashboarding solution and Performance Manager as a scorecard solution (not to be confused with Performance Management Applications! J). Across the industry, a dashboard solution can be anything, including a complex document you create in Web Intelligence or Crystal Reports, a customized portal such as My InfoView, or a more robust solution such as Dashboard Manager (see Figure 1-7). Where Dashboard Manager is most different from a complex document is that it has several integrated analytic engines (Segmentation, Metrics, Rules and Alerts, Predictive, and Statistical Process Control) that allow for more sophisticated analysis. It has built-in “analytics” or controls to facilitate visual analysis and interaction with the dashboard. For example, a map analytic allows you to display data geographically. A thermometer analytic allows you to display a metric against a target value.
17
18
Part I:
FIGURE 1-7
Getting Ready for BusinessObjects XI
Dashboard Manager
are more typically used for analyzing historical data. Another difference is that, whereas standard query and reporting tools require you to ask a specific question, data mining does not. For example, an interesting data mining discovery is that beer and diaper sales are closely correlated (one theory: a quick stop to the store to pick up more diapers is a good time to pick up more beer); a standard query tool would force a user to ask a more precise question such as, “What do beer consumers purchase in the same store visit?” With a data mining solution, users only need to say, “Here is some data, now show me what’s related.” Okay, I’m simplifying it. The truth is that building models and interpreting them is a sophisticated task demanding a highly skilled statistician. Business Objects does not compete in the data mining space that is dominated by SAS, SPSS, IBM, Fair Issac, and others. Business Objects does, however, provide OEM data mining capabilities from KXEN as part of its Performance Management, Predictive Analytics module. Models from other data mining packages, such as SAS and IBM, can also be passed via Predictive Markup Modeling Language (PMML) to Performance Management.
Chapter 1:
Introduction to Business Intelligence
19
The History of Business Objects the Company
Product Innovation It’s difficult to say whether XI Release 2 or XI Release 1 is the company’s biggest release to date as they both contain significant innovations. Many observers predicted that XI Release 1 would never happen. The key innovation in XI Release 1 was the integration and re-architecting of the product line to leverage the service-oriented, proven architecture of Crystal Enterprise. This re-architecting allows for open and more fine-grained security, greater scalability, and a broader suite of capabilities on a common platform. In XI Release 2, there are numerous innovations, but the one that will have the biggest impact on long-time customers is support for Desktop Intelligence (or full client documents) within the new platform. As well, Web Intelligence now provides a richness in authoring, analysis, and report consumption that will make it the preferred interface going forward. Customers can optionally convert documents to Web Intelligence (see Chapter 24 for a comparison of capabilities). Figure 1-8 provides a timeline of some of the company’s major product innovations and key acquisitions. • 1990 Patented semantic layer allows users to generate SQL using familiar business terminology. • 1995 BusinessQuery for Excel (now discontinued) allowed users to launch a query directly from a spreadsheet and analyze the results in the spreadsheet. Live Office replaces this product in XI Release 2, supporting content from both Crystal Reports and Web Intelligence. • 1996 BusinessObjects is rearchitected as a 32-bit application and introduces the microcube technology for Dynamic OLAP. • 1997
Web Intelligence thin client is first introduced.
• 2000 InfoView Portal is released, along with BusinessObjects 5i, which offers full-client capabilities in three-tier mode. • 2001 Auditor is launched, allowing administrators to track use of documents, universes, and objects by users and groups. • 2001 Application Foundation and BusinessObjects Analytics are launched, providing companies with prebuilt applications as well as a development
PART I
Bernard Liautaud cofounded Business Objects in France in 1990. In Q3 2005, Liautaud assumed the role of Chief Strategy Officer. John Schwarz, previously President of Symantec, became CEO. Business Objects has dual headquarters in both Paris, France, and San Jose, California. While such a multicultural split in headquarters can create a “not invented here” attitude, Business Objects sees its transnational identity as a competitive advantage in a global marketplace. At one point in BI history, Business Objects might have been viewed as a niche player or underdog. Today, it is considered the industry leader on a number of fronts. Its revenues, once in the millions, reached the one billion dollar mark in 2005. Part of what has helped it reach this mark has been its acquisition of Crystal Decisions, but clearly, the other aspect has been a history of innovation.
20
Part I:
Getting Ready for BusinessObjects XI
FIGURE 1-8 Major product innovations
environment for analytic applications. These products are later rebranded Dashboard Manager and Performance Management Applications. • 2002 Acta is acquired to provide ETL capabilities and packaged data marts, later rebranded as Data Integrator and Rapid Marts. • 2003 Crystal Decisions is acquired for its pixel-perfect reporting solution, enterprise architecture, and huge base of OEM partners and customers. • 2004 BusinessObjects XI Release 1 provides a new architecture that integrates Crystal Enterprise and the classic BusinessObjects suite. The product includes several major enhancements such as collaboration and guided analysis through the Encyclopedia. • 2005 BusinessObjects XI Release 2 closes the parity gap between Web Intelligence and Desktop Intelligence. It includes a new patented interface Intelligent Question to garner more casual users. • 2005 SRC Software is acquired as part of the company’s performance management strategy, providing budgeting, planning, and financial consolidation software. • 2006
FirstLogic is acquired to embed data quality capabilities in Data Integrator.
Chapter 1:
Introduction to Business Intelligence
21
The Future
• SMB and Enterprise Customers While many BI vendors (including Business Objects) continue to pursue enterprise customers and expand the footprints in these accounts, Business Objects further extends its reach to small to medium-sized businesses. In the last year, it has released special versions of Crystal Reports to provide a complete entry-level reporting solution. Also, the release of Crystal Xcelsius gives these customers highly visual, Excel-based dashboards. • Enterprise Information Management As discussed elsewhere in this chapter, lack of a robust data architecture can lead a business intelligence implementation to fail. While other BI vendors have largely left these issues to be addressed by database vendors, Business Objects has made information management a core part of its strategy. • Enterprise Performance Management Business intelligence is about empowering users to access the information they need to do their jobs effectively; enterprise performance management is about ensuring the company focuses on those things that most determine business performance. It provides the tools and processes to enable individual business units to measure progress toward goals that are aligned with strategic objectives of the company as a whole. An effective EPM solution requires an enterprise business intelligence platform and robust data architecture. Beyond these strategies, the momentum of the BI market clearly contributes to Business Objects’ success. Business intelligence spending continues to be cited as the number one or two IT investment for companies in 2006. Product innovations, including the easy interactivity of Web Intelligence, the intuitive power of Dashboard Manager, and the integration of spreadsheet-based BI in Live Office, together extend the reach of BI.
Summary To borrow a phrase from a data warehouse vendor, business intelligence is not a destination but a journey. While this book focuses on the company’s core query and analysis products, Business Objects now offers much more, extending its capabilities into ETL on the back end and analytic applications on the front end. A business intelligence implementation is a project that you will never finish and is one in which the best you can do is to provide a starting point for users to make more informed
PART I
At the time of this writing, Business Objects is considered the leading BI vendor in terms of revenues, product capabilities, and market presence as defined by a number of analyst firms, including IDC, Forrester, and Gartner. Although there has been recent consolidation, the market remains relatively fragmented, and competition is fierce. While nobody can predict the future, it’s relevant to consider some of the vendor’s strategies that will shape future product directions and determine continued success:
22
Part I:
Getting Ready for BusinessObjects XI
decisions and discover opportunities. With so much product capability, you must stay focused on the business value of BusinessObjects XI. Your challenge will be to understand how the history of business intelligence in your company influences your users’ attitudes, understanding, and receptiveness toward BusinessObjects XI. Perhaps you are still fighting some of the battles of just having implemented a new ERP. Perhaps your initial goal is a modest one of simply weaning users from printed reports to online reports. Perhaps your company will be one of the industry innovators which many aspire to be, using BusinessObjects XI in ways never before anticipated and directly contributing to your firm’s market position and profitability. Enjoy the journey!
2
CHAPTER
Goals of Deploying BusinessObjects XI
W
hether you are first implementing BusinessObjects XI or expanding an existing implementation, it’s important to be clear about the goals of your deployment. You may be implementing BusinessObjects XI as part of an IT effort or as part of a specific business initiative. The goals of these two groups can be quite different. The goals may be driven by the following: • IT to reduce infrastructure costs, limit custom report development, or replace a legacy reporting system • A business unit to provide access to data to manage and measure the day-to-day business activities • The corporation as part of a larger enterprise performance management initiative, as a strategic tool that provides competitive advantage The goals of different stakeholders may collide and impede progress or merge to make the implementation more successful. You may start out on the implementation with one set of goals only to discover a more important goal as you proceed. In some cases, good scope management will help the project stay on track. In other cases, recognize that business intelligence is not as exact as other technology projects and requires a degree of flexibility. Capabilities are delivered on an iterative basis rather than a traditional waterfall project lifecycle. Often, you may feel that a BI project never ends, and in fact, it doesn’t and shouldn’t. However, focusing on the goals of the project will help minimize the risk that the technology and latest product innovations become all-consuming (as fun as they may be!) and ensure resources are aligned to deliver value within a defined timeframe.
DILBERT: © Scott Adams/Dist. by United Feature Syndicate, Inc.
23 Copyright © 2006 by The McGraw-Hill Companies. Click here for terms of use.
24
Part I:
Getting Ready for BusinessObjects XI
IT Goals Although BusinessObjects XI provides business insight, it is still a tool purchased primarily by the IT organization as the enabler to information access. IT controls the source systems and the data warehouse. The challenge here is in making sure the IT goals are a starting point and not an end point. For example, let’s assume that your current approach to reports is for a custom programmer to develop them against the source system. Crystal Reports may be the tool of choice for creating such custom reports. The business users are reasonably happy because each report is customized with their view of the data; it’s easy (no training required), and it’s correct because the data came directly from the transaction system/ERP. However, this approach to information access poses several problems: • The report developer generally has to know the detailed ERP/OLTP schema and programming language. • The cost to develop and maintain one report is high. Because the report developer is several steps removed from the business, it may take multiple iterations to get the report right. By the time it is right, however, the user requirements change. • Reporting directly against the OLTP can affect response time both for inputting transactions and for executing a report. • Without a data warehouse, a significant amount of business logic is built into each individual report. Some users, though, are not satisfied, because IT can’t develop custom reports fast enough. IT has become a bottleneck. Your company decides it needs to complement the Crystal Reports deployment with Web Intelligence as an ad hoc query and reporting tool with the primary goal of reducing the time and cost to develop custom reports and ideally providing end users with more flexibility. You enable the Web Intelligence module, build a few universes, and train the users on the tool. Users will now be able to create their own reports, and the IT department can focus on a smaller set of canned, enterprise-wide reports. Goal accomplished? No. First, the skill set to build a BusinessObjects universe is often quite different than the programming skills to develop an ERP-based custom report. The roles of the existing report developers must be redefined, or they will impede implementation (see Chapter 3, under the heading “Influencers”). Is there still a need for custom reports against the ERP? Probably, yes, but ideally for a much smaller number. Second, you just went from a business user’s having access to a fixed report (easy to use) to the user’s starting at a blank query panel with no data. Part of such a deployment effort must include an evaluation of which reports should remain as fixed reports, which should be eliminated, and which should be re-developed as standard Web Intelligence reports. IT may still develop these initial Web Intelligence reports, since they know the data and current reporting requirements, or power users within the business may become the initial report authors. Don’t let this step discourage you—providing standard reports is a starting point only. With all the Web-based interactivity in Web Intelligence, end users (not IT developers) can easily fine-tune a report to resort, format, filter, and drill. Creating a set of standard reports ensures that users do not perceive Web Intelligence as a step backward: theoretically empowered, but overwhelmed and with no data and certainly no business insight.
Chapter 2:
Goals of Deploying BusinessObjects XI
Reporting Directly Against a Transaction System When you implement an ad hoc query tool, you may reduce report development costs, but you do nothing to improve query response time or provide meaningful context to the data. In fact, you run a high risk that you will make response time significantly worse for both the end user queries and transaction system inputs. The simple answer is to build a data warehouse or a data mart. After all, the fundamental difference between these two platforms is their sole purpose in life: automating a process versus providing business insight (see Table 1-1 in Chapter 1). Yet many companies still elect to implement BusinessObjects XI directly against the OLTP (or a copy of it) for several reasons: • Timing A data warehouse may be a long-term goal, but under budget constraints, companies need to achieve immediate benefits. They don’t have the time or resources to develop an enterprise information strategy. If you recently implemented a new OLTP, then you need reports right now, immediately, not six months from now. This kind of approach also gives you a relatively quick way of communicating the value of deploying a business intelligence solution. • Lack of sponsorship A successful data warehouse project requires strong business sponsorship and agreement across departments and functions. In contrast, OLTPbased reporting is often deemed an IT responsibility, since IT programs the reports. IT can implement and control reporting in this environment, without having to gain the buy-in necessary for a data warehouse; the politics of a data warehouse project are deferred. • Cost and complexity Data warehouse implementations range in price from $50,000 to millions of dollars. Poorly managed projects can take years to achieve
PART I
Author and researcher Jeremy Hope suggests in his book, Reinventing the CFO, that IT is a culprit in CFOs being increasingly overwhelmed. He suggests that IT has provided finance users with so much unfiltered data that CFOs should be “more wary of implementing new tools and IT systems that soak up valuable time and money but fail to provide reasonable value.” At first blush, his case seems to put unfair blame on IT. IT often provides users with more unfettered access to data, because they ask for it . . . or because the users don’t and can’t adequately define their requirements. Users must accept some culpability in the overwhelming amount of data (but little business insight) that many data warehouse and business intelligence implementations provide. Yet in support of Hope’s contention, IT can do much more to ensure value is provided. Standard reports are certainly a way of accomplishing this. Dashboards are yet another. In this regard, IT knows what is possible and needs to work in concert with the business to ensure both constituents achieve their goals. Over time, as both power users and casual users work with the standard Web Intelligence reports, they can move on to modify, customize, and finally, create their own reports. It is this phase of the implementation in which IT realizes the cost benefit, and the business gains a lot of other benefits. Had you stayed in custom development mode with only a handful of Crystal Report experts, the programmers would still be hard-coding inflexible reports and users would see only a limited amount of data. While the goal to limiting custom report development may not sound as glorious and strategic as “enterprise performance management,” it is valid, with a measurable benefit of reduced costs and overtime, along with improved business insight.
25
26
Part I:
Getting Ready for BusinessObjects XI
measurable benefits, and even well-managed ones will take several months. In addition to selecting a BI tool, you will face a number of other choices in terms of architecture, servers, databases, data integration and ETL tools, approach, and design. A data warehouse is a long-term investment, but be careful not to ignore the hidden costs associated with implementing Web Intelligence against the OLTP. Lack of dimensional or cross-functional data may limit the data’s usability; data will remain just “data” and not “information.” The universes will be significantly more complex and take longer to develop, as transformations normally done in the ETL process must be performed to a degree in the universe. • Real-time access Real-time BI continues to generate a fair bit of hype, and new buzzwords such as “Operational BI” add to both hype and confusion. The real-time debate is both a technology issue and a business requirements issue: what do users need, and what technology can best meet those needs. Certain technologies allow a data warehouse to be updated in near real time as source data changes. For some applications (such as stock traders and risk management), users indeed need access to real-time data with data feeds from multiple processes and functions. Here, EII technologies (note Business Objects’ recent acquisition of Medience) are compelling. However, real-time BI also touches a nerve with OLTP users who need flexible access to transaction-level data. ERP vendors may excel in business process automation, but they have generally been weak at providing intuitive reporting tools. As long as the transaction processing time does not suffer, it makes perfect sense to integrate BusinessObjects XI with the OLTP, whether embedding Crystal Reports within an OLTP application or using Data Integrator and Web Intelligence against an ERP-centric data mart. The vendor provides a number of solutions to facilitate this. Rapid Marts are prepackaged data models for specific ERP solutions such as PeopleSoft, Oracle Financials, Siebel, SAP, and J.D. Edward. Further, some BusinessObjects XI features such as multipass SQL, derived tables, and multiple data providers per report make real-time BI against the OLTP achievable. Whatever your reason for using BusinessObjects XI directly against the OLTP, you will need to take some precautions to ensure a successful deployment. Killer queries can cripple a system and prevent orders from being processed. It takes only a few times for this to happen before you will either (a) fund a data warehouse or (b) limit ad hoc access. If BusinessObjects XI is to become a strategic application, you do not want to limit access. However, you do want to deploy in a highly managed way, even more so when you are accessing an OLTP. Pay particular attention to the universe design, ensuring optimal joins and removing the ability to use nonindexed fields as condition objects (see Chapter 9, the section “Modify a Dimension”). Ensure the standard reports use prompts to limit the amount of data returned and to guarantee that the conditions are based on indexed fields. With custom OLTP reports, each user executes the query, placing an additional load on the OLTP. With BusinessObjects XI, use the Public Folders for users to access one pre-run, cached report. Use the integrated scheduling to run more resource-intensive reports during nonworking hours and possibly push certain reports to individual users. Finally, ensure you use the integrated auditing capabilities to understand who is using certain reports, universes, or objects; when; and how they are being used (see Chapter 16).
Chapter 2:
Goals of Deploying BusinessObjects XI
27
Business Goals
• Providing front-line managers with direct access to data that shows the health of the day-to-day business • Gaining insight into what was previously a black hole, caused by a closed transaction system that lacks robust reporting capabilities • Providing data to support company-wide initiatives such as enterprise performance management, business process reengineering, Sarbanes-Oxley compliance, and Six Sigma Even when the goals are this broad, to achieve measurable benefits, you need to develop more precise goals and tie them in with the BusinessObjects XI development
PART I
Regardless whether you are starting out with a departmental implementation or with the simple goal of automating a legacy report process, the sweet spot of business intelligence is when it is aligned with the business goals. This is when BusinessObjects XI is not merely a productivity tool (for example, to get the same data faster) but a strategic tool that measurably affects company profitability, competitiveness, and market share. Even if you start out implementing BusinessObjects XI to fulfill IT goals, the road does not end there. Its uses will evolve, and in support of this evolution, IT must realize that much of the BusinessObjects deployment is iterative. Those initial starter reports should be modified as the business environment changes. Documents in Public Folders (or in version 6 and earlier, Corporate Documents) should be modified as the business uses BusinessObjects XI more effectively, drivers of performance are measured, or the business environment changes. If these reports and/or universes remain static for an extended period of time, it’s an indication that your deployment is not closely aligned with the business needs. Arguably, there will be some universes and reports that are more operational in nature and that support work processes that may not change all that often. If you are a project manager or sponsor, then it’s easier for you to keep the project aligned with the business goals. If you are a lone power user or universe developer, you may be thinking, “Not me, that’s for the higher-ups to do!” Perhaps. However, as the BusinessObjects XI expert, you are best suited to understand how the various modules can be leveraged to fulfill the business goals. Too often there is a disconnect between the opportunities and the technical capabilities. Keep your ear to the ground, and you will discover the opportunities. Read the company newsletters, and you will discern the company goals and come up with new ideas on how BusinessObjects XI can help achieve those goals. Most business units have individual business plans. Take a look at them. Which reports can you design to measure implementation of the business plan? Don’t forget that some of the world’s greatest innovations have come from the rank and file, not the executives! Given the volume and breadth of data needed to fulfill broad company goals, BusinessObjects XI is often implemented in conjunction with a data warehouse or data mart. If the data warehouse is being implemented at the same time, many of the business goals in implementing and justifying the warehouse will be the same for implementing BusinessObjects XI. The business goals may be fairly broad, such as
28
Part I:
Getting Ready for BusinessObjects XI
and implementation. Table 2-1 provides some typical goals by process. With each broad goal, as you implement BusinessObjects XI, identify what information elements help achieve or measure the goal. If the elements are in the data warehouse, then ensure these elements are exposed in the universe along with the necessary dimensions to provide context to the data. While the goals in Table 2-1 are company-oriented, other business goals may be more narrowly defined yet still provide a measurable benefit. As you implement BusinessObjects XI in phases or by departments, look to align the implementation with achieving these specific business goals. Process
Goals
Measures
Sales and Marketing
Improve customer loyalty
• Customer sales over time • Customers who buy both products A and B • Customer purchases by channel • Share of wallet • Customer churn
Supply Chain
Manage prices
• Price trend over time • Retail price versus manufacturing costs
Increase market share
• Revenue versus competitors • Revenue trend versus industry trend
On-time delivery
• Number/volume shipments shipped by requested data
• Number of early, on-time, late orders over time
• Inventory levels for top-selling products
• Ratio of number of days of sales versus inventory to fulfill those sales (DSI) Low freight costs
• Orders fulfilled from most costeffective shipping point • Freight costs • Volumes and discounts with freight suppliers
Finance
Reduce aging of accounts receivable Reduce budget variance
• Accounts receivable over time • Actual expense versus budget
Human Resources
Reduce employee turnover Competitive pay
• Employee turnover over time • Salary versus job level, job history, market salaries
TABLE 2-1 Use BusinessObjects XI to Monitor and Achieve Business Goals
Chapter 2:
Goals of Deploying BusinessObjects XI
29
Following are some examples from Business Objects customers and how they use the suite to achieve specific business goals:
• Emergency Medical Associates (EMA) to help physicians improve clinical diagnosis, track trends in flu-related illnesses, provide early identification of disease outbreaks, and monitor the number of patients treated in a given hour • Blue Cross Blue Shield of Kansas City as a way of controlling rising health care costs • Dow Chemical to enable all managers to control individual business unit expenses, as well as to improve supply chain efficiencies by measuring order performance and inventory levels • Simon and Schuster to track sales of particular books and determine the effectiveness of cooperative advertising • An oil and gas company to ensure contract compliance and to reduce the number of days between product shipment and invoice issuance • A manufacturing company to determine the performance of various distribution channels In some cases, the elements may not be in the data warehouse, but you can still provide them via objects in a universe or a variable in a report. In this respect, implementing a data warehouse and BusinessObjects XI simultaneously poses a challenge for the data warehouse not to become a constraint that limits your ability to leverage functionality provided by the product suite. Just because data isn’t in the data warehouse, that doesn’t mean you can’t and shouldn’t deliver data to users. If it helps achieve a business goal, do it. For example, many companies need access to external market data for benchmarking. Unless the data can be coded to conform to existing dimensions, third-party data often cannot be stored in the data warehouse. BusinessObjects XI, on the other hand, is much more flexible. It provides a number of ways to incorporate structured or unstructured external data: • The repository allows users to store non-BusinessObjects documents, so if the data comes in the form of an Excel spreadsheet or PDF document, it can be stored in the repository. • The microcube architecture allows users to merge corporate data with external data and display the results via one report or chart. • Universe designers or report authors can embed HTML and web site addresses into standard reports, providing navigation through a thought or problem-resolution process. • BusinessObjects Live Office allows users to store external data in a spreadsheet and refresh other parts of the spreadsheet from either a Crystal Report document or a Web Intelligence document. Designing and building the dimensional models, ETL process, and warehouse infrastructure is resource intensive and complex. Short-staffed and nearing (or past) a project milestone, it’s easy to devote 90 percent of the time of a BI project to delivering the physical tables or star schemas and only 10 percent of the time to delivering universes,
PART I
• T-Mobile as a way of improving call center operations and staffing levels to ensure high service levels for its 20 million subscribers
30
Part I:
Getting Ready for BusinessObjects XI
reports, and dashboards. For the business, though, the reports and dashboards are the primary window to the data warehouse. Make it unwieldy, and the business will not be able to focus on analyzing data for business benefit; they’ll spend an inordinate amount of time figuring out how to use the tool. Fail to provide standard reports or dashboards, and the business may feel nothing was delivered. For each of the business goals, you must develop a corresponding standard report as part of the BI deployment effort. This standard report may act as a template that users then refresh with their own view of the data, or it may be automatically refreshed and sent to them. This all sounds pretty obvious, doesn’t it? It should be! The issue is that while these business goals are often used to get project funding, with all the technological and organizational issues involved in delivering a BI solution, it’s easy to forget why you started on this endeavor. The project team gets so focused on setting up the infrastructure, they leave it for the users to figure out what to do with these newfangled tools. In some rare organizations, where computer and data literacy is high, it may be a valid approach simply to deliver the tools. The business runs with it and exploits the value. Usually, though, users accustomed to no data or to inflexible, custom-developed reports do not immediately know how to approach a flexible BI tool. It’s up to you as the BusinessObjects project manager, team leader, power user, or internal expert to show them the possibilities!
BI Standardization: A Joint Goal As BI deployments have evolved and matured over the years, both IT and the business increasingly recognize a joint goal: to reduce the number of disparate BI tools so that business users have access to one version of the truth and IT can better support a smaller number of tools. With XI Release 2, Business Objects offers a complete toolset that serves one of the broadest ranges of users needs, all on a common platform. Chapter 3 discusses the different user segments in a BI implementation and how you may tailor your solution, training, and promotion efforts to each of these user segments. With BI standardization, the goal is not to create a “one size fits all” solution. Instead, it’s to ensure that for each BI segment, there is only one standard tool that shares a common server, security, and metadata environment: for example, one ad hoc query tool for power users, one dashboard interface for executives, one production reporting tool for IT developers. With a smaller number of tools to support, IT reaps enormous cost savings in terms of reduced software licensing and maintenance fees, lower hardware costs, and lower support costs, while still improving service levels. For the business, it reduces their training time and ensures one version of the truth. Even when companies implement a data warehouse to achieve a single version of truth, if different BI tools access the same data in the data warehouse, measures can be recalculated and represented in each BI tool in a slightly different way. Although BI standardization is crucial for an enterprise solution, there are often insurmountable obstacles to achieving standardization. First, many companies still allow individual business units to purchase BI solutions themselves; such solutions are not necessarily purchased by a central IT or purchasing department. Second, when IT fails to partner with the business and views itself as the “gatekeeper” to data access rather than an enabler, the business must take matters into its own hands. At risk for IT is control and, for some, job protection; at risk for the business is competitiveness and eventually viability. Ideally, both stakeholders share a common goal, and I would suspect that those who don’t
Chapter 2:
Goals of Deploying BusinessObjects XI
Measures of Success How you measure success is determined, in part, by the goals you wish to achieve. On an intangible level, you know your implementation is successful when • People have heard of BusinessObjects (or the name of your BI project/application). • The business sees IT as a partner and not as a gatekeeper who holds the key to corporate data. • Users feel empowered to get to the information they need to do their jobs. • Business and financial analysts feel they spend less time collecting data and more time analyzing data, using it to make informed decisions. It’s a paradox that a tool that allows quantitative measurement of business goals is seldom measured itself. In some respects, this is true of many IT projects in which the measure of success is simply whether the application is delivered on time and on budget. As part of the annual OLAP Survey (www.survey.com/olap/), Nigel Pendse has surveyed customers each year to determine what benefits they obtained (or failed to achieve) by deploying a BI solution and whether or not those benefits were quantified. As shown in Figure 2-1, the most proven and quantified benefits are the least tangible: faster, more accurate reporting and better business decisions. The number of companies quantifying these benefits has also increased from 2002 to 2005. The more tangible benefits of saving headcount, increasing revenues, and so on are suspected but not formally measured. The chart in Figure 2-1 uses the following weighting: Level of Benefit Reported
Weighting
Proven and quantified
10
Proven but not measured
8
Formally claimed but not verified
5
Informally suspected
3
Not achieved
–2
Got worse/more expensive
–6
Don’t know
0
PART I
will ultimately fail, causing IT to be outsourced or the business to go bankrupt. Finally, standardization takes a high degree of executive sponsorship, as standardization often means some users will need to make sacrifices, either in terms of shutting down other BI applications or in giving up customized or specialized functionality that may be important to a few but not to the enterprise as a whole. With so many barriers to standardization, I was pleasantly surprised to find in a TDWI survey I co-authored, “Enterprise Business Intelligence: Strategies and Technologies for Deploying BI on an Enterprise Scale,” a relatively high success rate: 58 percent consider their standardization efforts highly to very highly successful (based on 594 respondents from a mixture of company sizes and geographic locations). A third of organizations surveyed say they plan to standardize on an integrated suite of BI tools within two years, and another 24 percent have already standardized.
31
32
Part I:
Getting Ready for BusinessObjects XI
FIGURE 2-1 Benefits trend from The OLAP Surveys by Nigel Pendse. Reprinted with permission.
In achieving IT goals, there are a number of ways to measure success: • The number of custom OLTP reports eliminated • Reduction in IT overtime or contract programmers for developing custom reports • Elimination of duplicate, competing report systems • Number of users trained versus number of users who log in to BusinessObjects on a regular basis • Number of queries executed each month • Number of standard reports accessed
TIP Refer to Chapter 16 for approaches to tracking BusinessObjects XI usage. In measuring achievement of business goals, the great debate is over how much can be attributed to implementing BusinessObjects XI versus other variables that help achieve the goal. I suspect this is one reason why the OLAP Survey shows it is a benefit that is less often measured. For example, in Table 2-2, one of the company’s goals is to improve market share. This can be measured by changes in revenue over time or for particular market segments.
Chapter 2:
Goals of Deploying BusinessObjects XI
Percent Contribution
Increased promotion and modified ad campaign
30%
Improved product line
25%
Better employee training, customer service, reduced turnover
30%
BusinessObjects’ access to information to focus marketing efforts on most likely buyers, ensure order compliance, reduce product defect
15%
TABLE 2-2 Estimates for How Much Cost Savings / Revenue Improvement Can Be Attributed to the BusinessObjects Implementation
BusinessObjects provides the information to measure progress and to do more targeted marketing. However, achieving the goal may require increased promotion, improved product support and innovation, better training of customer service personnel, reduced employee turnover, and so on. Exogenous change may remove a competitor from the market, allowing a company to improve market share without having taken any other action. When several variables contribute toward achieving that goal, then assign a reasonable percentage for how much BusinessObjects contributes toward achieving the goal. In the following table, BusinessObjects contributed 15 percent to increased market share. Is this an exact number? No. Can it ever be precisely measured? No. It is merely one measure of success. Thus if a five-billion-dollar company increases its revenues by 10 percent in an otherwise flat market, you can say BusinessObjects contributed $500,000 toward achieving this goal (10% x $5B x 15% = $500K). With the more specific goals described earlier, the measure of success may be an improvement over the initial situation. Some companies that have implemented BusinessObjects can cite individual cases where BusinessObjects directly affected the bottom line. For example, a manufacturing company used BusinessObjects to do a gap analysis of production costs between two similar facilities; they identified $1 million in operating inefficiencies. Without BusinessObjects, they would not have had the data to identify this opportunity. So perhaps you would say BusinessObjects is 50 percent responsible for the cost savings; the remaining 50 percent can be attributed to eliminating the inefficiencies. The beauty of this example is that the company started implementing BusinessObjects as a follow-on to an ERP implementation. The goal was for IT to eliminate custom, disparate reporting systems, and now, BusinessObjects is a strategic asset that has helped the company achieve a number of business goals and measurable business benefit. Owens and Minor was one of the early adopters of Web Intelligence and has won numerous awards for its use of business intelligence. As a medical supplies distributor, the company’s data warehouse contains information on suppliers’ delivery performance and hospitals’ purchasing volumes. By providing both the hospitals and distributors access to this intermediary data, the company attributes millions of dollars in new business to their BusinessObjects extranet implementation. Their BusinessObjects implementation provides a competitive advantage and holds strategic value. Yet, it too had humble beginnings. According to Don Stoller, the director of information management, the original goal was to improve productivity of the field sellers who needed access to information while visiting clients. Several years after the initial implementation, BusinessObjects not only offers a competitive advantage but is its own revenue stream, as external customers pay for access.
PART I
Action to Improve Market Share
33
34
Part I:
Getting Ready for BusinessObjects XI
Emergency Medical Associates (EMA) was an early adopter of Web Intelligence, Dashboard Manager, and XI Release 2. They’ve received extensive media coverage for their innovative use of business intelligence in an industry that lags others in IT innovation. When EMA added several hospitals as new clients, it attributed the advanced business intelligence infrastructure as a major selling point. Their long-term goal is to be able to offer their BI product to other emergency departments as a template.
ROI as a Measure of Success Return on investment (ROI) is another measure of success and one that is often used to fund the project. While it is fairly easy to measure the cost of the BusinessObjects implementation (the investment portion), it is not easy to measure the return. As you saw in the preceding section, it’s debatable how much of a revenue increase you can attribute to BusinessObjects versus other factors. Even when ROI is used to fund a project, companies rarely go back and measure the actual ROI. It is a precise number derived from imprecise inputs. IDC first published a study on the ROI for data warehouses in 1996. IDC determined the average three-year ROI was 401 percent for the 62 projects measured. The Data Warehousing Institute (TDWI) published a study in 2000, showing an ROI of 300 percent. While 47 companies participated in the study, less than a quarter measured ROI. In December 2002, IDC released another ROI study focusing on the value of business analytics, the applications that reside on top of a data warehouse. The average ROI was 431 percent, and the median was 112 percent, with less than a year payback period. Some companies had returns of more than 2000 percent, and IDC reported that the most successful projects were when the business analytics implementation corresponded with business process improvements. As business intelligence moves from departmental solutions to enterprise applications, some companies have measured the ROI for efforts to standardize on a single BI platform. According to the TDWI survey I co-authored, mentioned previously, only 9 percent of companies surveyed (43 out of 460 respondents) have measured the ROI for standardizing on a BI platform. The estimated average three-year ROI is 60 percent, with an annual savings of $781,724. Blue Cross and Blue Shield of Kansas City, an early adopter of XI Release 2, estimated its ROI for standardizing and migration to the new platform at 150 percent for a three-year period. With ROI being such an imprecise measure, it’s not surprising many companies never go back and calculate it for a business intelligence implementation. You know your project is successful according to all the other measures of success described in the preceding sections. Nonetheless, it is a number that provides a basis for comparison to other BI implementations and IT initiatives. It also is a measure well understood by finance users, a significant group of BusinessObjects users. In this respect, knowing your approximate ROI is a useful tool in promoting BusinessObjects. The basic formula for calculating ROI over a three-year period is ROI = [(NPV Cost Reduction + Revenue Contribution )/Initial Investment] x 100 Net Present Value (NPV) considers the time value of money. In simplistic terms, if the company had one million dollars to deposit in a bank today, next year, assuming a meager five-percent interest, it would be worth $1,050,000. The formula to calculate NPV of a threeyear cost or revenue is NPV = F/(1 + r)+ F/(1 + r)2 + F/(1 + r)3
Chapter 2:
Goals of Deploying BusinessObjects XI
• $500,000 revenue contribution each year • $400,000 annual savings by eliminating two custom report programmers @ 2 x 2,000 hours x $100 an hour • 10 percent discount rate • $1 million initial investment in hardware, software, training, and consulting to implement BusinessObjects The projected ROI for a three-year period is
For additional information on evaluating the ROI for your implementation, Jonathan Wu, a principal of Knightsbridge Solutions LLC, teaches a course for TDWI on measuring the value of your BI implementation. You can access his ROI calculator and white paper at www.knightsbridge.com/news/white.php.
Summary You may have multiple goals in deploying BusinessObjects XI. These goals change over time as your use of information and your BI deployment matures. Recognize that the goals of IT and business users may sometimes conflict. When IT and the business partner together and a BI deployment is aligned with the business objectives, then expect to achieve greater success. Measuring the benefits of your implementation is useful for project funding and promoting the BI application. In absence of these measurements, look for a number of other indicators that show progress toward achieving these goals.
PART I
F is the future cash flow from the cost reductions and revenue contributions. r is the discount rate for your company. Five percent may be the interest a bank is willing to pay, but companies will have a different rate that takes into account the expected return for other investments and opportunity costs from investing in BusinessObjects versus other capital projects. To take the earlier example of improved market share (Table 2-2), assume
35
This page intentionally left blank
3
CHAPTER
Understanding Your Users
W
ith any BI deployment, there are different groups of users, all with distinct information and functional needs. The ways they want to access BusinessObjects XI will also vary. One group of users may be logged in to InfoView 90 percent of the workday and will actively ask for more data, more resources, faster query time, and more functionality. Another group may never directly log in to InfoView yet will make decisions from data delivered through BusinessObjects XI, whether via a pushed e-mail report, a spreadsheet populated from Live Office, or data quoted by an analyst. Both groups of users are your customers, yet they will have very different needs that affect how you develop, promote, and deploy the various products. Using the marketing concept of customer segmentation will help you identify your user groups, understand their different needs, and develop a better deployment strategy. Chapter 3 defines possible user segments, and Chapter 4 describes what you customize per segment.
What Is Segmentation? Segmentation is a way of looking at one large user base—for example, all employees in a company—and dividing it into smaller groups. Each segment, or smaller group, has similar characteristics, needs, or benefits. In different chapters in this book, I refer to two common segments: report authors and information consumers. Your company may have more than these two segments. Segmentation provides you a way of better understanding your users and why their requirements are different. It will help you prioritize target user groups and provide the appropriate information and functionality to achieve the highest business value. As you define different segments, you will want to tailor your product offering, promotion, implementation schedule, and training for each segment. You also may use the segments to define groups and permissions in the Central Management Console, which replaces Supervisor (see Chapter 13). Following are some characteristics that will help you segment potential BusinessObjects XI users.
Computer Literacy Level Potential BI users who have worked with personal computers and the Internet since their inception will greet BusinessObjects XI differently than those who did not. Users who primarily surf the Web but who are not proficient with spreadsheets and other Windows-based programs fall somewhere in the middle. Computer literacy today is much higher than in the early 1990s, when Business Objects and business intelligence as an
37 Copyright © 2006 by The McGraw-Hill Companies. Click here for terms of use.
38
Part I:
Getting Ready for BusinessObjects XI
industry first emerged. Information sharing is much more prevalent, yet boundaries still exist and many employees still greet computers with a degree of trepidation. Recognize that such users still may need information to do their jobs, yet they may not see BusinessObjects XI as their primary resource. These users still may request scheduled, printed reports or, in the absence of such automation, may rely on gut-feel decision-making.
Primary vs. Secondary Some users log in to InfoView to develop their own reports, refresh queries, and interactively analyze the data. These are primary users whom you will grant access to in the CMC. However, you will also have a secondary segment of users who consume the information provided by report authors and analysts. These secondary users may never log directly in to BusinessObjects XI; in fact, they may not even know BusinessObjects XI exists (unless you do some proactive promotion, covered in Chapter 4). They know only that they get a report via e-mail or a corporate intranet. For all they know, the data came directly out of one ERP screen. It will be hard for you to estimate the size of this “secondary” user segment, but in many instances, some of your most important customers are in this secondary user segment. Let’s say the VP of Marketing receives BusinessObjects-generated PDF files via e-mail on a regular basis. These standard reports are critical for the VP. The VP’s administrative assistant is the one who developed the initial reports and scheduled them via InfoView. The assistant makes sure the reports are generated and delivered as needed. Meanwhile, as more users access the system, the Job Server is getting overloaded. Some reports run much later than requested; some fail to execute. The primary user, the administrative assistant, may be the one to shout, but it is the secondary user, the VP of Marketing, that can most likely approve funding for an additional server. Also, it is this secondary customer—who has never logged directly in to InfoView—who will most likely see the business potential of products you have not yet implemented, such as Dashboard Manager or Enterprise Performance Manager. Job Level A user’s job level will affect the breadth of data the user wants to access (number of reports and universes) and the level of detail. Executive-level jobs may need a broad set of data but without a lot of detail. Analyzing the data is a minor part of these jobs, so these may be the people for whom you want to develop a dashboard with key performance indicators, whether a My InfoView page or an interactive dashboard via Dashboard Manager. Mid-level jobs may still need a broad set of data but with more detail. The combination of broad data requirements and more detailed data may make it hard to deliver only dashboards. They may need access to multiple InfoView folders, multiple documents, and ad hoc access. Entry-level accounts payable clerks or customer service representatives may want to see only very detailed data. As their information requirements are narrow, these users may need only a few standard reports with interactive prompts; they may access BusinessObjects XI often, constantly refreshing a document for a particular account, customer, date range, and so on. Job Function You also can segment users according to job function. Supply chain users will all have similar information needs, which will be different from the information needs of users in the finance department. Functional requirements also may vary by function: consider how many spreadsheet power users there are in any finance department. This group of users then may not care about dashboards as much as they care about spreadsheet integration. Marketing personnel will have different information requirements, and with respect to functionality, they may ask for things such as predictive analysis that other
Chapter 3:
U n d e r s t a n d i n g Yo u r U s e r s
• Recognize that the different functions will have different requirements, thus demanding certain modules and capabilities more than other groups • Prioritize fulfillment of those requirements Some jobs require a significant amount of data analysis. The analytic component also may relate to either the job level or the job function, or sometimes to both. For example, financial analysts may be fairly senior in a business; these jobs have a high analytic component. These are the number crunchers who will pound the system. They understand the different data nuances and even the potential data sources. It’s easy to assume that these people are your only users, since they may have solutions implemented first, complain loudest when something is wrong, live and die by access to information, and control the information flow to secondary users. This may in fact be you! With all your demands for access to information, the company rewarded you with being a universe designer, report author, or BusinessObjects XI subject matter expert. Congratulations! Remember, though, that not everyone can spend all day collecting, manipulating, and exploring data. Some users need access to standard reports simply to know what is going on. They log in to InfoView for ten minutes a day (or week) just to make sure the business is running smoothly . . . or to find out if there is enough inventory to fulfill an order . . . or to identify customers with outstanding invoices. When the information indicates a problem area, it may not be their job to sift through the data to identify the underlying cause. Instead, they may call the business or financial analyst to figure out why there is a problem. In BI, we seem to have a tendency to want all end users to become experts. It’s a profound difference to empower a user—to provide them with easy tools to access and explore information when they need to—and an altogether different scenario to assume accessing and analyzing data is their primary job. Users whose job content requires a fair bit of data analysis often demand more features and functions. Do not let their demands fool you into thinking all your users need these advanced capabilities. Jobs with a high analytic content may use more capabilities such as Live Office, report variables, multiple data providers, and ad hoc queries; on the other hand, users with jobs with minimal analytic content may only refresh a standard report on a periodic basis. At most, they might evolve to Web Intelligence Interactive or Intelligent Question users.
Degree of Analytic Job Content
Some of your users may also enter data into the transaction or ERP system. Regardless whether your company uses BusinessObjects XI directly against the transaction system or an ERP-populated data warehouse, these users will be more familiar with the precise meanings of individual objects. At the same time, dimensional groupings and hierarchies that don’t exist in the source system may be a completely new concept. These users may need additional explanation as to why there is a data warehouse and how the data has been transformed.
ERP or Source System Use
PART I
groups have not requested. Administrative assistants may not be decision-makers, but in many companies, their exceptional computer literacy and multitasking skills have led them to become expert users of Web Intelligence. In many companies, certain job functions also have varying degrees of influence and power. Ideally, the degree of influence would be commensurate with the degree of value added to the company, but that’s not always the case. The challenge for you as a BusinessObjects project manager or administrator is to
39
40
Part I:
Getting Ready for BusinessObjects XI
Level of Data Literacy Data literacy and computer literacy are two entirely different things. I may be computer literate, but if you ask me to decipher the meaning of baseball statistics, I’m clueless (RBIs maybe, but ERA and SO, forget it!); I don’t know the data. So too with corporate data. Source system users and users whose jobs have a high analytic content may understand the data well and have a high level of data literacy. Certain users may understand the finer points of “price.” Is it list price, average selling price, price net of returns? However, you cannot assume that users with high levels of data literacy have equally high computer literacy. A transaction system user may know the data but be comfortable entering data only by following the exact same screens every time. Change the user interface and such users are lost. An often-minimized part of a BusinessObjects implementation is regarding training users on the data. You can train users where to click to build certain queries, but training them to interpret the data and simply to know what the data is and means requires separate attention. The context panel in Web Intelligence XI Release 2 can go a long way to helping with data literacy. Object descriptions are finally displayed to report consumers, not just to report authors. This assumes that the universe designer has populated the object descriptions. If you are a long-time BusinessObjects user and never bothered to complete this part of the universe before, this latest release makes it well worth the effort. The Encyclopedia also can help users understand what the data elements mean and which reports are most appropriate for a given decision-making process. Level of Spreadsheet Usage Spreadsheet users deserve their own segment and, thus, sometimes their own BI interface. They are loyal to the spreadsheet and think everything should be delivered in a spreadsheet. I used to underestimate the importance of this but was cured of my oversight in the early 1990s. After spending months developing a DSS system for a new transaction system, I waited with bated breath finally to train the users. The users balked at these inflexible, ugly mainframe-based reports and asked, “Why do we need these reports? Just dump all the data into Excel.” Indeed! Fortunately, Business Objects has a couple of solutions for such users. First introduced in BusinessObjects Version 6.0, users can save a report directly to Excel; the save nicely preserves the charts, formatting, and breaks. Further, with the integrated scheduling in XI, you can schedule a report to be automatically exported to an Excel file format. Finally, Live Office allows users to execute queries directly from a spreadsheet. Links to the Web Intelligence or Crystal Reports documents are maintained in the spreadsheet, allowing users to access new data in real time. There are a number of challenges with BI and spreadsheet integration. Volume of data is one thing; multiple versions of the truth when the data is manipulated locally is another. So do consider why users want the spreadsheet integration at all. For a discussion of valid and less valid reasons, see BIScorecard.com, Spreadsheet Integration Criteria. Regardless of such challenges, do recognize this user segment and develop a strategy to meet their distinct needs while simultaneously ensuring that the spreadsheets do not get out of hand and become mini–data marts.
Amount of Travel Certain job types require more travel than others. Some users may access the system only from their desktop or a corporate browser; users who travel may want access via a BlackBerry or a notebook computer. They may want information broadcast to them or may want to work in offline mode, exploring previously refreshed queries and drilling in local microcubes.
Chapter 3:
U n d e r s t a n d i n g Yo u r U s e r s
As you ramp up your BusinessObjects XI implementation, you will offer different users access to the system at different points in time. As described in Chapter 4, many tasks, including levels of communication, content, resource planning, and so on, will be tailored according to different user groups and their implementation phase.
Implementation Phase
Internal vs. External Users Consider the different needs of employees of the company and customers that you may provide information to via an extranet. Internal employees may be allowed to access whatever software module you have licensed, whereas external customers often will have more restrictions on content and functionality. External users have different requirements from your internal users. Authentication in large extranets can be one challenge if you will have thousands of potential extranet users. Do they all need a unique login, or will you use a guest login? If you allow certain customers to create new queries, their own security policies may not allow applets to cross firewalls, thus requiring the use of the HTML interface. Internal employees may have access to more data, whereas external users will only be allowed to see their data. For these users, you may use the row restrictions and object security levels in Designer.
Others Who Affect Implementation Efforts In addition to your target users (either primary or secondary), you need to be aware of gatekeepers, influencers, and deciders (Figure 3-1). These people may or may not be eventual BusinessObjects XI users, but they do affect project funding and your implementation efforts. For each type of stakeholder, I have provided an archetype. The individual job titles and dynamics will vary company to company. The important thing is to recognize that it is more than just the users that affect the success of your implementation and whose needs you must consider.
Gatekeepers Gatekeepers control access to potential data sources, existing reports, or even other users. Gatekeepers can either help your implementation be a wild success or sabotage your efforts. Let’s assume you want to use BusinessObjects XI to access a central data warehouse. IT had a vision of the central data warehouse being used to populate dependent data marts. Unfortunately, due to budget constraints, lack of understanding, and political issues, your individual business unit or function never built a dependent data mart. The central data warehouse owner/project manager is a gatekeeper. The gatekeeper will either grant you ad hoc access, knowing you will only complain about the lousy response time (that’s why they wanted you to sponsor a data mart!), or do everything to impede the BusinessObjects implementation. Thus, the infighting begins. Ideally, the two stakeholders work together to • Implement BusinessObjects XI in a controlled way. • Understand usage to educate users/sponsors on the value of BI. • Analyze access patterns and problems to fund and develop the dependent data mart.
PART I
With a greater number of reports being authored in Web Intelligence, you must consider the disconnected aspect of users who travel frequently. There are a number of solutions to address these users’ needs. Perhaps a PDF document or spreadsheet is sufficient. Or they may want to drill and sort offline via a Desktop Intelligence document. Longer-term, the vendor plans to provide a Web Intelligence viewer for this kind of disconnected access.
41
42
Part I:
Getting Ready for BusinessObjects XI
FIGURE 3-1 Many people besides direct users affect the success of a BusinessObjects implementation.
The administrative assistant discussed in the preceding major section in connection with primary versus secondary status can also be a gatekeeper. As the BusinessObjects XI expert, you want to better understand the information flow and business value of the reports the assistant schedules on a regular basis. A conversation with the VP of Marketing would be invaluable. The assistant sees no need for such a meeting (nor does the VP of Marketing, since the VP has never even heard of BusinessObjects XI), as the assistant can tell you everything you want to know about how the department uses the tool anyway. At this point, you can rely exclusively on the feedback the assistant gives you, or you can ask the assistant for help by having a joint conversation with both the primary and secondary users. To make the BusinessObjects XI implementation more successful, • Understand what the gatekeepers want. • Recognize their efforts and role in the business intelligence process; look for ways to involve them or make them part of the implementation team. • Identify the mutually exclusive goals. • Identify the common goals. • Build allegiances with the gatekeepers so that they work with you, not against you. • Understand if there are any job protection issues involved here.
Influencers Influencers are another set of people that affect how well your implementation proceeds. Influencers provide input to your users about how good the solution is, whether it will really be useful, and how it is being deployed. The influencers often have some role in an existing reporting process and may have a vested interest in keeping the old reporting process running. They may be source system report programmers (why do we need a BI tool when we can hand-code everything?), source system experts (why do we need a data
Chapter 3:
U n d e r s t a n d i n g Yo u r U s e r s
Deciders Deciders are the final decision-makers. A decider may be a project sponsor or an end user or both. Deciders are in a position of authority and can cast the final vote on funding the project, establishing an implementation strategy, or approving the initial set of modules to deploy. In the preceding examples, the decider could be • The CIO who overrules the central data warehouse project manager and allows individual business units to proceed with their own implementation efforts of certain modules, regardless of what can be supported via a BI competency center • The VP of Marketing who requires all marketing staff to at least be report consumers who log in to the InfoView portal to retrieve their own reports, while the administrative assistant and business analyst are designated as the report authors • The CFO who commits to phasing out the departmental spreadsheets/databases after an agreed-upon period of running BusinessObjects XI reports in parallel
PART I
warehouse, anyway?), business analysts who have developed departmental databases, or power users. Positive influencers expedite your implementation and provide a lot of positive word-of-mouth promotion. Negative influencers impede your efforts by spreading fear and doubt. Unfortunately, you may encounter a degree of job protection or “not invented here” syndrome with negative influencers. These are the hurdles to overcome. If a business analyst has spent an inordinate amount of time creating queries to populate departmental databases and spreadsheets, then the BusinessObjects XI implementation will be perceived as a threat. It renders their data sources obsolete. Negative influencers may slow your implementation by seeding your new users with doubt by saying, “Look how slow it is! The data is wrong!” For this reason, you need influencers on your side. If they know the data requirements, then get them to have a stake in BusinessObjects XI’s success. While they may be proud of the departmental system they created, they will know too well the manual processes and reconciliation time they go through to keep the data current and accurate. If they cannot be directly part of the project team, ensure they are a focal point for implementation or a designated BusinessObjects expert. Many companies have more than one BI tool for a variety of reasons: departmental autonomy to buy their own BI solution, merger and acquisition, best of breed capabilities in several tools, to name a few. Of all the applications IT must deliver, BI standardization is the most contentious (next to spreadsheets, that is). If you are charged with reducing the number of different BI tools and converting users to the corporate standard of BusinessObjects XI, then the competing BI tool experts will be powerful influencers. They will be the first to spot how their tool is better and argue for standardizing on their BI tool. In some cases, competing BI tools may have better functionality in specific areas, so give them credit and save your breath. If you have followed an objective selection process, you should be able to articulate how the standard was selected and by what criteria BusinessObjects XI was the best fit for your company. You may have to do this multiple times before you gain acceptance. If the decision to implement BusinessObjects XI as a corporate standard was autocratic, blame the decision-maker and march onward. The bottom line is that the measure of success is not who agrees with the decision, but rather, that the standard is adopted and how well you use it to achieve a measurable business benefit.
43
44
Part I:
Getting Ready for BusinessObjects XI
Pre–business intelligence, I focused on work group computing tools. A new business unit VP was looking to improve productivity and computer literacy. In the late 1980s, this was the first time some people had ever seen a PC. Managers would scribble messages onto pieces of paper that secretaries typed and sent as e-mails. The secretaries printed incoming e-mails and manually distributed them. The new VP instructed managers to do their own e-mails and forbade the secretaries to type or print them anymore. People were dismayed and aggravated (hard to imagine today, with e-mail being so commonplace). At the time, though, his decisions were considered radical, and many wondered if it was a waste of time to expect mid-management to be “typists.” After everyone got over the shock of this radical change, productivity and computer literacy improved, and this same business unit eventually became an early adopter of business intelligence tools. I’d like to think that the Internet has drastically boosted everyone’s enthusiasm for BI tools and direct access to information, but there are still so many information boundaries in corporations. In those cases where users, gatekeepers, and influencers are resistant to business intelligence, it helps to have a strong decider to champion your implementation efforts.
When to Analyze Segments Ideally, the market segments should be identified early in the development process. As you will see in Chapter 4, market segments help you tailor deployment choices. Failure to agree on the target users or segment can quickly derail your project. As an example, a mid-sized maintenance supply company started out with a very clear scope: to enable senior marketing people to track monthly gross margin and sales by product, time, and region. They wanted a highly graphical tool with a dashboard. They selected a leading OLAP database and visualization tool, at the time a good decision for this user segment. At some point, field sellers voiced their information requirements. Field sellers needed a different level of detail than the senior marketing people, requiring daily sales figures down to the customer and order number. They didn’t want graphics; they needed the detail numbers in a tabular report. Field sellers are a different user segment than senior marketing people, with different needs. Unfortunately, the scope of this project was not well managed. The right tools were used for the wrong applications and user segments. Neither user segment was satisfied with the end product. Although the project had strong business sponsorship and was driven by business goals, it failed because the target user group was not well understood. If the market segments had been clearly defined at the project scoping stage, the project manager would have recognized the diverse needs and could have either declared the requirements out of scope or more appropriately matched the solution with each user segment.
Project Roles To deliver BI functionality, the project team should include both IT and business personnel. As discussed in Chapter 1, a business intelligence project never ends and your company’s ability to leverage it to a competitive advantage is evolutionary. Therefore, many of these roles will continue beyond the project completion to provide ongoing support. You may decide to roll some of the responsibilities into a BI competency center, or conversely, you may staff certain project phases with people who are part of an existing BI competency center.
Chapter 3:
U n d e r s t a n d i n g Yo u r U s e r s
• Program manager The program manager ensures that BusinessObjects XI is deployed consistently across multiple projects and applications. The program manager sets the priorities for projects that vie for the same resources. • Project manager The project manager controls the budget, resources, and time to implement BusinessObjects. The project manager ensures that the deliverables are within the agreed-upon scope of the project and that the project stays focused on the intended goals. • Security administrator A security administrator defines users to the CMC or to groups in the directory server and grants access to the BusinessObjects XI modules, universes, and folders. The security function can be centralized or decentralized to allow one security administrator for each department or function. The security administrator must understand the groups, permissions, and data sources, as well as staying informed about personnel changes to revoke or add access when employees change departments. Within the CMC, you can create groups that have permissions to access certain interfaces and capabilities; these groups and permissions should correspond to the different user segments you’ve identified. • Universe designer The universe designer provides the business view to the relational data in a transaction system or a data warehouse. The designer must understand SQL from a query and analysis viewpoint, database performance issues, and business requirements. It can be a challenge to find one person with these diverse skill sets. Some companies will train business analysts or power users in the more technical skills, finding this an easier approach than trying to teach an IT developer the business skills. The technical aspects required to build a universe sometimes leads a DBA to become the universe designer. The role of universe designer can also be split between two people, one who physically develops the universe and another who ensures the universe fulfills the business requirements. With larger deployments, there may be several designers across the organization, one for each business unit or function. This division has been hotly debated by customers and consultants alike. Who should own universe development—central IT or individual business units? It’s clear to me that central IT should own the BusinessObjects Enterprise Server infrastructure. At the other end of the spectrum, it’s clear to me that the business should own the report development (assuming that IT provides some starter templates). The universe lies squarely in the middle. In an ideal deployment and organization in which IT and the business are closely aligned and IT is keenly focused on helping the business accomplish its goals, IT should
PART I
• Sponsor When business goals drive the implementation, the sponsor is usually from the business. It may be the CFO if you are trying to measure financial performance, the VP of Marketing if you are trying to improve customer penetration and retention, the VP of Supply Chain if you are trying to improve order fulfillment and reduce inventory costs, and so on. If the goals of your implementation are IT-related (see Chapter 2), then the sponsor may be a senior person in the IT organization, such as the CIO, ERP manager, or data warehouse manager. The sponsor provides the funding for the project and resolves any scope issues the project team cannot resolve themselves.
45
46
Part I:
Getting Ready for BusinessObjects XI
develop the universes, with the business defining the requirements and having ultimate say over what goes in a universe and what does not. Where this centralization of the universe fails is when the universe does not meet the business requirements. When the universe doesn’t fulfill the business requirements, it forces the users to build more report formulas, create increasingly complex reports with multiple data providers, or in the end, model their own solutions in spreadsheets and departmental databases. If the universe is monolithic and inflexible, then from a company point of view, let the business build their own universe, ideally following agreed-upon design principles, utilizing shared dimensions via linked universes (see Chapter 15). In either circumstance, it’s important to have an “ultimate” designer or quality assurance process to ensure the universes are deployed consistently (see Chapter 16). The design principles and quality assurance process belong in the BI competency center, as this role continues beyond implementation. • Report author/pilot user A report author is typically a power user who both understands the data and is computer literate. Report authors may be business analysts who require ad hoc access to information or who previously created and maintained departmental data sources. They also may be professional developers who previously coded reports. Be careful to manage this, though: the goal is not to code complex reports, but rather, to leverage the common business definitions and power built into the universe. Administrative assistants who are computer literate and who provide printed reports or compiled spreadsheets may also become report authors. When first deploying a new universe, pilot the universe with report authors. Only a minority of total users will be report authors. • Information consumers Information consumers, also called report readers and report recipients, access fixed reports that may include prompts to filter the data. Report authors may prepare and distribute reports to readers via e-mail, InfoView, printouts, and so on. Information consumers may not have a high degree of computer or data literacy, or the job type may have minimal information requirements. With Web Intelligence interactive, these report readers can also dynamically sort, filter, and drill within a predefined report. While I wholeheartedly believe that all users should not evolve into report authors, I do wholeheartedly hope that the majority of information consumers will evolve to interactive report consumers. With the vendor’s current licensing model, this evolution does have an implication on product licensing and server platform. • BusinessObjects XI expert BusinessObjects XI experts know the end-user tool sets and the different modules available, but they do not necessarily understand the data. They are good with software and technology. Report authors may become BusinessObjects XI experts as they work more with the tool. Such experts should be part of an ongoing BI competency center. • Data expert A data expert may be a business analyst, data modeler, or source system expert who knows where the data comes from, the quality of the data, and its different meanings and may be the champion for a metadata repository. The data expert may not necessarily use BusinessObjects but can help resolve data discrepancies that are discovered when users start analyzing it with BusinessObjects. A data modeler designs the underlying star or snowflake schema in a data warehouse
Chapter 3:
U n d e r s t a n d i n g Yo u r U s e r s
• Database administrator (DBA) A DBA may be the universe designer or may review the universe for optimal SQL. DBAs resolve query performance problems, build aggregate tables, or correct password synchronization problems between different data sources. The DBA will also help decide the technical deployment of the BusinessObjects Enterprise repository. • Administrator or architect You may have a BusinessObjects Enterprise administrator who installs and maintains the software applications (Web Intelligence, Crystal Reports, Desktop Intelligence, Dashboard Manager, and so on). In small deployments, the BusinessObjects Enterprise administrator and the designer are often one and the same. In larger deployments, there may be multiple administrators. Whereas universe designers require a business background and SQL skills, administrators and architects require more technical skills and may be systems engineers. In addition to software issues, the administrator deals with server performance and load balancing. They will decide when to deploy BusinessObjects Enterprise in a distributed environment, which processes to run on dedicated servers, and how to provide failover protection. • Trainer The BusinessObjects XI trainer knows both the software and the data to a degree. Often, two people may provide the training to cover these two different aspects. Internal BusinessObjects XI experts may train end users, or they may use a Business Objects training partner. • Communication/marketing specialist This person provides expertise on effective ways to communicate project plans, deliverables, and goals to the different user segments. He or she may write or review articles for company newsletters, coordinate internal user conferences, design logos used in project gifts or application screens, and help ensure that key messages are stated in terms of business benefits rather than technical features.
Summary Segmentation is a way of grouping your users according to their needs and skill sets. These groupings will help you tailor deliverables and messages. Certain user groups will want only standard reports on an intermittent basis; others will need the flexibility of ad hoc access on a daily basis. Not all users will greet BusinessObjects XI with enthusiasm. Understanding these users’ roles and objectives can help you minimize the users’ disruption to your implementation efforts and enlist them as advocates to ensure a more successful deployment.
PART I
or data mart. That person can provide expertise on advanced business calculations and certain universe components such as aliases, shortcut joins, how to use derived tables, and so on. When you introduce aggregate awareness into the universe, the data modeler provides the dimensions by which to aggregate.
47
This page intentionally left blank
4
CHAPTER
Marketing BusinessObjects XI
I
n looking at this chapter title, you might respond, “Marketing BusinessObjects XI? That’s something the vendor does! Nothing to do with my implementation.” Yet it’s got everything to do with your implementation and is the one technique that will help you boost usage, user satisfaction, and ROI with little to no cash investment. It does, however, require an investment in attitude and in making sure a marketing approach gets incorporated into your project plan. Many BI project managers assume they do not need to market BusinessObjects XI. It’s easy to assume the tool should sell itself, especially if you are implementing it in response to users’ requests. Keep in mind, though, that only a handful of users may have specifically requested BusinessObjects XI and been involved in a BI tool selection or standardization. For all the other users, you need a strategy of defining what you will deliver and how you will communicate those deliverables to your different user segments. Marketing can be an uncomfortable concept for many IT people, so while this chapter will introduce you to some key marketing concepts, be sure to enlist help from your company’s internal marketing or public relations department.
When to Develop a Marketing Plan It is surprising to me (and perhaps to you as well) that one of the most popular courses I teach for The Data Warehouse Institute (TDWI) is on marketing the BI application. Amid so many other technical subjects, a soft skills course still garners high attendance. Also, when I tell people I teach a course on marketing the data warehouse, they often laugh and say, “What’s to teach? Marketing means just say yes.” Ever the gullible consumer, I respond with, “That’s selling!” Perhaps it’s a minor distinction. The essence of marketing is first and foremost understanding what users want and only then developing what they want. This sounds like the mantra of many IT organizations who want to be more aligned with the business. A marketing plan can give you the techniques to better accomplish this dialogue and level of understanding. At a minimum, a marketing plan will help you develop a communication strategy and manage user expectations. Therefore, you want to draft a market plan early in the project, often before project funding. A marketing plan will help you articulate what you intend to deliver and why. As discussed under “Product” in this chapter, a marketing approach ensures you get used
49 Copyright © 2006 by The McGraw-Hill Companies. Click here for terms of use.
50
Part I:
Getting Ready for BusinessObjects XI
to describing what you deliver in terms of the benefits, not the features. This difference in emphasis makes the funding and implementation process easier. What would your project sponsors rather invest in? • Feature A BI tool with synchronized multiple data providers that leverages a Java application server • Benefit A BI tool that will help improve profitability As you architect the BusinessObjects XI deployment and develop the various components such as universes, reports, and dashboards, update the marketing plan to reflect changes in functionality. As you work with users to define requirements and preview the functionality, you can gauge which elements of the plan are effective.
Elements of a BI Marketing Plan A BI marketing plan consists of the following elements: • Situation analysis Covers your current situation; offers competitive analysis; and includes a strengths, weaknesses, opportunities, and threats (SWOT) analysis. • Marketing mix Involves the four Ps of marketing: product, price, promotion, and place. • Groups of users Defines your BI customer segments. Divide your users into different groups as described in Chapter 3. Once you have determined your user segments, tailor the marketing mix (product, promotion, price, and place) to each segment. • Objectives Includes how you will measure your marketing and project effectiveness. Some of this may involve measurement of the goals described in Chapter 2, or it may include the marketing objectives: number of users trained, number of promotional efforts, and so on.
Situation Analysis What is the current situation in your company? Have you just begun implementing BusinessObjects, or has it been available for a while but your implementation efforts have stalled? Are you trying to standardize on BusinessObjects XI, although you have multiple BI tools? If you have only just begun to implement BusinessObjects XI, then the current situation may include these concerns: • How users currently access information (Is information contained only in the transaction system, or have departments created their own spreadsheets and databases?) • How information is shared and distributed throughout the organization • If you develop custom reports, the number of existing reports and the time backlog to fulfill new requests • Attitudes toward the existing information flows (Are users frustrated, or do they think it’s generally okay?)
Chapter 4:
Marketing BusinessObjects XI
51
If BusinessObjects has been used in the company for a while, the current situation addresses
• How much users create their own reports or the degree to which standard reports have been used • Typical query response time • System availability • Number of defined, trained, and active users • Product architecture and end-user tools to access the data (Desktop Intelligence or BusinessObjects classic, Crystal Reports, InfoView, Web Intelligence, Dashboard Manager, and so on) • How business-oriented is the universe versus too much intelligence built into individual reports • The degree to which the universe and standard reports can answer common business questions versus users having to create user-defined objects and report variables • User satisfaction with the current situation Even if BusinessObjects XI is the only BI tool in your company, it faces competition. Your job is to identify and understand the competition to articulate why and in what circumstances BusinessObjects XI is a better solution. Recall from Chapter 1 the history of business intelligence. You are trying to change years of decision-making processes within a short time frame. Resistance to change is an automatic barrier. Users may be accustomed to accessing information via paper-based reports, hand-delivered to their desk. When information is difficult to get to, gut-feel decision-making is the competition. If you are deploying BusinessObjects XI against a data warehouse, then the ERP or transaction system may be the competition. If you are trying to get decision-makers to retrieve their own reports or to access key indicators via a dashboard, the competition is the phone call to a business analyst or to an assistant who can print the reports for them. A SWOT analysis (strengths, weaknesses, opportunities, and threats) is an effective tool in evaluating the current situation in terms of BusinessObjects XI’s internal competition. It is also a necessary first step in determining what product capabilities you can and should deliver and what benefits you will emphasize in promotions. Tables 4-1 and 4-2 give two sample SWOT analyses. The first one is for a young data warehouse deployment in which BusinessObjects is not the only BI tool. The second one is for a mature BusinessObjects deployment that has stalled. The purpose of the situation analysis is to understand where you are today so that you can identify opportunities for improvement over the current situation and/or the competitive information sources. In both SWOT analyses, slow queries are a weakness that has caused a number of threats. Slow queries can be a major barrier for a successful implementation and are often identified as a reason for low BI adoption. With the ever greater immediacy the Internet provides, users want answers to business questions instantaneously, at the speed of thought. Explanations regarding indexes or query complexity are deemed irrelevant. The fact that you are providing them with more flexibility than did previous information systems is quickly forgotten.
PART I
• What data sources are available and which universes are in use
52
Part I:
Getting Ready for BusinessObjects XI
SWOT
Analysis
Strengths
• Universes are small and focused, with access to global data. • Business definitions are consistent. • Self-serve access is available.
Weaknesses
• Queries are slow. • New terminology from a recent ERP implementation is confusing to users; universes contain no bridge to old transaction system terminology. • Standard reports are unavailable. The budget and IT mandate was to build the universe; users must develop their own reports. While some may have done so, they are not shared in a consistent way, so nobody knows about them. • The data warehouse is updated weekly; users want daily updates.
Opportunities
• Create summary tables in data warehouse; include aggregate awareness in universe design to improve query performance.
• Enable scheduling for slow queries. • Update objects’ descriptions and modify training materials to bridge new and old terminology.
• Ensure standard user reports are available via public folders in InfoView. • Evaluate target user group, business goals for daily updates. Threats
• To avoid slow response time, the department assistant prints reports and manually distributes them. • Another department is implementing a MOLAP server for faster queries, with a different BI tool as the front end.
TABLE 4-1 SWOT Analysis for New Implementation
While it is true that the majority of response time issues in a BI deployment can be blamed on the data warehouse and not specifically on BusinessObjects XI, failure to fix these problems directly affects the success of BusinessObjects XI. Users will blame the tool they see, not the technology behind the scenes. Further, while it is up to the DBA to ensure the database is well tuned with efficient indexes and summary tables, it is up to the universe designer to leverage them. Ensure universe objects frequently used in conditions do not contain advanced SQL commands that cause the index to be bypassed. Report authors must ensure standard reports use condition objects from indexed fields. When you can’t improve the data source performance, then use other deployment methods to bypass the problem. Use the integrated scheduling capabilities in XI to cache and/or distribute reports. Based on the SWOT analysis in Table 4-2, implementing a MOLAP database may be a good approach for response time issues as well as complex calculations. Some companies have reported drastic performance improvements with a relatively new product, HyperRoll.
Chapter 4:
Marketing BusinessObjects XI
Analysis
Strengths
• Complete data with three years of history is available. • A number of initial ETL problems have finally been resolved. • There are multiple subject areas.
Weaknesses
• Queries are slow. • The large universe is unwieldy for users to navigate. Users inadvertently create incorrect queries when they use the wrong objects.
Opportunities
• Evaluate universe joins to improve query response time. • Evaluate the indexing strategy in data warehouse for most frequently used access paths.
• Promote resolution of ETL problems and improved data quality. • Create smaller, more targeted universes. Threats
• Since users perceive the data warehouse is always wrong, custom reports continue to be built against the ERP.
• To avoid slow response time and the unwieldy universe, business units extract data into multiple MS Access databases and create custom dashboards and front ends. TABLE 4-2 SWOT Analysis for a Mature but Stalled Deployment
In Table 4-2, one of the identified weaknesses was a large, unwieldy universe. In this real-world example, even IT professionals struggled to know which object to use when. Once the deployment team developed a more targeted universe, offered some standard reports, and promoted the resolutions and enhancements, usage increased significantly within a short period.
Marketing Mix: The Four Ps Marketing mix is a set of interdependent tools for increasing BusinessObjects XI usage and the impact it has within your company. If you speak to one of your internal marketing experts, he or she may give you a couple more Ps to add to the mix, but for business intelligence the most important Ps are product, price, promotion, and place.
Product If you think the choice of product is predetermined, think again! First, consider that the BusinessObjects XI platform has multiple user interfaces, each targeted at a different user group requiring slightly different capabilities. The delineation for when to use a given product is not an absolute. Different user groups may overlap in requirements and therefore in product usage. Table 4-3 lists some of the BusinessObjects XI modules and the corresponding user group.
PART I
SWOT
53
54
Part I:
Getting Ready for BusinessObjects XI
Product
Primary User Group
Crystal Reports
IT developers to design pixel-perfect reports that may need to be bursted to multiple recipients or embedded within an application
Web Intelligence
Business authors to design shared reports or ad hoc queries and analyses
Intelligent Question
Executives who want fast answers to common business questions
Desktop Intelligence
Power users who want to design more complex reports for disconnected access
Live Office
Power users who prefer the Excel interface
Dashboard Manager
Executives and managers who want an overview of key metrics
InfoView only
Information consumers who want to view and refresh standard reports but who don’t need to build their own. Reports can include those built in Crystal Reports, Web Intelligence, Desktop Intelligence
Performance Manager
Managers who wish to set and manage goals and understand cause and effect of performance indicators.
TABLE 4-3
Match the Product Module with the Needs of the User Group
Also, realize that in some circles and with some user segments, these individual product names may have meaning and recognition. Many users, however, may have never heard of them. In this respect, you will have to repeat, within your own organization, all the selling Business Objects, the company, had to go through to persuade you to buy their tool set. As you do so, focus as much as possible on the benefits your implementation will deliver, not the technical features of the products. Consider some of the products you buy as a consumer. For example, Disney World emphasizes the magic and memories (the benefits), not the number of rides and attractions (the features). Particularly with business intelligence, a number of technical features will have little meaning to users, yet clearly, IT professionals are comfortable focusing on features. Restating the features in terms of the benefits is one of the hardest language barriers for the project team to overcome. Table 4-4 highlights some features that are better described to users in terms of the benefits they provide. In a few instances, the feature and related benefit will be clear; but these instances are in the minority. For example, if you emphasize the ability to create graphs, spreadsheet users who have used graphs in their analysis will recognize that graphs provide the benefit of visual analysis and a faster ability to spot trends, problems, and opportunities. When you buy a car, you know that four-wheel or front-wheel drive (feature) will allow you to control your car better in snow (the benefit). When the benefit is not immediately clear, document it as part of your project plan. Then have the project team practice articulating the benefits so that they (1) stay focused on why you are implementing BusinessObjects XI and (2) can more effectively promote your efforts in both formal and casual conversations with users. A second aspect to the product component of the market mix is what to call the product. Will you refer to it by the vendor-provided product names, or will you give it a different
Chapter 4:
Marketing BusinessObjects XI
Benefit
Aggregate awareness
Fast queries
InfoView Public Folders
Immediate access to key performance indicators; one version of the truth with no loss in time reconciling different reports
Disconnected access
Ability to work with reports while on the plane or at a customer site
Ad hoc queries
Explore the root cause of a problem, without waiting for an IT report developer
Exception-based reporting
Proactively manage the business when indicators fall below a certain threshold; fix a problem before it is out of control
TABLE 4-4 Emphasize Benefits, Not Features
name that also reflects the business goals and data sources? The benefit of including the vendor-provided name is that you can leverage some of the vendor’s marketing efforts. The downside is if the vendor changes product names, it can cause confusion. If you are suffering from a stalled implementation or if there were negative impressions early in the implementation, change the name! When you develop your own BI product name, be sure to consider the acronym created. If it is a global deployment, take into account the cultural impact of acronyms. Following are some clever product names: • WISDOM Web Intelligence Supporting Decisions, from Owens & Minor. WISDOM Gold is an enhanced extranet version. • OASIS
Online Analysis Sales Information System
• Risk Intelligence Used by Zurich North America for insurance claims and losses • Inventory Workbench Used by Lands’ End for inventory information delivered via Application Foundation • Honeycomb Used by Burt’s Bees to brand information accessed via BusinessObjects XI. A tag line displayed in InfoView, “A Bee’s Eye View”, also conveys the message that this information helps the “worker bees” in the company. • Business Intelligence Center of Excellence (BICE) Used by Cingular Wireless, which has also developed a catchy logo and slogan, “Don’t leave your BI decisions to chance.”
Price With business intelligence, there is the price you paid to license the Business Objects software, but there is also the price you may charge your internal users. Such pricing policies often depend in large part on what you have done in the past with reporting systems and what you do with other information systems. Many companies do not charge end users for using BusinessObjects XI. It is reflected as an indirect cost, part of corporate overhead. Some companies will charge a flat fee when a user is first granted access to BusinessObjects XI. This approach may help you manage the implementation to ensure that the people who need access the most will also pay for it. However, let’s assume
PART I
Feature
55
56
Part I:
Getting Ready for BusinessObjects XI
your company has already bought 1000 licenses. The company has already incurred the expense. Re-charging business units may help move the costs from the IT department to the business unit, but it has no material effect on company expenses. Your goal is to get the information closer to the decision-makers. You also need to recover your expenses, so you charge per trained user. This per-user fee may inadvertently cause the business unit manager to restrict the number of BusinessObjects users. Their budget is tight; they need to control expenses, no matter that it has no effect on company cash flow. The business stays stuck in the information flow of one central person running and distributing reports. The pricing strategy just caused you to fail to bring the information closer to the decision-maker. Although BusinessObjects XI allows you to create usage reports for billing, the risk with direct charges that relate to usage is that you may also inadvertently discourage usage. The more expensive it is to analyze data, the less likely users are to explore information. In determining a direct-billing approach, you need to evaluate how advanced your company is in terms of information literacy and where you want to get to. If the data warehouse or Enterprise Servers are overloaded, then charging for usage may help you recover costs to pay for increasing capacity. If the servers are underutilized, don’t charge by usage. Companies are more likely to charge users directly when the customers are external. Owens & Minor, for example, charges external customers for access to WISDOM. Here, the Web Intelligence extranet is a source of revenue and the charges indicate WISDOM has exceptional value; if Owens & Minor offered it as a free service, customers might not have appreciated its value. An insurance company told me they began charging external customers only when they moved from mainframe reports to a data warehouse. Customers balked. They had never paid for reports in the past; why should they pay now? It didn’t matter to them that they finally had more data and more flexibility than before. Nobody likes a price increase, especially if it has been forced upon them. If users had a free DSS or mainframe reports before, then don’t charge for access to fixed reports. You can deploy the reports via InfoView, granting such users interactive access to fixed reports. When users want the additional capabilities to create new reports, only then would you charge them for the new capability.
Place The “place” within your marketing mix is where you plan to deliver BusinessObjects XI capabilities or reports. Somehow the place is a seldom-considered aspect of a business intelligence project, yet it is a component of the marketing mix that greatly affects which of the vendor’s products you use or which features are important. With BI, a push approach versus a pull approach has been a pendulum in which many companies initially thought pushing reports to users was a good way to manage scalability. According to some recent surveys, though, this approach is on the decline, and allowing users self-service pull access is on the rise. I suspect this is in part a backlash against information overload. Too many pushed reports can quickly be perceived as spam. Table 4-5 lists some of the places you may deliver standard reports or interactive analysis; each of these places affects the product functionality you will teach the users as well as the interfaces you choose to deploy.
Promotion Many BI deployments focus on the product and capabilities they want to deliver and pay little attention to promotion. The project team, staffed primarily with IT people, focuses on development efforts and not on the promotion activities that should accompany an
Chapter 4:
Marketing BusinessObjects XI
Product or Functionality
E-mail to Inbox, BlackBerry, or other handheld device
InfoView, scheduled as PDF
E-mail with personalized, bursted report
Crystal Reports or Desktop Intelligence with scheduling
Corporate intranet
InfoView
Disconnected laptop computer
Desktop Intelligence offline mode, Live Office, or PDF-based reports
Remote dial-in
Web Intelligence with Citrix
Corporate extranet
InfoView or Web Intelligence HTML Report panel
TABLE 4-5 The Place for Delivering BI Affects Which Modules and Features You Deploy
implementation plan. Changing from an old reporting environment or decision-making process to a new one requires promotion. Users will go through an evolution as you promote your business intelligence solution. During the funding and development stages of the project, you want to build awareness about what is coming. You want everyone—not just the power or primary users described in Chapter 3—to have heard of BusinessObjects XI or your BI product name. As you get closer to delivering capability, you want to increase knowledge as your target user segment learns when and how to use BusinessObjects XI. The third phase of promotion is to increase usage, in which people within all levels of the organization are aware of BusinessObjects XI, know when to use it, and use it as an invaluable tool to achieve business goals. You may use different media to achieve these different promotional stages. Different user segments will be at different stages simultaneously.
When to Promote There is a comfort in waiting to promote BusinessObjects XI only when you are finished with the first phase of your BI development. If you wait until then, however, you are starting too late and it will take you longer to achieve any measurable benefits. Users must be aware of BusinessObjects XI long before they sign up for a training class. Clearly, you need to manage user expectations and not promise more functionality than what you can deliver. In early promotions, emphasize the high-level benefits, implementation waves, and broad time frames. Battered IT departments who have been criticized for being late in the past may truly cringe at this approach. I understand. I myself have cringed at seeing the changing release dates for this book on Amazon. Can’t they just wait until I’m done writing it before listing a date? However, in order to build demand and excitement, you must promote early, well before you are ready for deployment. Consider how much education Business Objects did early on about the new XI platform. High-level information and development plans were shared early in 2004, shortly after the merger with Crystal Decisions was completed. The company wanted you to be aware of what was coming. As the product went beta in summer 2005, more precise release dates and capabilities about XI Release 2 emerged so that you could start planning for migration (knowledge). With the product becoming generally available in November 2005, the company has been promoting training courses, migration strategies, and so on, all with the aim of increasing usage. As a BI professional, you don’t have to like promoting early, but you do have to do it.
PART I
Place
57
58
Part I:
Getting Ready for BusinessObjects XI
Key Messages When you promote your BI solution, develop key messages and mottos that emphasize the benefits, not just the features. The key messages you develop depends on a lot on the situation analysis. If users currently have to wait months to receive a custom report, a key message may be “information now.” If one of the goals is to retain customers, a key message may be “helping you know our customers.” If users access paper-based reports and there is a low level of computer literacy, then a key message like “good-bye paper-based reports” may cause a panic. Look to emulate some of the most effective promotional campaigns, as shown in the following table: Product
Benefit
Key Message
Ford Trucks
Rugged enough to go anywhere
“Built tough”
Dunkin Donuts
Their coffee and snacks give you energy
“America runs on Dunkin’”
Bounty Paper Towels
Clean spills fast with fewer towels
“The quicker picker upper”
Miller Lite
Drink more beer
“Tastes great, less filling”
7-Up
Clear, refreshing, different from cola
“The un-cola”
MasterCard
Using MasterCard makes you happy
“There are some things money can’t buy; for everything else, there’s MasterCard.”
Business Objects
One version of the truth that will help improve business performance
“eXtreme Insight. Trusted Platform.”
Promotional Media Choose the media according to the desired promotional frequency and target user segment. Promotion is not something you do once, but rather, it requires repetition. Do you ever see a commercial one time? No, you see and hear the same messages in magazines, on TV, and on radio. Remember, the goal with promotion is to move people from awareness of BusinessObjects XI to usage. It will take a number of repetitions, with different messages and media to get there. Recall from Chapter 3 that only a portion of BusinessObjects XI users may actually log in to InfoView; a larger majority of users may receive the benefit of BusinessObjects XI indirectly from analysts or via distributed e-mail reports. Therefore, if you use the InfoView sign-on page as your main communication medium, the message will not reach many user segments. You need several alternative media such as staff meetings, newsletters, or e-mail campaigns to reach these secondary users. Time your promotion efforts to certain project milestones. For example, if you give shirts away as project awards, have the team wear their shirts when you release a new universe or complete a software upgrade. At a recent TDWI conference that emphasized bridging the gap between IT and business, Dave Wells, Director of Education, color-coded the name badges of IT people in red and business people in blue. He declared that the BI industry needed more “purple people,” and as a way of generating awareness and excitement on this theme, people who bridged this gap wore purple shirts and badges.
Chapter 4:
Marketing BusinessObjects XI
• Video / podcasts Some companies have created videos, Webinars, or podcasts to use at road shows or staff meetings. The video may show the CEO, the project sponsor, or a business user giving a testimonial as to how BusinessObjects XI helps the business. While a video or podcast may be difficult to produce at first, it helps reduce travel costs and logistic issues in always getting the right people together. • Company newsletters Existing corporate newsletters are excellent media for highlevel messages to a broad audience. Given the readership of company newsletters, the primary purpose of these articles is to build awareness, not necessarily usage. These articles should include information about the business goals and project milestones. You do not need to get too detailed about functionality. • Industry journals Companies have a misconception that participation in user conferences and articles in industry journals help only the careers of the project staff and not necessarily the company. Not true! Owens & Minor has received a number of industry awards, something that helped create enthusiasm internally and helped them win new contracts. EMA also credits recent client wins to industry exposure. There are a number of ways to get your project into an industry journal. You can author an article. You can volunteer to be interviewed by Business Objects for a press release. Your company’s public relations department can issue a press release either to technical journals such as Computer World, DM Review, Intelligent Enterprise, and CIO Insight or, if it has more of a business slant, to industry journals. Finally, consider submitting an application for industry awards. As a judge for TDWI Best Practices, I would encourage companies to submit an application for this prestigious award. In addition to taking time to reflect on their accomplishments, award winners enjoy additional exposure and speaking opportunities. • Training classes Training sessions should go beyond the straight how-tos and address the benefits and business application of the data and of sharing information. Some companies use a game-style approach to training to generate enthusiasm. For example, one company regularly holds group workshops in which they divide the group into two teams. There is a question and answer session in which the two teams compete to share tips and best practices. • Brown-bag lunches A brown-bag lunch is a casual information sharing session in which participants bring a bagged lunch and discuss effective usage of BusinessObjects XI or the data warehouse. Cingular Wireless, for example, refers to these as “lunch and learns” and will invite the vendor technical consultant to participate. A facilitator may start the lunch with a success story, tip, or project
PART I
• Road shows When companies first start developing a business intelligence solution, many have corresponding information sessions about what is coming, when phase 1 will be available, and who will be trained first. The most successful “road shows” include business success stories and user testimonials on how BusinessObjects XI has had a measurable impact. For example, Blue Cross Blue Shield of North Carolina has an established data warehouse and BusinessObjects implementation. Even with a mature deployment, they still do two road shows a month for new groups of users. Their implementation is so successful that the project team is often now invited to speak at staff meetings to tell people about new functionality and how business units are benefiting from business intelligence.
59
60
Part I:
Getting Ready for BusinessObjects XI
update. These provide a useful follow-up to training and another opportunity to raise awareness about best practices, success stories, and benefits. In the earlier SWOT analysis, Table 4-2, one of the strengths was that the data warehouse was mature and a number of initial ETL problems had been resolved. In this same company, the data warehouse project team communicated each resolution via e-mail. Users became desensitized to repeated e-mails and no longer trusted the integrity of the data warehouse. They were convinced that if they used BusinessObjects again, they would find still more errors. It took several face-to-face discussions during brown-bag lunches and a comparison of BusinessObjects reports with ERP-based reports to acknowledge the historical problems, explain how the problems had been resolved, and motivate the power users to trust the new reporting environment. • Internal user conferences Just as Business Objects and regional user groups host periodic user conferences, do the same in your own organization. Kick off the meeting with a review of the benefits, project milestones, and a key success story. Then ask users to share tips and techniques on both the how-to of BusinessObjects XI and how it has helped them achieve business goals. • T-shirt days Many project teams give away T-shirts, sunglasses, and other promotional items to reward staff for their accomplishments. As both a motivational technique and a promotion opportunity, get the entire team to wear their giveaway on milestone dates. This works particularly well if the T-shirt is brightly colored. Seeing 50 yellow T-shirts in the company cafeteria will generate interest and curiosity about what’s new. • Intranet The Intranet and the InfoView portal may be useful for promoting to existing users and keeping them informed; however, they are poor media for secondary and potential users. Secondary and potential users do not log in to InfoView, so they will never see these messages. You can best reach these secondary users through staff meetings and company newsletters. For primary users, the intranet and InfoView home page are ideal places to repeat key messages and project goals. • Staff meetings Most departments and business units have regularly scheduled staff meetings. Ask for five minutes on the agenda each quarter to give an update on new deliverables, problem resolution, and how other departments are benefiting from BusinessObjects XI. A real sign of success is when the department invites you and requests 30 minutes!
Approaches to Training As you define your user segments, tailor the training accordingly. For report authors, you may have classroom or Web-based training; for report consumers, training may consist only of a cheat-sheet with the quick steps to refresh a report. Following are some additional things to consider in developing a training approach: • Data vs. the tool A BI tool delivers no value without the underlying data users’ wish to analyze. If you train users only on BusinessObjects XI with the sample databases, users may not be able to translate the skills to their own data sets.
Chapter 4:
Marketing BusinessObjects XI
TIP Brown-bag lunches are a good way to supplement classroom training on the tool with discussions about the data. • Internal vs. third-party Business Objects and a number of certified training partners will train end users on the software. Some will customize the training material to include your universes, reports, and data in the screen shots. You also can buy the training material from Business Objects and incorporate your own screen shots. • Training method While classroom-style training is the most traditional, it can pose a logistical challenge when users are at different sites and have busy schedules. Some users may do quite well to read a book and then supplement that with computer-based training, on their own schedule and at their own pace. BusinessObjects Knowledge Accelerator allows you to integrate your own data with computer-based training. Regardless of the formal training method, for a successful implementation you must supplement scheduled training classes with other means to share tips, techniques, and uses.
Customizing per Segment Chapter 3 defines different ways of segmenting potential users; this chapter covers developing a marketing strategy for BusinessObjects XI. Now you need to tie the two together and tailor the marketing strategy to each user segment. Table 4-6 shows three potential user segments. Table 4-7 shows how you would customize the marketing mix according to these segments.
Segment Characteristics
Accountant
VP Marketing
External Customer
Computer literacy level
High
Moderate
Unknown
Primary or secondary user
Primary
Secondary
Primary
Job level
Mid
Upper
Unknown
Analytic job component
High
Low
Unknown
Spreadsheet user
Yes
No
Unknown
Amount of travel
Minimal
High
Minimal
TABLE 4-6 Possible User Segments with Different Characteristics
PART I
However, training users on their own universes and reports may be a logistical challenge if you don’t have a sufficient number of users with common universe needs to fill a class. In these cases, you may want to offer tool training separately from data training. The bottom line is that you must do both, particularly for users who will create their own reports. Users who only refresh reports may not need data training, as in their view, there is only one meaning for an object.
61
62
Part I:
Getting Ready for BusinessObjects XI
Marketing Mix
Accountant
VP Marketing
External Customer
Product(s)
Web Intelligence, Live Office
Dashboard Manager
InfoView
Product benefits to emphasize
Access to any information, ad hoc reporting
Monitor key indicators
Manage costs
Price
Overhead cost
Overhead cost
Per-report fee
Place
Browser
BlackBerry
Browser
Promotional media
E-mail, internal user conferences
Staff meetings, corporate newsletters
Fact sheet, site visit from salesperson
Training approach
Classroom, books
Reference card
Reference card
TABLE 4-7 Customized Marketing Strategy per User Segment
Summary Applying a marketing strategy to your BusinessObjects XI implementation will help you speak the language of business users and speed your success. Marketing and promoting your efforts and accomplishments can be uncomfortable for many people, especially IT professionals. Enlist the help of your company’s internal experts. Your best promoters will be the satisfied users themselves. Engage them to share their success stories in company newsletters, industry journals, and internal user conferences.
5
CHAPTER
Under the Covers: Migrating to a New Architecture
T
he biggest change with XI Release 2 is its new architecture, although it, in some respects, is not entirely new: the XI architecture is largely based on Crystal Enterprise’s architecture. Understanding high-level aspects of the new architecture will help you adapt your support organization and better plan your migration. Business Objects provides you with utilities that will help you migrate to this new platform. This chapter provides an introduction to the new architecture, migration approaches and tasks, and the migration utilities. It is not meant to be a comprehensive guide. System engineers who must configure and optimize server processes should refer to the vendor documentation for more in-depth information. Project managers and BI experts who must plan the migration should check discussion forums, consulting partners, and vendor white papers for more up-to-date and detailed migration strategies. Also note that this book has been written using the BusinessObjects Enterprise server on a Windows Advanced Server operating system; migration tasks may be different when using other operating systems such as Unix and Linux.
File-Based Repository Business Objects was one of the first BI vendors to leverage a relational database for its metadata repository. The relational repository contained information such as universe definitions, security profiles, and corporate documents. The use of a relational database allowed for a central source of metadata that geographically dispersed users could easily access. Backups were easy, as DBAs could readily back up the database. The relational database approach also ensured the product was open, and many administrators learned to read the relational repository to manage their deployments. However, the relational repository also could be a bottleneck when binary files needed to be exported to or imported from the repository. If your company had a large universe, downloading changes to that universe, while automatic for users, could take several minutes. The same is true of publishing corporate documents. When a user published a report to Corporate Documents, the .rep file was stored as a BLOB in the relational database. When another user accessed that corporate document, the .rep file had to be extracted from the relational database and in a sense reconstructed on the file system. For large documents, this could take several
63 Copyright © 2006 by The McGraw-Hill Companies. Click here for terms of use.
64
Part I:
Getting Ready for BusinessObjects XI
minutes. The response time issues certainly affected users’ behavior, as they avoided saving data with a corporate document, sometimes for security reasons but often because of long response times. Thus, full-client documents were more often shared outside the repository on local area networks. BusinessObjects Enterprise XI continues to use a relational repository but uses the file system more extensively. In XI, the relational repository is significantly smaller. The relational database is used more as a method of maintaining pointers and relationships between universes, reports, and users. All of the universe definitions and reports are physically stored on the file system. The best thing about this approach is the performance improvement. For designers, exporting universes is pretty much instantaneous. For users, publishing and accessing corporate documents is as fast as saving them to disk. For administrators, it’s important to develop a backup strategy that includes both the relational database and the file system and to ensure those backups happen in a synchronized fashion. If your BusinessObjects 6 deployment contained multiple universe and document domains, these are now represented as separate folders within the XI repository and maintained via one Central Management Server (CMS).
NOTE So where is my BOMain.key? The BOMain.key no longer exists! In the past, administrators and users might have chosen a different .key file whenever they needed to access a different security domain defined via Supervisor. With BusinessObjects Enterprise XI, you would specify a different CMS created during the installation process or specified in the Central Configuration Manager. If you want to see where the relational repository resides, follow these steps: 1. From within Windows, launch the Central Configuration Manager by selecting Programs | BusinessObjects XI Release 2| BusinessObjects Enterprise| Central Configuration Manager. 2. Right-click the Central Management Server and choose Properties from the pop-up menu. 3. From the Properties tab, you see the database user name and password used to log in to the CMS database. 4. From the Configuration tab, you see the relational database used for the repository and auditing if enabled. In the example at right, this is a SQL Server database named BOE11. If you have a new deployment (not upgraded from XI.0), then the default database name may be BOE11.5.
Chapter 5:
Under the Covers: Migrating to a New Architecture
65
Optimized Processes
• The Central Management Server is the key component within XI, handling security and the routing of requests to other services. If the CMS is not running, then users will not be able to log in to BusinessObjects. If, however, the CMS is running but other servers are not, then users may in fact be able to log in to InfoView but will receive an error when they try to open or refresh a document. Which error appears and when depends very much on the task the user performs and which server is unavailable. • The Input File Repository Server handles the process of writing the results of Report Servers to the repository. When users access a shared report in real time, the Input File Repository Server processes the request. • The Output File Repository Server handles the process of serving requests for users accessing the results of a scheduled report, called an instance. When users schedule a report, a Job Server will send the results of the report to the Output File Repository Server, which stores the report in a compressed format. • The Connection Server provides connectivity to the data sources such as Oracle, SQL Server, and Teradata. For each end-user interface you deploy, you will have the following types of additional services. These services are optimized to process certain document types, depending upon whether they have been executed in real time or scheduled. A Job Server processes reports that have been scheduled to run. It will retrieve the definitions of the report from the Input File Repository Server, connect to a data source, execute the query, format the results, and save an instance of the report to the Output File Repository Server. Job Servers replace the functionality previously provided by the Broadcast Agent Scheduler. There is a Web Intelligence Job Server, a Desktop Intelligence Job Server, and Crystal Reports Job Server. There is also a List of Values Job Server for Crystal Reports lists of values, not for lists of values defined in universes. Report Servers process reports that are executed on demand or built ad hoc. There is a Web Intelligence Report Server, a Desktop Intelligence Report Server, and a Crystal Reports Report Server.
PART I
Another unique aspect to Crystal Enterprise’s architecture was its optimized processes and plug-and-play components. Many of these same processes in Crystal Enterprise 10 continue to exist in BusinessObjects XI. However, there are additional processes dedicated to the treatment of Web Intelligence and Desktop Intelligence tasks. Although each of these processes is called a “server,” this is conceptual only. They are not separate physical machines. Instead, they are processes potentially all running on one server or with multiple instances distributed across several machines. Figure 5-1 provides a conceptual overview of the key components in a BusinessObjects Enterprise deployment. Your deployment will vary depending on which interfaces you have purchased, if you have licensed a premium or professional addition, or if your implementation includes Dashboard Manager and Performance Management. The following services are shared across the suite. Even if you deploy only one interface, for example just Desktop Intelligence, your environment will use these services:
66
Part I:
Getting Ready for BusinessObjects XI
FIGURE 5-1 Conceptual overview of key components within the BusinessObjects Enterprise architecture
Cache Servers cache individual pages of reports for Desktop Intelligence and Crystal Reports users. When a user views a large report, the Cache Server sends a single page to the user’s browser. The Web Intelligence Report Server has caching abilities as part of that process, so you will not see a separate Web Intelligence Cache Server. If your deployment includes Crystal Reports for pixel-perfect reporting, then you will see additional server processes optimized for that report type: Crystal Reports Page Server, List of Values Job Server, Report Application Server, and Destination Job Server. Don’t let the names of some of these servers mislead you to thinking they are not available for other report types; it’s simply that the work is performed by a different server process. For example, the List of Values Job Server processes lists of values only for Crystal Reports documents; it does not process lists of values for Web Intelligence or Desktop Intelligence documents. Instead, the Web Intelligence Report Server and Desktop Intelligence Report Server handle the processing for those lists of values. Administrators may start and stop services using the Windows Central Configuration Manager, or they may use the web-based Central Management Console, shown next. In the following screenshot, services that are running are indicated with a green up arrow and stopped services have a red down arrow:
Chapter 5:
Under the Covers: Migrating to a New Architecture
67
PART I
Migration Because so much has changed with the underlying architecture, migrating from BusinessObjects version 5 or 6 to XI demands careful planning. It is not an upgrade that involves a simple copy from one version to another. XI Release 2 contains two tools that will help with migration: an Import Wizard and a Report Conversion tool. The Import Wizard allows you to • Migrate users and content from one version of the platform to XI Release 2. • Copy users and content from a development environment to a production environment. • Consolidate content from departmental BusinessObjects and Crystal implementations to an enterprise implementation. The Report Conversion tool allows you to convert full-client reports or Desktop Intelligence reports to Web Intelligence documents. Both of these tools are discussed more thoroughly later in this chapter. Your migration project should have four broad phases: planning, test, implementation, and ramp-up. The length of each phase will vary significantly, depending on the size and complexity of your existing deployment and your consolidation approach. As you plan your project, use the checklist in Table 5-1. An electronic copy of this checklist may be available on the Osborne web site and BOB. Each of the items in Table 5-1 is described more fully in the following sections.
68
Part I:
Getting Ready for BusinessObjects XI
Category
Item
Planning Phase
Understand key benefits you would like to obtain Understand and identify licensing issues Retain executive sponsorship and ensure incentives are in place Ensure Crystal and BusinessObjects administrators work together Take baseline of existing environment: FTEs to support, number of servers, defined users, active users, number of reports and universes Read documentation (particularly Chapters 5 and 13 of BusinessObjects XI: The Complete Reference) Train administrators Inventory existing reports in repository, local networks Identify shared reports that should be in repository Identify opportunities for report rationalization and conversion to Web Intelligence Develop/update security approach Develop migration approach (consolidate or not) Plan new architecture Develop training strategy Identify sample reports for benchmarking/testing (basic, complex); document current response times Assess technical architecture readiness: Java application servers, standard browsers for Web Intelligence authors Develop communication and implementation plan Identify pilot users and content
Development/ Test Phase
Install XI Release 2 software Scan and repair version 5 or 6 repository Back up version 5 or 6 repository Back up version 5 or 6 reports not in repository Plan groups and folders Test the Import Wizard for users and groups, documents, stored procedures, universes, permissions Understand and test new security Test universe connections and/or define ODBC Test sample reports and benchmark Test server load and new architecture Document new policies, procedures, support responsibilities Identify and test manual tasks Train pilot users and key support personnel Identify possible user/group overlap between Crystal and BusinessObjects environments
TABLE 5-1
Migration Planning Checklist
Lead Person
Start Date
End Date
Comments
Chapter 5:
Under the Covers: Migrating to a New Architecture
Item
Go Live
Freeze updates to old environment
Lead Person
Start Date
End Date
Comments
Train users Migrate full repository and reports Complete manual tasks Sunset old environment(s) to achieve cost savings Measure new environment: FTEs to support, servers, defined users, active users, number of reports and universes Ramp Up and Redesign
Set up external authentication Convert full-client reports to Web Intelligence Optimize and/or redesign universes Calculate ROI Promote and extend to new users Leverage new modules
TABLE 5-1
Migration Planning Checklist (continued)
Planning Your Migration The first and most important phase of your migration is the planning phase. With some IT projects, it may be acceptable to plan a little, test a little, and implement for a longer period of time. With your migration to XI, the planning phase of the project may be your bigger investment. Plan well and your migration will go more smoothly. Plan poorly and you can expect to face numerous challenges. Planning breaks down into a number of key actions, as described next.
Understand the Key Benefits You Would Like to Obtain As with any upgrade, document the justifications for the upgrade. These may include cost savings if you are consolidating environments; increased scalability from the XI platform; or new features available in XI such as Intelligent Question, collaboration, and improved auditing for Sarbanes-Oxley compliance. There is also the issue of ongoing support and maintenance for versions 5 and 6. The vendor publishes Technical Support Lifecycle plans on its web site (http://support.businessobjects.com/programs/lifecycle/default.asp) and currently plans to end technical support for version 5.1.9 at the end of 2007 and for version 6.5 in June 2008, although product patches will cease earlier. With some of these benefits, there may be licensing implications. In migrating to XI, the software upgrade is covered as part of maintenance for like-for-like functionality. However, XI has a number of modules that you may not previously have purchased. For example, Live Office and auditing capabilities are both provided as part of a Premium licensing bundle. Identify which capabilities may incur additional licensing costs, evaluate the benefits, and obtain the necessary budget.
Retain Executive Sponsorship Many times a software upgrade is performed by the IT group as part of maintaining the BI infrastructure. However, if any of the goals of your migration project include BI standardization, consolidating departmental BI implementations, or leveraging new business features of XI
PART I
Category
69
70
Part I:
Getting Ready for BusinessObjects XI
Release 2, then you need to ensure executive sponsorship before proceeding. Without this sponsorship, turf battles will impede your migration. The ability to provide additional business value is threatened.
Make Sure Crystal and BusinessObjects Administrators Work Together In many organizations, there are separate Crystal Enterprise administrators and BusinessObjects administrators. Rarely do the different administrators talk to one another. They each have their own application responsibilities and user constituents, so why compare notes? However, as business intelligence becomes a strategic, enterprise resource, these administrators will ideally work within the same BI competency center and report to the same program manager. If that is not the case in your organization today, then at least begin a dialogue with one another to understand the environments, potential for overlap, and potential for synergy. BusinessObjects administrators have a lot to learn from the Crystal experts about the architecture and security. Crystal Enterprise administrators have a lot to learn from the BusinessObjects experts about the role of the universe, interactive reporting, and dashboards. Both need to understand product positioning and to develop a strategy for which product to use in particular applications.
Take a Baseline Inventory of Your Existing Environment A baseline should include the number of full-time equivalent personnel (FTEs) to support the application and the number of servers, defined users, active users, and reports and universes. Many companies do not currently monitor active users and have not enabled auditing in their BusinessObjects environment. Even if you do not own an Auditor license, you can enable a degree of auditing on BusinessObjects version 5 or version 6 for logins that come through InfoView. This baseline is important in ensuring like-for-like performance in a version 6 and XI environment as well as understanding the cost/ benefits of your migration. If you keep the hardware and support staff constant, yet have significantly increased your content, or active users, then you have achieved a measurable benefit.
NOTE It was alarming to me to hear that some early migrators did this manually by counting items in various screens in Supervisor. Information on number of users, universes, reports, and more is readily available to you by running queries against the version 5 or version 6 repository tables. If you are not versed in the structure of these tables, use the ManagerO universe that has been available in the freeware directory in earlier versions of BusinessObjects.
Read Available Documentation A key part of any migration is to understand the areas that have the most significant changes. This includes any vendor-provided “What’s New” papers and in this book, Chapters 5 and 13. However, if you are the type to embark on hooking up the new DVD player without first reading the manual or driving to a new destination without opening a map, then ignore this step at your company’s peril.
Train Your BusinessObjects XI Administrators BusinessObjects XI administrators should attend training sessions to learn how to install, configure, optimize, and maintain the server components and security. The vendor also provides training specific to migration tasks.
Chapter 5:
Under the Covers: Migrating to a New Architecture
71
Inventory Shared Reports
TIP In addition to inventorying existing reports, be sure to clean up the repository by deleting unused documents and universes.
Identify Opportunities for Report Rationalization and Conversion to Web Intelligence This step will not be popular with full-client enthusiasts, people resistant to change, and people who hate cleaning out their closets. However, there are some significant advantages to a Web Intelligence document over a Desktop Intelligence document (discussed in the next section and in Chapter 24). As part of your migration planning, identify which documents are candidates for conversion or which documents will be left as is. As part of this planning step, you can use the Report Conversion tool to give you an estimate of the percentage of reports that will easily convert and the percentage of how many may be problematic. During this investigation stage, you may decide as part of your strategy that phase one will not include any conversion and that such conversions may happen only in a secondary phase. It’s all a question of the trade-off between cost of converting versus benefits provided. Also consider if all the reports are necessary (accessing to auditing data is certainly helpful here!). If you have ten variations of one report with slightly different sorts or filters, consider if you can reduce the number of reports.
Develop/Update Your Security Approach Security is discussed further in Chapter 13. Security in XI is much more granular than in previous releases of BusinessObjects. Now is the time to consider how granular you want the security, who will control resources, and what are the default permissions for various groups and applications.
Develop a Migration Approach and New Architecture As I consider migration approaches, I can’t help but think about pork barrel politics. You don’t want your migration effort to get so bogged down in related redesign and consolidation efforts that it drags on indefinitely, and yet to migrate without some degree of cleanup is suboptimal as well. Figure 5-2 shows a typical departmental BI deployment. Each department has a different version of BusinessObjects, with its own repository and server infrastructure. The Finance group accesses both BusinessObjects version 5 and Crystal Enterprise. User IDs and passwords are duplicated in the two repositories. As you migrate to XI Release 2, the “fastest” migration with the least political impact is to continue to treat each of these siloed implementations separately and create three XI implementations. There are no issues of
PART I
Many BusinessObjects deployments have a multitude of reports on users’ local disks and network folders. Many are not shared via Corporate Documents. It is possible to implement XI while leaving all these reports where they are. However, once an XI user saves the document or publishes it to the repository, it is converted to the latest release and version 6 users will no longer be able to open the report. If these documents are not being backed up on a regular basis, now would be a good time to do so. With XI, the concept of “Corporate Documents” is much more flexible. Folders (see Chapter 13) provide a powerful, secure way for users to share reports. As part of your migration planning, you want to inventory the reports stored in the repository, but also, understand the extent that reports are shared elsewhere. As part of this inventory, you may determine that a number of reports that were not in your 6.5 repository should indeed be shared via folders in the XI repository.
72
Part I:
Getting Ready for BusinessObjects XI
FIGURE 5-2 Simple migration approach with departmental BI implementations
overlapping user IDs and group definitions. However, you have done nothing to reduce your cost of ownership or to provide users with one source for all their BI content. Finance users still have to log in to two different InfoView portals. With this approach, your goal is to implement XI quickly and treat any cleanup, redesign, or consolidation efforts as a separate project. Figure 5-3 shows an alternative approach to migration during which you consolidate the departmental implementations into one common XI implementation. You may externalize user authentication or continue to use BusinessObjects Enterprise’s own authentication mechanism. Here, a Finance user is defined once. From a scalability perspective, you may choose to have the individual Report Servers (Web Intelligence Report Server, Desktop Intelligence Report Server, Crystal Report Server) run on separate physical machines; however, they are all controlled through one common CMS. With this approach, users access all BI content via a common InfoView. Clearly, the approach in Figure 5-3 may offer the lowest cost of ownership for IT to administer. However, it requires a greater degree of coordination and planning and executive sponsorship. Importing rights for users who may have had different user IDs or replicated user IDs in previously departmental solutions will require some manual intervention. Consolidation is also initially more disruptive to users and support personnel. This disruption has to be weighed against the benefit of providing one common BI repository at a lower cost (although the end users may never see the BI support costs).
Chapter 5:
Under the Covers: Migrating to a New Architecture
73
PART I
FIGURE 5-3
Migration and consolidation approach with enterprise-wide BI implementation
The best approach for any company is dependent upon the organization, available resources, and desired timeline. Even if you start by moving onto XI “as is” with separate server environments per department (Figure 5-2), do plan architecturally and organizationally for eventually consolidating environments (Figure 5-3) within a defined time period. With some of the changes to the BusinessObjects Enterprise server architecture, you may also want to re-architect your deployment to distribute components across multiple servers. How you architect development/test/production environments also requires consideration (some options are discussed in Chapter 15). The change in architecture is one aspect of the migration, the opportunity to “clean up” is another. With many initial BusinessObjects deployments, companies built huge universes not adequately aligned with the user needs. Users built powerful reports with way too many calculations that could have been defined in the universe to ensure one version of the truth and re-usability. The BusinessObjects XI universe has also evolved with features such as keys (see Chapter 9) and derived tables (see Chapter 11) that, when used appropriately, allow for a more scalable system that better leverages the power of the database. As part of your migration to XI, plan for some redesign time but perhaps in a secondary phase once you have reached steady state on the new platform. Failure to optimize universes and reports prior to increasing your deployment carries bad practices forward and may make it increasingly difficult to fix past problems.
74
Part I:
Getting Ready for BusinessObjects XI
NOTE Here too, you want to know how many users will be affected by any redesign efforts. Know how many users access any given universe. Ensure that your migration plan minimizes user disruption. In some cases, it may be wise to leave a poorly designed universe “as is” and provide an enhanced one separately.
Develop a Training Strategy As discussed in Chapter 4, training should be differentiated for the different types of users. So too should XI migration training. Report consumers who had already been trained on InfoView, for example, may only need an e-mail about new login procedures and a few highlights of what’s new. Power users, on the other hand, may need web-based or classroom training or workshops that discuss the most significant changes. Training is not only determined by the type of BI user but also by your migration strategy. If you migrate to XI without consolidating environments or converting reports, less training may be necessary in the early phases of your implementation but more will be necessary as the users want to leverage some of the new capabilities.
Identify Sample Reports for Benchmarking/Testing As with any major upgrade, it’s recommended to establish a baseline for current response times to more easily diagnose and pinpoint problem areas. Identify some use cases and ensure you have documented response times. This may include times for certain tasks such as logging in and refreshing a simple report, accessing a corporate document with data, executing a complex report with complex SQL, executing a highly formatted report with a complex layout, and so on.
Assess Technical Architecture Readiness If your current deployment is based primarily on BusinessObjects two-tier or client/server architecture, evaluate your intranet environment. While BusinessObjects offers an ASP interface that uses Windows as the application server, this lacks some of the interactive reporting capabilities for report consumers. The JSP interface provides report consumers with features such as sort and filter within a zero footprint browser, but to leverage this, your deployment must contain Java application servers. For Web Intelligence report authors and power users, you must ensure standard browsers to run Java applets.
Develop a Communication and Implementation Plan As discussed in Chapter 4, part of a BI implementation is not just implementing the software but also helping users understand how to better leverage it and promoting its effective use. With an XI migration, you need to develop a similar communication strategy so that users know what will be changed, why, and when. Tied to your communication plan is an implementation plan with the number of users added in phases. Your implementation may be phased by department, user group, or universes. Your approach will be influenced by how your BusinessObjects deployment was organized in the past. As you further test the environment, this implementation plan should be fine-tuned. As part of your implementation plan, I recommend you adopt a strategy of reaching “steady state” before leveraging the new capabilities in XI.
Identify Pilot Users and Content As you prepare for your migration, identify which users will be part of the pilot. You may choose to select users of different profiles (power user, report consumer) from several
Chapter 5:
Under the Covers: Migrating to a New Architecture
Testing the New Environment After thoroughly planning for your migration, you are now, finally, ready to get your hands dirty and start working with the software. I know: you may want to skip the planning and start working with all this cool stuff first. Indeed, evaluating XI before you initiate a project is one way to approach the migration. Arguably, a degree of evaluation time will better help you plan for your migration. But be very careful not to let your “controlled” evaluation evolve into a departmental implementation. There are a couple of areas in which you very quickly can impact some production users. The first of these is when you attempt to import or access reports.
Copy or Back Up the Version 5 or 6 Repository During the XI Release 2 beta, when you used the Import Wizard to import reports, universes, or users to the XI repository, the Import Wizard updated the older repository to version 6.5. Certain tools, such as Designer, would then no longer be able to log in to the old repository. This practice changed in the production version, yet I still recommend that in testing the migration tools, you make a copy of the repository and generate a BOMain.key that points to the copied database. As part of your routine maintenance in version 6 or 7, you should be running a repository repair or compact on a periodic basis. If not, now is a good time to do so to delete any extraneous records from the repository tables.
NOTE When using the Import Wizard, you will point the Import Wizard to the copy of the repository, thus ensuring production users are not affected.
Back Up Version 5/6 Reports When you publish a version 5 or 6 full-client report to the XI repository, Desktop Intelligence converts it to XI format. It is still a .rep file, but it can no longer be opened by an older version of BusinessObjects. Users will receive an error message that the file is corrupt. When you are still in the test phase, you do not want to render your existing full-client documents unusable to production users. Therefore, I recommend making a separate copy of any .rep documents that you may want to export to the XI repository.
C AUTION Do not export a version 5 or 6 .rep file to the XI repository without first making a copy. If you skip this step, BusinessObjects full-client users may no longer be able to open their reports.
Plan Groups and Folders This topic and its importance are discussed in Chapter 13. It has a profound impact on how you structure security and on what security you import from your old repository. In version 6, access to individual documents had to be explicitly enabled or disabled. With XI, documents can be stored within folders, allowing administrators to control access at group and folder levels. This provides much more flexibility. You may then choose not to import what was a highly complex security scheme from your version 6 repository, but instead, to simplify the security in XI through groups and folders.
PART I
business units, or using Figure 5-2 as an example, you may select just one department and subject area. This is a pilot and needs to be carefully controlled: you do not want to have to import a large number of user definitions, universes, and reports multiple times. The purpose of the pilot is to verify functionality, to check software configuration, and to understand what procedures and policies need to be modified.
75
76
Part I:
Getting Ready for BusinessObjects XI
Test the Import Wizard for Users, Groups, Documents, Stored Procedures, Universes, and Permissions The Import Wizard provides many options for importing content from previous versions of BusinessObjects and Crystal Enterprise to XI. During this test phase, you want to understand what gets imported and to where, what is the impact of merging environments, what is the impact of enforcing rights fidelity, and various other options. As part of your testing, plan to do the import multiple times and in multiple ways. The Import Wizard is very flexible, and you will find that doing an import of everything as it was may not be optimal.
NOTE You will want to test the Import Wizard multiple times, trying to import different content each time. Plan to spend days on this, not minutes or hours. This is not because the Import Wizard is particularly difficult but because you have different options as to how and what you import. The impact of certain settings is not immediately apparent until you also have a good understanding of the new security as well. Also, if you do not run a scan, compact, and repair as part of your routine repository maintenance, I recommend doing so before using the Import Wizard.
Understand and Test New Security Security in XI is much more granular than in earlier versions of BusinessObjects and leverages the Crystal Enterprise security model. This is discussed in Chapter 13. As part of the import process, importing users and groups is fairly straightforward. However, importing the associated permissions to documents and universes requires a greater understanding of the new options in XI Release 2. If you have poorly defined security in your version 5 or 6, you do not want to import it; instead, you will find it faster to redefine permissions at the group and folder levels.
NOTE Through several client and vendor conversations (and lively debates with the book’s technical editors), I understand that the vendor does not officially recommend migrating security from older BusinessObjects deployments to XI. However, I think this recommendation is not so black and white and is highly dependent upon what you are trying to migrate and the effort involved in migrating versus rebuilding. Migrating user IDs, passwords, and universe permissions is straightforward and something I would recommend. Migrating profiles and complex permissions to individual Corporate Documents is significantly messier and something I would recommend to rebuild in the new environment. In any migration, evaluate your existing security and test the Import Wizard with multiple options.
Test Universe Connections and/or Define ODBC When you import a universe, the connection gets imported as well. However, if you use ODBC for certain connections, the system administrator must ensure that these same ODBC connections exist on the machine(s) running XI.
Test Sample Reports and Benchmarks Assuming you took a baseline measurement of sample reports and use cases in your planning phase, you can now compare the performance improvements in XI.
Test Server Load and New Architecture If you have re-architected departmental implementations to an enterprise implementation, run test scripts to understand the maximum load in the new environment for simultaneous
Chapter 5:
Under the Covers: Migrating to a New Architecture
77
logins, report viewing, query execution, and so on. Third-party tools such as Mercury LoadRunner can help you test server performance. Given all the changes in the XI architecture, you will need to document and update a number of policies, procedures, and support responsibilities: • Backup of relational repository and file-based repository With earlier versions of BusinessObjects, your DBA backed up the repository that contained the universe and corporate documents. With the new XI architecture, the backup of the relational repository and the file-based portion must be synchronized. • Moving items from test to production How best to set up development, test, and production environments in earlier versions of BusinessObjects was widely debated, a debate that most likely will continue in BusinessObjects XI. You can use folders and copy items, or you can install a separate CMS and use the Import Wizard to create BIAR files (see Chapter 15). The important thing here is that your existing procedures will need modification. • Save to Corporate Documents With earlier versions of BusinessObjects, there was one area to share common reports within InfoView: Corporate Documents. This area was often tightly controlled by BusinessObjects administrators. In XI, you can have multiple folders. This flexibility will force you to re-evaluate who should be able to publish content to shared folders. • Prepare support staff Ensure support staff know what is coming and that they understand changes in responsibilities and procedures, new error messages, known problems, and migration plans.
Identify and Document Remaining Manual Tasks While the Import Wizard will help you migrate a number of items within the BusinessObjects environment, there are a couple of things that you must define manually. As the Import Wizard is updated with subsequent service packs, check the vendor support site for remaining manual tasks. At the time of this writing, these tasks include • Broadcast Agent schedules Reports that were scheduled via Broadcast Agent Scheduler must be rescheduled. Calendars are new in XI Release 2 and require additional definitions. Web Intelligence reports that use the OpenDocument function are imported into the new repository, but the links need to be redefined as the file paths will have changed. • Train pilot users and key support personnel You planned an approach for training your pilot users; now you are ready to train them to begin using XI in a test environment. Ensure that key support personnel are part of the first wave of trained users.
Handle Consolidation Tasks If you are also doing consolidation as part of your migration, be sure to identify possible user/group overlap between previously separate Crystal and BusinessObjects environments. Identify which user IDs and group names may have existed in multiple systems. For example, in Figure 5-2, the Finance group exists in both Crystal Enterprise and in BusinessObjects 5. Importing duplicate groups and users requires additional review of the merged rights.
PART I
Document New Policies, Procedures, and Support Responsibilities
78
Part I:
Getting Ready for BusinessObjects XI
Implementation Phase: Going Live with Your BusinessObjects XI Migration You’ve planned your migration, you’ve tested the new platform; now you are ready to implement BusinessObjects XI and go live with your migration.
Freeze Updates to the Old Environment Ideally, you will freeze any updates to any environments for BusinessObjects version 5 or 6. You may still run and support these environments, but if you can limit changes to universes and changes to corporate documents, you will not need to migrate the same content into XI more than once.
Migrate Full Repository and Reports In the test phase, you may have imported only certain BI content into the XI repository. At this point, you import all users, groups (depending on external authentication approach and decision to migrate security or not), universes and their connections, stored procedures, and reports. Re-organize the reports to ensure that you are leveraging the new folder structure. Review the security settings and permissions to ensure that document access is defined at the group and folder levels.
Train Users Depending on your migration strategy, you may migrate users to the new environment in phases according to department, groups, or subject area. Ensure you have an appropriate training plan and capabilities in place. Not all users will need to attend classroom training. Some may prefer to learn by doing; others may want to learn by workshops or Webinars. Plan classroom training for experts and power users.
Attain Steady State Once all users have been granted access to the new environment and you have reached a level of stability in which users can perform the same tasks as in the old environment, you can plan to do the following: • Sunset old environment(s) to achieve cost savings Sunset the old server environment in phases, first by disabling logins, and then by shutting down the server. • Measure the new environment If one of your goals to migrating to XI is to reduce the cost of ownership for your BI environment, measure the new costs post-migration. Include FTEs to support the environment, hardware, and software. However, a BI environment rarely stays at the same level, so be careful to consider the costs relative to the number of active users, capabilities deployed, and applications. Assuming you have the appropriate Premium licensing, Auditing is enabled by default in XI Release 2. Regularly monitor activity levels and response time in the new environment.
Ramp Up and Redesign You’ve reached steady state, now ramp up: add more users, leverage new features, and add new modules. Be sure to • Promote the availability of the new platform, intended benefits, and access to new users.
Chapter 5:
Under the Covers: Migrating to a New Architecture
79
• Evaluate which new capabilities you will use: Collaboration, Encyclopedia, Intelligent Question, Process Tracker, Dashboard Manager, Live Office, and so on.
• Set up external authentication To ensure that users have a consistent user ID and password across your corporate applications, set up external authentication as part of the XI environment. • Optimize universes Ensure universes are aligned with business users’ needs rather than the physical design of the data warehouse or source system, provide advanced objects that may previously had been created as individual report variables, and evaluate when to use new features such as derived tables and keys to provide better query performance. • Convert full-client reports to Web Intelligence Web Intelligence in XI Release 2 has many new features that previously only existed in the full client. For companies that have been waiting for more power in the thin client, you now have the opportunity to convert these full-client reports to Web Intelligence and still have powerful authoring capabilities.
Import Wizard The Import Wizard is a utility that allows you to import repository content from earlier versions of BusinessObjects or Crystal Enterprise to XI. It is a desktop application and requires connectivity to both the old repository and the new repository. The wizard allows you to import everything from a repository or to select components of a repository such as users and groups, universes, documents, and stored procedures. As you import this content, you can merge the content (important if you are consolidating environments) or have the wizard append identifiers to determine from where the content was imported.
C AUTION In earlier versions of BusinessObjects, it was an accepted practice for designers to copy universes via the file system and export the universe to relevant repositories. In XI, permissions are associated with a universe. In XI Release 1, sharing universe files outside the repository could render the universe inaccessible. This problem seems to be corrected in XI Release 2 as long as designers use the check box Save For All Users. However, when migrating universes from earlier versions of BusinessObjects to BusinessObjects XI, it is recommended to use the Import Wizard.
NOTE Before using the Import Wizard, ensure you have run a Repair and Compact on the old repository to delete any extraneous records in the repository tables. Also make a backup of the older repository database.
PART I
You may do some redesign as part of your migration, but I would advocate deferring such changes until after your initial wave of migration has reached a steady state on the new platform. Minimizing the number of changes can help you more easily pinpoint the root cause of a problem: is that query slower because of the new Connection Server or because you changed the universe? At the same time, you want to timebox the number of disruptions to users. You do not want users to feel they just went through a set of changes related to migration and then have to endure another set of disruptions as you optimize. In this regard, redesign should be planned for but done only after you have reached a stable environment on the new platform. Possible redesign tasks include the following:
80
Part I:
Getting Ready for BusinessObjects XI
In the following example, you will use the Import Wizard to import users and groups: 1. From Windows, select Start | Programs | BusinessObjects XI Release 2 | BusinessObjects Enterprise | Import Wizard. 2. At the Welcome Screen, click Next. 3. Specify the repository from which you want to import content. Under Source, use the drop-down menu to select the appropriate version. The required information will change, depending on the version of the source repository. In the following example, you are importing from a version 6.1 repository. For User Name, enter the General Administrator user name and password. Specify the network path for the BOMain.key. Click Next.
NOTE For step 3 to work correctly, you must have a connection to the version 6 or earlier repository. Depending upon which database you used for this repository, you may need to make an ODBC connection on the computer on which you are using the Import Wizard. 4. The wizard will display a warning informing you of which content it can import. Unfortunately, it does not tell you what content it will not import. Click Next. 5. Specify the XI repository that you want to import to. Enter the name of the Central Management Server as well as the administrator’s user name and password. Click Next.
Chapter 5:
Under the Covers: Migrating to a New Architecture
7. When importing users and groups, you are also prompted to choose a security option. If you wish to preserve the security from the source repository, select Yes. If you only want to import the user names and group assignments but not the associated permissions, choose No. 8. The wizard asks you if you wish to enforce rights fidelity. If you want the rights in the source environment to be identical to those in the destination environment, then check this box. However, if you are consolidating environments or if you are importing objects selectively, then do not check this box, as you will want rights from multiple sources to be merged.
PART I
6. Specify the object(s) that you wish to import. As discussed elsewhere in this book, the term “object” here refers to any BI content, not to be confused with universe objects. By default all objects are selected. If you are testing the wizard and only want to import objects selectively, be sure that you have not inadvertently left any undesired objects checked. In this example, you are importing users and their group associations. If you only import corporate documents or universes and you want the rights associated with those documents and universes also imported, then you must also select users and groups. If you select users and groups, the wizard will later ask you to select which users and groups. If you select corporate documents, the wizard will later ask you to select document domains and individual documents. If you select universes, then all universes from multiple domains will be imported. This is one import option in which you will not later have the option to further narrow your selection.
81
82
Part I:
Getting Ready for BusinessObjects XI
9. The wizard asks you to choose an import scenario. Which scenarios are available to you will depend on whether or not you specified to enforce rights fidelity or to merge rights. You can either merge content or have objects renamed if they already exist in the destination system.
10. Depending on which objects you have selected to import, you may be prompted to further select elements. In this example, you selected users and groups. The wizard further prompts you to choose which users and groups. Figure 5-4 shows how the root or top level of the BusinessObjects 6.x repository (Plastics Express) becomes a group in XI. The left image shows the users and groups as they appear in Supervisor in version 6.1. The right screen shows the groups as they will be imported into the CMS. In this example, select the group Finance and click Next. 11. If you are importing users, the wizard will ask you if you wish to create database credentials for these users. If any of your universe connections want to use the BusinessObjects user ID and password as the same login for the data source, select the option “Yes, use the BusinessObjects account name . . . ” and click Next.
Chapter 5:
Under the Covers: Migrating to a New Architecture
83
PART I
12. The wizard will provide a summary of the elements you intend to import. If these settings appear correct, click Finish to begin the actual import. If your selections appear incorrect, click Back to modify your selections.
84
Part I:
Getting Ready for BusinessObjects XI
The root level in 6.x becomes a group in XI
FIGURE 5-4 Users and groups imported from a 6.5 repository into BusinessObjects XI
13. A thermometer will show you the progress of the import as it reads data from the old repository and copies it to the XI CMS. Once the wizard has completed the import, it displays a status of any warnings or errors. Warnings are informational; errors mean the item could not be imported. To investigate a warning, highlight the item from the list and click View Detail Log. In the following example, there is a warning for the group Finance:
14. Within the detail log, scroll to the element with the warning. The following warning indicates that the group Finance already existed in the CMS. Because you chose to merge the rights in step 8, the Finance group from the 6.5 repository was not recreated, but rather users that existed in the Finance group in 6.5 have been added to the Finance group that already existed in XI. 15. Click OK to close the log and Done to close the wizard.
Chapter 5:
Under the Covers: Migrating to a New Architecture
Report Conversion BusinessObjects began as a client/server application in which reports were authored in a Windows-based interface. In version 5, you may have published these full-client reports to Corporate Documents for other users to access them via a browser via the InfoView portal. Prior to version 6, Web Intelligence was quite limited in its capabilities as a web-based query and reporting tool. It lacked the rich report layout, complex queries, and advanced charting that existed in the BusinessObjects full client. Version 6 of Web Intelligence closed some of this disparity, and Web Intelligence XI Release 2 closes it even further. Lack of synchronized multiple data providers in the full client was one of the most often cited reasons for not using Web Intelligence. Web Intelligence XI Release 2 now has this capability. As well, the number of formula functions to create report-based calculations (see Chapter 22) is roughly double that of previous versions of Web Intelligence. There are a number of additional benefits that a Web Intelligence document provides to end users over a Desktop Intelligence document, including: • Greater scalability • The ability to drill, filter, sort, and format a report from a zero-footprint browser with a simple right mouse click • A context panel with help text and data lineage for individual objects that provide business users with essential metadata One capability, however, that the Desktop Intelligence document continues to provide that is not available in Web Intelligence is disconnected analysis. End users can take a report with them and continue to access and analyze the data. The vendor plans to release an offline viewer for Web Intelligence in the near future. For a table comparing capabilities in the different interfaces, see Table 24-1 in Chapter 24. For reports that you know only need to be accessed by InfoView users, Business Objects provides a report conversion utility that converts full-client documents to Web Intelligence documents.
NOTE The use of this conversion utility is an entirely optional part of your migration. You can run full-client reports without modification in XI Release 2. Converting full-client reports to Web Intelligence reports is recommended only when there are certain Web-based capabilities you want users to be able to access. Expect the Report Migration tool to continue to be enhanced. The fact, for example, that there is a Free Hand SQL tab in the tool but that documents with this type of data provider do not convert suggests to me that the vendor has additional plans for improvement. However, for the initial version released with XI Release 2, according to Business Objects Product Management, if your document contains the following capabilities, the reports will not
PART I
Once you have imported users, groups, documents, universes, and connections into the XI repository, test the various elements. Refer to Chapter 13 to understand how security settings in earlier versions of BusinessObjects are translated in XI.
85
86
Part I:
Getting Ready for BusinessObjects XI
convert, as these capabilities do not exist in Web Intelligence, or they exist but involve capabilities that require reports to be rebuilt manually: • Personal data providers • Free-hand SQL • Stored procedures • OLAP data provider • VBA data provider • XML data provider • Query on query • Query filter based on calculation • @script() function • User-defined universe objects (not be confused with user-defined report-based variables) If your full-client document contains the following capabilities, then the report will partially convert but then may need additional manual modification: • VBA macros • OLE objects/pictures • Hide object • Value-based breaks • Breaks on multiple dimensions • Complex report filters that use formulas in the filter • Series in charts • Multicube() function • Fold/unfold • User-defined hierarchies In order to use the utility, the document must exist in the XI repository. It does not convert .rep files that exist on local or network drives. To launch the BusinessObjects to Web Intelligence Conversion tool: 1. From Windows, select Start | Programs | BusinessObjects XI Release 2 | BusinessObjects Enterprise | Report Conversion Tool. 2. When prompted, log in to the XI repository that contains the full-client documents you wish to convert. 3. You can choose to perform the actual conversion or to preview which reports will convert successfully or not. To preview the conversion, choose Create An Audit Report Only. To perform the actual conversion, choose Convert And Publish Reports and then click Next.
Chapter 5:
Under the Covers: Migrating to a New Architecture
87
PART I
4. The tool displays a list of folders in the repository. To see just the full-client documents, check the box Show Reports Not Yet Converted. Folders that contain full-client documents appear in bold, with a count of the number of .rep files.
5. Highlight the reports you wish to convert and click Add so that they appear on the right under the column “.rep documents selected for conversion.” If the documents also contain data, leave the Convert Data check box checked. If, however, your documents contain only query and layout information, and users must refresh the document upon opening it, then leave this box unchecked.
88
Part I:
Getting Ready for BusinessObjects XI
TIP Converting documents without data will be faster. You need to consider the impact of rerunning queries for however many reports you will be converting compared to slower conversion of reports that contain data. 6. Once you have selected the documents, click Start Conversion to begin the conversion process.
7. The utility will provide a status reports of which documents were successfully converted, partially converted, or failed. Select Close to close the summary list and see a detailed explanation of each report conversion. 8. From the Conversion Results panel, there is a tab for each type of conversion: successful, partial, or failed. Use these tabs to understand why a conversion may not have worked or to identify manual tasks for partial conversions.
9. For successful and partial conversions, you can proceed to publish the newly created Web Intelligence documents to the repository. Click Next.
Chapter 5:
Under the Covers: Migrating to a New Architecture
11. When you are satisfied with the settings for which reports to publish, click Publish.
NOTE If you click Next without first clicking Publish, your reports will not be converted to Web Intelligence. 12. The utility will provide you with a status list of converted and successfully published reports. Once you have previewed the list of reports, select Close. 13. You will be prompted whether to display an audit report of the conversion process or not. Click Next and then Finish to close the Conversion tool. Once you have converted the desired reports, preview the converted reports within Web Intelligence and fine-tune the appropriate layout or query definitions.
Summary Migrating to XI involves much more than a software upgrade. To properly leverage the capabilities of an integrated architecture, consider consolidating and merging previously disparate implementations. To do this requires careful planning and organizational readiness. When there is no central BI competency center or when each implementation is departmentally controlled, you may want to migrate separate Crystal or BusinessObjects 6.x environments to separate XI server environments as a way of more rapidly moving to XI and gaining an understanding of key changes. Do realize, though, that this strategy may
PART I
10. Choose the target folder for each report and click Next. In the following example, the .rep files and .wid files will remain in the same folder that they were originally imported from: Document. Note that the folder name, Document, was automatically created by the Import Wizard as the name of the Document Domain from the version 6 repository.
89
90
Part I:
Getting Ready for BusinessObjects XI
help you move onto the XI platform faster in the short term but does not help you realize the longer-term lower cost of ownership. Nor does it provide your users with one source for BI content. Thus, even if this is your short-term migration strategy, you should ideally plan for a consolidated environment in the long term, with the appropriate organizational support, security, and folder structure. BusinessObjects XI Release 2 provides two utilities that help you migrate to the new platform: an Import Wizard to migrate repository content and a report conversion utility to convert full-client reports to Web Intelligence documents. The report conversion utility is optional and only required if you want to convert existing Desktop Intelligence reports to the thinner-client Web Intelligence format.
II
PART
A Better Universe
CHAPTER 6 Universe Design Principles CHAPTER 7 Using Designer to Build a Basic Universe CHAPTER 8 Universe Joins CHAPTER 9 Classes and Objects CHAPTER 10 List of Values CHAPTER 11 Advanced Objects CHAPTER 12 Multidimensional Analysis CHAPTER 13 Securing the Data CHAPTER 14 Design Principles: Where to Put the Intelligence CHAPTER 15 Minimizing Universe Maintenance CHAPTER 16 Getting Ready for Production
Copyright © 2006 by The McGraw-Hill Companies. Click here for terms of use.
This page intentionally left blank
6
CHAPTER
Universe Design Principles
W
eb Intelligence and Desktop Intelligence are a powerful ad hoc reporting and analysis tools. The single greatest component of either tool that will make your implementation succeed or fail is the universe. A universe is a business representation of your data warehouse or transaction database. It shields users from the underlying complexities of the database schema. Business Objects often refers to this as its patented semantic or metadata layer. In all your development efforts, you must stay focused on that purpose: business representation. If your universe becomes a glorified entity-relationship model, your project will fail. If your universe includes every data element any user may possibly want from now to eternity, your project will fail. Universes can become unwieldy for end users. Poorly defined joins will result in unnecessarily slow queries. The universe is the most important component to get right. This chapter discusses concepts that will help you build a better universe and core universe components.
Keep It Simple I have seen universes that include thousands of objects and every table in the data warehouse. Such universes are difficult and, more important, are overwhelming for even expert users. The result? End users create invalid queries and blame the tool for bad data. With such an overwhelming interface, users feel safer exporting the data to spreadsheets or MS Access databases, thus creating multiple versions of the truth and causing unnecessary data reconciliation. To build a successful universe, keep it simple. The universe should be useful for a clearly defined group of users and should not have much more than 200 objects in it. Are there welldefined universes with more than 200 objects? Yes, but the target user group is much more sophisticated in their knowledge of both the data and the tool. The ideal number of universe objects will vary from organization to organization. Keep in mind that bigger universes are technically feasible but not user friendly. Having more universes to build and maintain may result in slightly higher maintenance costs but will significantly increase end-user productivity and satisfaction. As your target user group expands, constantly ask yourself if the needs are distinct enough to justify a separate universe. If some users need only a handful of additional objects, keep them in the same universe. However, if they need many additional objects, create a separate universe.
93 Copyright © 2006 by The McGraw-Hill Companies. Click here for terms of use.
94
Part II:
A Better Universe
Figure 6-1 illustrates how different user groups will need access to different information. Human resources is one group of users that needs access to salary details but does not need product sales and order information. Therefore, a Salary universe will have information from only this one fact table. Marketing people may need information on sales but will rarely need information on the individual order numbers that customer service representatives need; however, customer service representatives need both order details and sales summaries. This is an example in which it may make sense to have one universe that meets the needs of both user groups (marketing and customer service representatives). A director of the marketing group is most likely a people manager and may need salary and employee details; the director would use two universes, as including three subject areas in one big universe would potentially be overwhelming for the majority of users who don’t need this information.
Technical Realities Keeping it simple is the most important aspect of designing a universe. However, there are some technical issues that may challenge this design principle. In earlier versions of Web Intelligence, each document could contain queries from only one universe. As a workaround to this limitation, designers would build bigger and bigger universes to ensure all possible business questions could be answered. With XI Release 2, this limitation has been removed as Web Intelligence now supports multiple synchronized data providers. Another argument for a bigger universe is response time related, particularly with lists of values. Assume, for example, that the object Product ID is used in each universe. As there are thousands of products, this is a customized list of value so that users are first prompted to filter their pick list according to a product grouping. This pick list is refreshed and maintained for each universe, so it can be rather user-unfriendly to have to wait for a pick list to be generated for each universe. The answer, of course, is faster pick lists or, better yet, common
FIGURE 6-1 A universe is a business representation of the database based on the needs of target user groups.
Chapter 6:
Universe Design Principles
95
pick lists that can be shared across universes. List of values caching on the Enterprise server has improved response time for pick lists. For reusable pick lists, consider creating a linked universe (see Chapter 15) that contains common dimensions. In earlier versions of BusinessObjects, customized pick lists were not shared with linked universes. In XI, the definitions for the customization are shared but the resulting pick lists are not.
Align with Business Goals
Existing Data Warehouse Just because information is in the data warehouse or data mart, that doesn’t mean it needs to be in the universe. For example, data warehouses may contain dimension histories seldom used by end users. Likewise, data warehouses may contain only raw data elements that require a bit more intelligence in the universe. Likewise, just because users haven’t specifically asked for something in a JAD session, that doesn’t mean it shouldn’t be in the universe. As an example, let’s assume your company has a goal for on-time delivery performance. REQUESTED_DELIVERY_DATE and SHIP_DATE may be columns in an ORDER_FACT table. In evaluating how this universe is aligned with the company’s business goals, a good universe designer will know to add an object called Days Late that calculates the difference between the requested delivery date and actual ship date. Users may not know what SQL functionality can be added to database columns. A universe designer must be well versed in SQL reporting capabilities that can make the universe more robust. Herein lies one of the greatest challenges in designing a good universe: you must know both the business and SQL. SQL-certified experts may be proficient in creating tables, optimizing indexes, and loading volumes of data quite efficiently. This is not to say they know how to extract that same data into a report that provides business insight. This mixed skill set can be a challenge in identifying the best universe designer in a company (refer to Chapter 3 for a discussion on project roles). It’s often a DBA who has the SQL technical skills. A universe designed by a DBA with little knowledge of the business may be technically robust but lack the business functionality required. Universes designed by power users trained in SQL may have more robust business functionality, but with suboptimal joins or objects that result in slow queries. Therefore, it’s important that both a DBA and a power user jointly develop and review a universe.
New Data Warehouse If you are building a new data warehouse or data mart in conjunction with your BusinessObjects XI implementation, ideally your development efforts are already driven by business goals. Requirements gathering in the development stage will drive the fact table design as well as the universe design. As discussed in Chapter 14, many of the issues at this stage will be where to put the intelligence—in the fact table or in the universe.
PART II
As discussed in Chapter 2, a data warehouse or business intelligence deployment should be carefully aligned with business goals. As you develop a universe, compare how this universe helps achieve the business goals. Sometimes, companies build new reporting solutions simply because the data is available or because a certain report always existed. However, old reports may no longer be meaningful in today’s business climate. The process of determining universe requirements will vary depending on whether your implementation is based on an existing data warehouse, a new data warehouse developed in conjunction with a BusinessObjects XI implementation, or a transaction system.
96
Part II:
A Better Universe
Transaction System When your universe is based on a transaction system, some of your universe design choices will depend not only on the business goals and user requirements, but also on minimizing the impact on the source system. While users may want to search on customer name, a nonindexed field, such queries can cripple the source system (thus many organizations implement a data mart or data warehouse). If your company is not quite ready for a data warehouse, a quick alternative is to replicate the tables in the transaction system to a read-only instance of a database. This will better support detailed operational reporting requirements, without adversely affecting transaction processing. Even with this approach, a good designer needs to evaluate which business goals the universe is fulfilling. To follow on our supply chain example, customer phone numbers and contact details exist in the transaction system. This information is necessary for processing orders but useless for measuring on-time shipments. (If you are building a customer support system, then perhaps you need these details.) In building a user-friendly universe, the designer must constantly evaluate objects that fall into the category of “I might need it one day.” In an initial universe, defer adding the object to the universe. Deployments against a transaction system generally fulfill the operational needs of a company but not the strategic goals of the business, as the data is not aggregated. If the goal of the deployment is to provide a Windows- or Web-based, flexible, operational reporting environment, then your universe may indeed re-create fixed reports that exist in the source system. Another benefit of this approach is that the OLTP truly becomes the data entry/ processing system, without detailed queries slowing down data inputs.
TIP As a way of ensuring your universe is fulfilling the business requirements, use the integrated auditing capabilities to monitor which universes and individual objects are most frequently used and which ones are never used. See Chapter 16 for more information on usage monitoring available through the Auditor product.
Evolving the Universe For designers used to a waterfall development approach, welcome to the realities of business intelligence: it’s all iterative! The universe is never finished. Your first universe is version 1, which will evolve as you elicit user input, the business environment changes, the applications evolve, the source systems/data marts change, and the technology changes. Figure 6-2 illustrates how a universe evolves over time. You normally update the universe as the first users see it. Ideally, pilot users will preview the universe as you are developing it to ensure it will fulfill the intended business goals and requirements. This can be in a formal joint application development (JAD) session or with one user looking over the designer’s shoulder. It is not a pilot! Until you have done a thorough quality assurance review, users do not access the universe. As a result of the quality assurance review (see Chapter 16), you may make more changes, perhaps to correct errors, tweak performance, or make classes and objects more meaningful. Following quality assurance, the universe goes to a pilot phase. The goal of the pilot is to identify errors and opportunities for further improvement that you as the designer could not uncover yourself; the goal of the preview is to tell you if the universe development looks as users expect.
Chapter 6:
Universe Design Principles
97
PART II
FIGURE 6-2 Universe development follows an iterative process.
Finally, users begin accessing the universe in a controlled way via a pilot. This is your first glimpse of payback for all your development efforts. If your company is new to ad hoc reporting, be sure to choose your pilot users wisely; casual users accustomed to fixed-screen DSS systems will be overwhelmed unless you provide them with parameterized reports. The pilot is typically a limited number of power users who understand the data and are fairly computer literate. For ad hoc access, these power users may be accountants or business analysts used to writing their own SQL or 4GL reports. The pilot uncovers more objects that you may need to build or modify, allows you to remove hiccups in the security restrictions, and so on. Modify the universe following the pilot period and before you move to full-scale implementation. As you make major changes to the universe, it’s helpful to document these in the Comments (File | Parameters | Summary and discussed in the next chapter). Once you implement the universe, expect to continue to evolve the universe as a wider user base accesses it. The best implementations keep a close pulse on how the universe is performing: if users are having to do too much processing in the reports via variables, multiple data providers, and so on, look for ways that the universe can simplify and enhance reports.
98
Part II:
A Better Universe
TIP The pre-built Auditor report User Activity Per Session is a useful document for understanding how people are using BusinessObjects XI. Chapter 16 provides an example of this report. At some point, the universe will reach a stable state. However, as often as the business environment changes, so should your universe. If the business agrees upon a new way of calculating customer profitability, then that new definition should get reflected in the universe. If the business acquires another company, expect the underlying data sources and/or data warehouse to accommodate the acquisition, again impacting the universe.
Universe Components BusinessObjects XI administrators build universes using Designer. The key components of a universe are • Parameters that define database connectivity and SQL options • Classes and objects that users see when building queries and reports • Tables that are pointers to the physical tables in the database • Joins that define the relationships between the tables These are the basic components of a universe. As you further enhance your universe, subsequent chapters discuss more complex components such as contexts, hierarchies, and security.
Parameters The first step in building a universe is to define the universe parameters. At a minimum, the parameters define the name of the universe and the connection to the data source. Administrators also can adjust parameters to determine such things as the type of SQL users can generate and query limits. Chapter 7 explains the various parameters in more depth.
Classes and Objects Classes and objects are the main items a business user sees when building a query, as shown in Figure 6-3. Objects become individual columns in a report; classes never appear in a report. Classes are a way of grouping individual objects; they do not necessarily relate to physical tables in a database. Some universe designers will mistakenly organize their classes to correspond to physical tables. This is rarely advisable. Instead, classes should represent business topics. In Figure 6-3, classes appear with a folder icon. For example, in the sample Efashion universe, the class Product is a more meaningful business term than Article and includes items from multiple tables ARTICLE_LOOKUP and ARTICLE_COLOR_LOOKUP. Objects refer to columns of data. There are different types of objects (as explained further in Chapter 9) denoted with a square, sphere, or triangle icon in Figure 6-3. Objects can include a significant amount of intelligence and may not relate directly to one column in the database. For example, the object Sold At (Unit Price) includes a calculation of revenue/quantity. However, to avoid divide by 0 errors, it also includes an if-then-else statement to check for 0 quantities. This is one example of why universes are so powerful and a much better alternative to providing users with direct access to tables; if-then-else statements in SQL are implemented differently for each RDBMS and are not something most users would know how to write.
Chapter 6:
Universe Design Principles
99
PART II
FIGURE 6-3 Users see classes and objects when building or modifying a query.
Tables, Joins, and Contexts Report authors never directly see other core elements of a universe such as tables and joins (see Figure 6-4). Universe designers use tables to map data from fields to objects in the universe. Joins allow the use of more than one table in a report. A context is an optional component that resolves which join path to take when more than one path is possible. All three of these components are then combined to dynamically build SQL statements in the end user interfaces. Another strength of the universe is its ability to support almost any physical table design. As shown in Figure 6-5, many data warehouses use star schemas to ensure fast queries. However, some use snowflake schemas to make for smaller dimension tables. OLTPs use normalized schemas to eliminate data redundancy and speed data inputs (but which can make for very slow queries). BusinessObjects XI supports all three of these designs, alone or in combination.
Tables Tables are individual database tables that provide data. A table may be a physical table in the RDBMS, or it may be a view or synonym. Designer provides functionality to create aliases that are treated like tables. Further, Designer allows you to create derived tables that are SQL queries, as an alternative to a DBA creating a stored procedure or a view. In a data warehouse or data mart environment, you will have two types of tables: 1) a fact table that contains numeric information and 2) dimension tables that allow a user to analyze the numeric data from different perspectives such as product, time, or geography. The fact table can have millions of detailed rows of data or can be smaller, with summary numbers. One fact table together with its associated dimension tables is referred to as a star schema. There can be multiple fact tables and star schemas within a universe.
100
Part II:
A Better Universe
FIGURE 6-4 Tables and joins are core elements in a universe that only universe designers see.
Dimension tables are also referred to as lookup tables or reference tables. The dimension tables can be broken into more than one table; for example, detailed material IDs may reside in a MATERIAL_ID table. The groupings and product hierarchy for the material IDs may reside in a separate table such as PRODUCT_GROUPING. This type of structure, referred to as a snowflake design, is used in some data warehouses that have extremely large dimensions. In a normalized OLTP, both the fact tables and the dimension tables may be spread across many tables. For example, order information may exist in both an ORDER_HEADER table and an ORDER_LINES table. Dimensions and hierarchies often do not exist in the OLTP (note in Figure 6-5 that there is no Time or Plant table, just the individual facility that produced the product). Only the individual material IDs, customer IDs, and so on are stored with detailed records. BusinessObjects XI does not allow a universe to point to two different databases, so when users want to analyze transaction details with reference data, it generally calls for a data warehouse or data mart. However, if this is not immediately possible, BusinessObjects provides a work-around in the end-user interfaces. You, as the designer, can create two separate universes: one that points to the OLTP and one that points to the dimension database. Users then would have to build two queries; however, as long as the detailed key information is named consistently between the universes, the results will be nicely displayed in one table, without the user having to manually stitch the two result sets together. This technique is discussed further in Chapter 23.
Chapter 6:
Universe Design Principles
101
PART II
FIGURE 6-5
The universe supports star schemas, snowflake schemas, and normalized table structures.
102
Part II:
A Better Universe
When you build a universe, you are not replicating any data from these sources. Instead, you are basically creating pointers to tell the query where to find the data; no data is stored in the universe itself. This is a drastically different approach than a MOLAP database such as Hyperion Essbase or Microsoft Analysis Services. Data gets replicated only when a Desktop Intelligence or Web Intelligence user launches a report and the RDBMS sends results back to the report, populating a microcube in a .wid or .rep file on either the Enterprise server or the Windows client (for Desktop Intelligence).
Joins Joins specify how tables, views, synonyms, or aliases relate to one another. Joins allow a user to combine information from two or more tables. For example, in the following diagram, there are joins between ORDERS_FACT and the dimension table PLANT as well as between ORDERS_FACT and the dimension table PRODUCTS. There are no joins to the SUPPLIERS table. Without this join, a user is not able to determine which suppliers provide various products. There are many types of joins; they are discussed further in Chapter 8.
Orders_Fact is a physical table in the RDBMS
Two joins
Chapter 6:
Universe Design Principles
103
Contexts
How Designer Works Designer is a Windows client application that is installed on your PC. When you modify universes, you are working on a copy of the universe. When you are finished with your changes, you export your copy of the universe to a repository that end users can access. In earlier versions of BusinessObjects, the universe was stored as a binary file within the repository. When users accessed the universe, the binary file was extracted from the database and stored as a .unv file on the file system. With BusinessObjects XI, the repository stores only pointers to binary files that are permanently stored on the file system. This results in much faster import and export times for both designers and end users.
Universe Storage During Development When you first build a universe or after you have imported a universe from the repository, the universe is stored as a .unv file on your local workstation. Following is the default directory: C:\Documents and Settings\username\Application Data\ Business Objects\Business Objects 11.5\universes\@BOE_repository
where username is the name of the Windows user, and BOE_repository is the name of the BusinessObjects Enterprise repository. This folder structure is created automatically when you first save or import a universe and can be changed via Designer Options. Within the CMS repository, you also can have multiple folders for work groups or to separate test and production environments. Folders are similar in concept to universe domains in previous versions of BusinessObjects.
Universe Storage for Deployment When you have finished designing and testing your universe, you export it to the repository. Exporting it to the repository is necessary to make the universe accessible to Web Intelligence and Desktop Intelligence users.
PART II
Contexts group related joins. A context groups a set of joins together for each dimensional schema. Therefore, if your universe contains only one fact table or dimensional schema, it may not use contexts. Without contexts and when multiple dimensional schemas are involved, Web Intelligence and Desktop Intelligence would generate SQL that contained a loop. Loops generally result in incorrect queries with fewer rows returned than expected. Initial versions of BusinessObjects supported queries that contained only one context. As contexts were generally confusing for end users, they were best avoided in the earlier universe versions. Unfortunately, this legacy has carried forward unnecessarily into some current universe designs. Designers will use aliases unnecessarily to avoid contexts at all costs. For years now, both BusinessObjects classic and Web Intelligence allow one query to generate multiple SQL statements, one for each context, without prompting the user. This allows users to query multiple star schemas to create powerful business reports.
104
Part II:
A Better Universe
When you export the universe to the repository, several things happen: • Entries are made in the related Central Management Server (CMS) tables in the repository to assign the universe a unique object identifier. From within the Central Management Console, you can see the file storage location for each universe as shown in the following screen:
• The .unv file is compressed and saved to the BusinessObjects Enterprise (BOE) server file system under the Input folder. The last set of numeric folders is system generated from the object numbers assigned in the CMS. C:\Program Files\Business Objects\BusinessObjects Enterprise 11.5\FileStore\Input\a_172\001\000\428
• The .unv file from the designer workstation is renamed with the long universe name and given a .unw extension. For example, the sample Beach.unv is renamed Island Resorts Marketing.unw. In earlier versions of BusinessObjects, files could only be saved to disk with the eight-character filename. This limitation has been removed in XI, so for new universes, your filename and universe name are often one and the same. • Customized lists of values (see Chapter 10) files (*.lov) that are separate files during development become part of the .unw file when the universe is exported to the repository.
Chapter 6:
Universe Design Principles
105
NOTE When users create documents, the .unw file is also cached on the WIReportServer, which can be on a different server from the repository. As you export universe changes, Web Intelligence checks the universe modification date and automatically updates the cached universe file.
A Word about Backups
Crystal Business Views For long-time Crystal developers, the universe may seem like an unnecessary bottleneck if your immediate goal is to develop a report. The difference, however, is when to invest development time and the purpose of the metadata layer. Indeed, the start-up time is significantly longer to develop a universe than to develop a handful of reports. The benefits, though, are in the long-term maintenance and reusability. With a universe, measures are centrally defined and maintained. If they change, the administrator changes the calculation centrally and these changes are propagated to any report in which the calculation is used. The concept of business views, introduced to Crystal Enterprise in version 10, shares some similarities and capabilities with universes. However, there are a few key differences, as shown in Table 6-1. One important difference is in the purpose of each. Crystal Business Views were under development before Crystal Decisions was acquired by Business Objects. The business views would have been a good competitive feature to a universe if the companies had remained separate. However, the intended user base of the two products was different before the acquisition and remains so today. Therefore, I see business views primarily as a way of providing developers with a library of reusable components. Such a library of reusable components existed in Crystal version 9 but is more advanced with business views. Universes, on the other hand, were always focused on business users who wanted to be shielded from underlying database and SQL complexities. Such a fundamental difference in purpose leads to different uses and capabilities. The vendor has stated a commitment to preserving customer investments in either the universe or the business view but recognizes that ultimately, these two metadata layers should be merged. As part of BusinessObjects version 6.5, the universe became a new data source for Crystal Report developers. While it would seem, then, that Crystal developers would only need the universe, there are some features that require business views. (Two examples are view-time security and cascading pick lists.) Thus while the universe as a data source is a useful integration point, it is not a substitute for all Crystal Report developments. Also, when a Crystal Report accesses a universe as a data source, it does not inherit the full functionality of the universe. Crystal Reports cannot, for example, take advantage of such things as contexts; it can only generate a query that accesses a single star schema.
NOTE There is a new parameter available in XI Release 2 that allows for a Crystal Report to process multiple contexts on the database server but response time impact is variable. As well, once a Crystal Report developer builds a query against a universe, the developer cannot readily modify the query.
PART II
As you develop universes, consider how you will treat incremental design changes and backups. Clearly, in the event of a disk crash or other hardware failure, you need to ensure both your hard disk and the repository database and files are backed up on a regular basis. However, as you revise individual universes, there is no way to recover a particular version from the repository; therefore, I recommend you keep a separate backup copy of the universe.unv file before making major design changes.
106
Part II:
A Better Universe
Aspect
BusinessObjects XI Universe
Crystal Business Views
Accessible To
Crystal Reports, Desktop Intelligence, Web Intelligence, Performance Intelligence
Crystal Reports
Primary users
Business users
IT developers
Primary purpose
Act as a business view so that users can build reports without knowing SQL
Provide reusability to speed developer productivity
Usage
Required for most reports
Optional
History
Patented since BusinessObjects version 1, so more than a decade of evolution
New in Crystal Enterprise version 10, so only a couple years old
Data sources
Single
Multiple
Number of dimensional schemas
Multiple within a database, as contexts and other options can create multipass SQL
Ideally single
Query Governers
Rows returned, execution time, cost estimate
None
TABLE 6-1
Comparison of Universes and Crystal Business Views
Summary The universe is core to the entire BusinessObjects XI suite: • Web Intelligence and Desktop Intelligence users access the universe to build new queries using familiar business terms. • Crystal Report authors may use it as an optional data source but will not be able to leverage the full capabilities of the universe. • Dashboard Manager uses measures in the universe to create metrics. In designing a better universe, understand who will be the query authors today and in the future. Ensure that the universe is simple enough not to overwhelm users, yet powerful enough to facilitate business insight.
7
CHAPTER
Using Designer to Build a Basic Universe
I
n Chapter 6, I discussed the importance of aligning the universe with business goals, outlined techniques to plan for iterative development, and reviewed the basic components of a universe. In this chapter, you will get much more technical and look at the Designer interface and key parameters that help you build the universe.
Launching Designer BusinessObjects XI administrators use Designer to build universes. While much of BusinessObjects XI is managed via a web environment and browser-based tools, Designer must be installed locally on your PC. In previous versions of BusinessObjects, designers could work on a universe offline for when they did not have connectivity to the repository. With BusinessObjects XI, you must first log in to the CMS repository, even when you are working against a local copy of a universe file. To launch Designer, follow these steps: 1. From Windows, select Start | Programs | BusinessObjects XI Release 2 | BusinessObjects Enterprise | Designer. Designer presents you with a login screen. 2. If your deployment has multiple CMS servers, for test and production, select the correct enterprise server from the System drop-down. 3. Enter your BusinessObjects Enterprise user name in the appropriate box. (Note: Administrator is a default user name created during initial installation.) BusinessObjects Enterprise user names are not case sensitive, but user names with other authentication systems in Step 5 may be.
107 Copyright © 2006 by The McGraw-Hill Companies. Click here for terms of use.
108
Part II:
A Better Universe
4. Tab to move to the Password box. The system administrator determines the minimum length and case sensitivity of passwords. (The Administrator user name initially contains no password.) 5. Select the Authentication source for your user name. 6. Click OK. If you have entered the preceding information correctly, you will be presented with a Designer screen or wizard. If you entered an invalid user name, password, or authentication source, you will receive an error. As shown next, the error message does not clearly indicate if the error is related to an incorrect user name or password or if you chose the incorrect authentication source. Within BusinessObjects Enterprise, user names can be authenticated against one or more security databases. The default authentication source is Enterprise. However, if your company uses Windows NT, for example, then your NT user name and password can be used to log you in to Designer. Authentication options are discussed more fully in Chapter 13.
Opening a Universe Once you have logged in to the CMS repository, you can open a universe that you have saved locally or you can import a universe from the repository. To open a universe from the repository, follow these steps: 1. From the pull-down menu, select File | Import. 2. From the Import Universe dialog, select the repository folder that contains the desired universe. If you do not see the universe listed, click the down arrow to navigate to a different universe folder. 3. From the list provided, select the name of the universe you wish to open. In the preceding example, eFashion is selected. 4. Select OK. Designer imports the universe definitions from the repository and displays classes, objects, and the universe structure. During the import process, Designer also
Chapter 7:
Using Designer to Build a Basic Universe
109
saves a copy of the universe definitions to your local computer under the following default directory: C:\Documents and Settings\username\Application Data\Business Objects\Business Objects 11.5\universes\@BOE_repository
where username is the name of the Windows user and BOE_repository is the name of the BusinessObjects Enterprise repository. As discussed in the preceding chapter, it’s important to remember that during universe development, you are working on a local copy. Users will not be able to see your changes until you export the universe to the repository.
BusinessObjects XI uses the concept of folders to help you organize universes and to simplify access control. Earlier versions of BusinessObjects referred to these as domains. Domains, however, were separate physical databases, whereas folders are still within one CMS repository and file system. If you imported a previous repository into XI, these folders were created automatically according to the domain names you used in version 6.x. Folders, like domains, can be used to separate test and production universes. Another way of separating test and production development is to have completely separate Enterprise implementation and server environments. The latter approach is clearly more resource intensive but better separates development, test, and production environments. The addition of an Import wizard and BIAR files further facilitates packaging of development content and moving to a production server. These two approaches are discussed more in Chapter 15. Folders are created within Designer during the universe export process. However, it’s preferable to plan your folder structure beforehand. To create a new universe folder, follow these steps: 1. Select File | Export from the pull-down menu. 2. From the Export Universe dialog, select Browse. 3. Position your cursor at the appropriate level in the list and click the button Insert A New Folder. Note in the screen at right, ASK2 is the root or top level in the universe folder. 4. When prompted, enter the name of the new folder. 5. Click OK to close the folder dialog box. 6. Click Cancel to close the Export Universe dialog box.
PART II
Folders and Domains
110
Part II:
A Better Universe
From within this folder list, you can right-click any folder to invoke a pop-up menu that allows you to rename or delete folders:
Designer Workspace Figure 7-1 shows the Designer workspace that includes the classes and objects that users see, the physical tables you reference to build the universe, and the joins between the tables. As you focus on particular aspects of the universe design, you may decide to resize or close certain panes. The status bar displays messages or additional information as you add tables and change object definitions. In Figure 7-1, because the Quarter object is selected, the status bar displays the object description. How the universe initially appears to you and which panes are automatically displayed are controlled via settings in Tools | Options, discussed later in this chapter.
Designer Toolbars As with many Windows applications, you can perform tasks by selecting options from the pull-down menus or from the toolbar. Figure 7-1 shows the Standard toolbar and the Editing toolbar. The Formula toolbar is discussed in a later chapter.
Contexts and joins Classes and objects
Universe structure
Status bar
FIGURE 7-1 The Designer workspace has multiple panes that you expand or hide while building your universe.
Chapter 7:
Using Designer to Build a Basic Universe
111
To display, hide, or control toolbar options, select View | Toolbars from the pull-down menus.
PART II
• Large Buttons controls the size of the buttons on the toolbar. • Show Shortcut Keys In Tooltips will provide additional help text in the tooltips if there is a keyboard equivalent to performing a task, for example, CTRL-S to save a universe file. • Show Tooltips displays help text for each button when you move your mouse over a button. The following shows the tooltip with a shortcut equivalent.
Table 7-1 describes the purpose of each button in the standard toolbar. Table 7-2 describes the purpose of each button in the editing toolbar.
112
Part II:
Button/Key Combo
or
or
New Universe
Creates a new universe.
Open Universe
Opens an existing universe.
Save Universe
Saves the universe to disk in the .unv file. Does not export the universe to the repository.
Print
Prints the universe definitions and structure.
Print Preview
Previews what definitions will be printed.
Cut
Cuts the selected item (table, join, object).
Copy
Puts the selected item into the MS Windows clipboard.
Paste
Pastes the selected item.
Find
Invokes a dialog to find an object or part of SQL. New in XI or 6!
Find again
Repeats the last search.
Undo/Redo
Undoes or redoes the last action.
Quick Design Wizard
Launches the Universe Design Wizard to build a new universe.
Parameters
Modifies the universe parameters such as connection information, SQL settings, strategies.
Hierarchies
Creates or modifies the universe hierarchies.
Connections
Allows you to create or edit connections. New in XI and formerly within Supervisor.
CTRL-S
CTRL-P
CTRL-X
or
or
or
or
TABLE 7-1
Function
CTRL-O
or
or
Name
CTRL-N
or
or
A Better Universe
CTRL-C
CTRL-V
CTRL-F
F3
CTRL-Z
Designer Toolbar Buttons for the Standard Toolbar
Chapter 7:
Button/Key Combo
Using Designer to Build a Basic Universe
Function
Universe Window
Toggles to display classes and objects.
View List Mode
Views the join and context lists in statements as well as in the ERD.
Arrange Tables
Reorganizes the tables to make the structure pane easier to read.
Zoom
Makes tables in the structure window appear larger or smaller.
TABLE 7-1 Designer Toolbar Buttons for the Standard Toolbar (continued) Button/Key Combo
or
Name
Function
Insert Class
Inserts a new class.
Insert Object
Inserts a new object within a class.
Insert Condition
Inserts a condition object.
Show or Hide Item
Hides an object or class from users.
Table Browser
Shows a list of tables available to add to the universe.
Insert Join
Inserts a join between two tables.
Insert Alias
Creates an alias name for a table that already is used in the universe.
Insert Context
Creates a context to prevent loops in a universe.
Detect Joins
Checks the universe to determine if any tables are not joined.
Detect Cardinalities
Detects cardinalities, or relationships between tables.
CTRL-SHIFT-H
TABLE 7-2 Designer Toolbar buttons for the Editing Toolbar
PART II
Name
113
114
Part II:
Button/Key Combo
A Better Universe
Name
Function
Detect Loops
Checks the universe to determine if there are any loops, and prompts for ways to resolve.
Detect Aliases
Checks the universe to determine if any tables create a loop that an alias could resolve.
Detect Contexts
Checks the universe for loops and determines if contexts would resolve the loops.
Detect Keys
Detects keys for each physical table used in the universe to help Desktop and Web Intelligence generate more efficient SQL.
Check Integrity
Performs multiple universe integrity checks.
Create or Apply Access Restriction
New in XI is the ability to group multiple restrictions into sets. See Chapter 13.
View Net Access Restrictions
Users can inherit restrictions through group assignments. This allows you to see the net effect.
TABLE 7-2 Designer Toolbar buttons for the Editing Toolbar (continued)
Universe Parameters The universe parameters provide information about your universe as well as allow you to change universe behavior such as how long a query can run and the complexity of the SQL generated. The parameters you enter here can be overridden by settings for individual users or groups. To modify the universe parameters, bring up the Universe Parameters dialog box by selecting File | Parameters.
Definition Tab From the Definition tab, you see the name of the universe as well as the connection you specified when building the universe through the wizard. The Description appears to Desktop Intelligence users whenever they create a new report and select a particular universe; Web Intelligence users do not see the universe description. The Description box is a good place to provide users with information about the purpose of the universe and the target business user group, as well as timely information such as when data was last updated or if there are any data integrity issues.
Chapter 7:
Using Designer to Build a Basic Universe
115
This is the full-length name users see when creating a report (different from the universe filename)
PART II
Edit connection parameters to specify source system login IDs, passwords, and disconnect time
The Description box is an ideal place to provide users with additional help text
Summary Tab The Summary tab of the Universe Parameters dialog box provides information about the universe, such as the number of classes, objects, and joins. Additionally, it provides a last modification date, the name of the modifier, and a revision number. The revision number is updated each time you export the universe to the repository, regardless of whether or not you made changes to it.
116
Part II:
A Better Universe
TIP The Comments section in the Summary tab allows an administrator to include additional technical notes on the universe. End users do not see these notes. This makes the Comments section an excellent place to store detailed revision notes for change control purposes.
Strategies Tab The Strategies tab of the Universe Parameters dialog box defines how the universe uses information from the data dictionary to help you build the universe. A data dictionary is a set of system tables that your RDBMS automatically creates and maintains about the objects (tables, views, synonyms, owners) in your data source. Although BusinessObjects provides some very powerful strategies to get you started, if you have a data warehouse or source system architecture that uses public synonyms (most do), you will need to create external strategies to ensure Designer can see those tables. The default strategies vary slightly for each type of database you are accessing. The strategy information is used during a number of Designer activities: • During the wizard’s universe build • If you use the Insert button or menu to insert tables, joins, or candidate objects • In automatically creating joins and objects, if your database options use this setting (discussed later in the section “Database Options”) Although your source system DBA will generally help you customize these strategies, as a universe designer, the more you understand how they work, the better you can advise the DBA on the best approach to customization. Strategies are SQL statements that read the data dictionary tables in your source system. The queries then use that dictionary information to present you with a list of initial classes, objects, joins, and tables. Thus if all your data warehouse tables start with DW, for example, then your initial proposed classes will also start with DW (such as Dw Product). If you do not want the user to see this DW (not recommended), then you can modify your strategy file to drop the DW from the proposed classes automatically. Without modifying the strategy file, you must manually modify each individual object.
There are three types of strategies
The drop-down box lets you choose different strategies
Chapter 7:
Using Designer to Build a Basic Universe
117
There are three parts of a universe that strategies interact with: objects, joins, and tables. • Objects The object strategy determines how Designer reads the table and column information from the data dictionary to come up with some initial classes and objects (either when using the wizard or when inserting tables). By default, the table names become the proposed class names and the individual columns within each table become the objects in your universe. The default object strategy also converts all names to initial caps and removes the underscore (_) from any table and field names. • Joins Designer has several built-in approaches to automatically create joins, listed next. • Database keys matching names Joins are created automatically between columns that are indicated in the database as primary keys and foreign keys.
NOTE The database keys matching names strategy is not working in Service Pack 1. • All matching column names When the column names match between two tables, the joins are automatically inserted, regardless of whether they were designated as keys by the DBA when the tables were created. • All matching numeric column names Joins are created automatically between columns that are numeric and have matching names. In the Oracle sample Sales History (SH) schema, the primary key in the TIMES dimension table is TIME_ID and is a date field. In the fact table SALES, TIME_ID is a foreign key and a date field. This strategy would not automatically propose a join because the field format is date. If you wish joins to be proposed when the field format is numeric, data, or character, select the preceding strategy. • Tables This part of the strategy is probably your most important part. If Designer cannot find your necessary tables, it can never move to the next step of creating objects and proposing joins. Information collected from the table part of the strategy is displayed in the structure window, such as the column name, data type (Numeric, Character, Date), and key. In early versions of Designer, the SQL used to find the tables in the RDBMS was quite seamless and designers could easily modify it. As of version 4, Designer switched to this approach of built-in strategies and external strategies. Thus, the exact SQL of the built-in strategies is no longer viewable. However, Designer basically selects all physical tables owned by the individual user specified in the connection parameters. For example, if the owner of the tables in your Central Data Warehouse is CDW, then you must log in with the user ID CDW for Designer to find these tables. Usually, the DBA will also create synonyms so that users can access these tables without prefacing them with CDW. You can change the OWNER parameter for the universe to N for No (see the “Parameter Tab” section in this chapter). This will drop the owner name from your table prefix and will cause the built-in strategies to look for public synonyms and views (for example, the user name specified in the connection parameters does not necessarily own the physical tables). However, setting OWNER to N without customizing an external strategy can also pick up a lot of clutter such as system tables. Therefore, you will still need to use or create an external strategy.
PART II
• Edit manually (none) Joins are not created automatically.
118
Part II:
A Better Universe
Automatically creating objects and joins can either be a productivity booster or a nuisance. The usefulness of this process is very much dependent upon your data source and how closely aligned it is with the business terminology. When the data source is a data warehouse with conformed dimensions, I find automatic join creation more helpful than automatic object creation.
External Strategies External strategies are customized files that allow you to control how the data dictionary is read. It can be rather tedious to implement external strategies, yet there are several oftencited reasons when you must use them: • Your database uses public synonyms. • You want to extract column comments from your source system and use them as object descriptions. • You wish to import metadata from a text file. • Certain tables do not appear in the universe structure. You also may use an external strategy to import metadata from a spreadsheet or text file. External strategies appear along with the built-in strategies under each of the dropdown options for objects, joins, and tables along with the built-in strategies. However, you create external strategies outside of Designer using an XML editor. In version 5.x, strategy files were text files. All related files are stored under C:\Program Files\Business Objects\BusinessObjects Enterprise 11.5\win32_x86\dataAccess\ConnectionServer\RDBMS
where RDBMS is the data source type used for this universe connection. There are three main steps to declaring and creating a strategy file. In order for Designer to recognize any changes to these files, you must make the changes before you launch Designer or restart Designer: 1. Reference the external strategy file. 2. Edit the external strategy file to specify the SQL to execute and the type of strategy. This is the “essence” of the file. 3. Specify the help text to appear within Designer. You edit this text in the RDBMS_ LANGUAGE.STG file, for example ORAEN.STG for the Oracle English language file. This step is optional. Steps 1 and 2 are described in detail in the following sections.
Reference External Strategy File So that the external strategy file is active within Designer, you declare it in the RDBMS.SBO file. In version 5, this was declared in the RDBMS.PRM file. For example, if Oracle is the data source and Windows the operating system, you modify the following SBO file: C:\Program Files\Business Objects\BusinessObjects Enterprise 11.5\win32_x86\dataAccess\ConnectionServer\oracle\oracle.sbo
Chapter 7:
Using Designer to Build a Basic Universe
119
Within this file, there are multiple parameters. The parameter that declares the external strategy file is oracle
PART II
Business Objects provides a sample external strategy file for each database, named as RDBMS.STG. You can edit this file (make a backup copy first!) or change the preceding parameter within the SBO file to reference a different STG filename.
Edit the External Strategy File The following screen shows a sample Oracle strategy for defining joins based on database constraints:
120
Part II:
A Better Universe
As shown in the preceding example, these are the main components of the STG file: Component
Purpose
Example
Strategy Name
Appears in the drop-down list of the universe parameters, Strategies tab.
Type of Strategy
Determines how the strategy is used in building the universe. The three types are OBJECTS, JOIN, STRUCT. STRUCT is used to build the list of tables.
JOIN
SQL Statement Output or Text File
Execute SQL to read from the data dictionary.
SELECT ...
The SQL section is the core of the strategy. This is where, for example, if you don’t like DW appearing in each class name, you can use LTRIM within the SQL to cut it. If your source system uses L33 for every column involving a customer, use REPLACE to replace L33 with CUSTOMER to create automatically more meaningful object names. Each strategy type requires a precise layout for the SQL output in order to function correctly. The Object strategy has nine output columns, as shown in Table 7-3, with a vertical bar (|) as a delimiter between each column. An external strategy for object creation can be helpful to read column comments from the dictionary tables. Unfortunately, the built-in strategies do not do this. For example, the Oracle dictionary tables that would be used to create an object strategy are USER_TABLES, USER_TAB_COLUMNS, and USER_COL_COMMENTS. The dictionary table ALL_OBJECTS could be used in the SQL statement, particularly if public rather than user synonyms are used in the database; however, ALL_OBJECTS would also bring in too many unnecessary tables, including system objects, so a WHERE clause should be added to the SQL to filter the results. Following is the SQL for the sample external strategy file ORACLE.STG that helps build object definitions: SELECT U1.table_name,'|', U1.column_name,'|', translate(initcap(U1.table_name),'_',' '),'|', translate(initcap(U1.column_name),'_',' '),'|', U1.table_name||'.'||U1.column_name,'|', ' ','|', decode(SUBSTR(U1.DATA_TYPE,1,1),'N','N','F','N','D','D','C'),'|', SUBSTR(U2.comments,1,474),'|', 'O','|' FROM USER_TAB_COLUMNS U1,USER_COL_COMMENTS U2 WHERE U1.table_name=U2.table_name
Chapter 7:
Using Designer to Build a Basic Universe
Column
Output
Explanation
1
Table
Table, view, or synonym.
2
Column
Field from the object or table.
3
Class Name
The class name is converted from the physical table name, view, or synonym by applying all initial caps and converting underscores (_) to spaces.
4
Object Name
The object name is converted from the column name by applying all initial caps and converting underscores (_) to spaces.
5
SQL Select (Table.Column)
The table and column names are concatenated to form the SQL Select statement for each object.
6
SQL Where Clause
7
Object Type
The object type is determined from the data type in the source data and converted to N for Numeric, D for Date, C for Character, or L for Long Text.
8
Description
The Object description is taken from the column comments.
9
Object Type (D, M, I)
The object type is D for Dimension, M for Measure, and I for Information.
TABLE 7-3
Format for Object Strategy File
PART II
and U1.column_name=U2.column_name UNION SELECT S.SYNONYM_NAME,'|', U1.column_name,'|', translate(initcap(S.SYNONYM_NAME),'_',' '),'|', translate(initcap(U1.column_name),'_',' '),'|', S.SYNONYM_NAME||'.'||U1.column_name,'|', ' ','|', decode(SUBSTR(U1.DATA_TYPE,1,1),'N','N','F','N','D','D','C'),'|', SUBSTR(U2.comments,1,474),'|', 'O','|' FROM ALL_TAB_COLUMNS U1, ALL_COL_COMMENTS U2, ALL_OBJECTS O, USER_SYNONYMS S WHERE S.table_owner=O.owner AND S.table_name=O.object_name AND (O.OBJECT_TYPE='TABLE' OR O.OBJECT_TYPE='VIEW') AND O.owner=U1.owner AND O.object_name=U1.table_name AND U1.owner=U2.owner AND U1.table_name=U2.table_name AND U1.column_name=U2.column_name
121
122
Part II:
A Better Universe
In accessing the sample Oracle sales history owned by SH, the preceding SQL would create the following partial output: SALES | PROD_ID
| Sales |Prod Id
| SALES.PROD_ID
|| N | FK to the products dimension table
| O |
SALES | CUST_ID
| Sales |Cust Id
| SALES.CUST_ID
|| N | FK to the customers dimension table
| O |
SALES | TIME_ID
| Sales |Time Id
| SALES.TIME_ID
|| D | FK to the times dimension table
| O |
SALES | CHANNEL_ID
| Sales |Channel Id
| SALES.CHANNEL_ID
|| C | FK to the channels dimension table
| O |
SALES | PROMO_ID
| Sales |Promo Id
| SALES.PROMO_ID
|| N | promotion identifier, without FK constraint (intentionally) to show outer join optimization| O |
SALES | QUANTITY_SOLD | Sales |Quantity Sold | SALES.QUANTITY_SOLD || N | product quantity sold with the transaction
| O |
SALES | AMOUNT_SOLD
| O |
| Sales |Amount Sold
| SALES.AMOUNT_SOLD
|| N | invoiced amount to the customer
A structure (STRUCT) or table strategy is used when you insert tables into the universe pane. It has six output columns as shown in Table 7-4, with each column separated by a vertical bar (|).
NOTE Accessing USER dictionary tables can be a problem in strategies if the user name in the connection parameters is not the owner of the tables, views, or synonyms. Often synonyms are set up as PUBLIC. In such cases, use ALL_ dictionary tables to find synonyms and use WHERE clauses to find the appropriate database objects. The following table or STRUCT strategy was created by an oil and gas company that uses public synonyms in its data warehouse. This strategy file does a good job of limiting the information generated, thus making structure refreshes faster. SELECT 'REPT', '|', S.TABLE_OWNER, '|', S.SYNONYM_NAME,'|', U1.column_name,'|', decode(SUBSTR(U1.DATA_TYPE,1,1),'N','N','F','N','D','D','C'),'|', '','|' FROM ALL_TAB_COLUMNS U1, ALL_COL_COMMENTS U2, ALL_OBJECTS O, ALL_SYNONYMS S WHERE S.table_owner=O.owner AND S.table_name=O.object_name AND (O.OBJECT_TYPE='TABLE' OR O.OBJECT_TYPE='VIEW') AND O.owner=U1.owner AND O.object_name=U1.table_name AND U1.owner=U2.owner AND U1.table_name=U2.table_name AND U1.column_name=U2.column_name AND S.table_owner NOT IN ('SYSTEM', 'MDSYS', 'ORDSYS', 'SYS') AND S.DB_LINK IS NULL UNION SELECT 'PRD5','|', S.TABLE_OWNER, '|', S.SYNONYM_NAME,'|', U1.column_name,'|', decode(SUBSTR(U1.DATA_TYPE,1,1),'N','N','F','N','D','D','C'),'|', '','|' FROM [email protected] U1, [email protected] U2, [email protected] O, ALL_SYNONYMS S
Chapter 7:
Using Designer to Build a Basic Universe
123
WHERE S.table_owner=O.owner AND S.table_name=O.object_name AND (O.OBJECT_TYPE='TABLE' OR O.OBJECT_TYPE='VIEW') AND O.owner=U1.owner AND O.object_name=U1.table_name AND U1.owner=U2.owner AND U1.table_name=U2.table_name AND U1.column_name=U2.column_name AND S.table_owner NOT IN ('SYSTEM', 'MDSYS', 'ORDSYS', 'SYS') AND S.DB_LINK = 'PRD5.WORLD'
TIP If you have created business descriptions or other metadata inside a spreadsheet or other Office tool, you can read this metadata into the universe through the use of external strategies. The metadata must be saved in a text format with the appropriate layout and column delimiters described in Tables 7-3–7-5. Within the external strategy file (for example, Oracle.stg), instead of listing a SQL statement, you reference the text filename as in this example:
C:\METADATA\OBJECT_HELP.TEXT
Database Options That Relate to Strategies The settings on the Strategies tab also relate to the Designer’s Database Options under Tools | Options | Database. For example, in the Strategies tab, even if you tell Designer to use Smart Matching based on the column names, Designer will automatically create the joins in the universe only if you check the box Extract Joins With Tables in Options. The main difference between Parameters and Database Options is that Parameters are specific to the individual universe, whereas the Options apply globally to Designer and, therefore, all universes created on the PC. Refer to the section “Designer Options” later in this chapter for other Designer options. Column
Output
Explanation
1
Table Qualifier
Database name
2
Owner
Owner of the tables if OWNER=Y is set in the .prm file
3
Table
Name of table, view, or synonym
4
Column
Column name
5
Data Type
Data type to appear in structure window as C, N, or D
6
Null?
Indicator if the column can be null. Valid values are No or blank
TABLE 7-4 Format for Structure or Table Strategy File
PART II
Join strategies (JOIN) use five output columns as shown in Table 7-5, with each column separated with a vertical bar (|). It’s rarely necessary to use external strategies for join creation. For your external strategies to work, you must use the exact output layout. If you forget a column, mix up the order, or forget the delimiter, you will get unusual results or an error.
124
Part II:
A Better Universe
Column
Output
Explanation
1
Table1
Table 1 forms the left side of the join statement.
2
Table2
Table 2 forms the right side of the join statement.
3
Join Operator
The Join operator, usually = but can also be >=, , and so on.
4
Outer_Type (L,R)
If the join is an outer join, then an indication if it is left outer join or right; otherwise blank if it is not an outer join.
5
Cardinality
An indication of the cardinality between the tables, such as one to one (11), one to many (1N), or many to one (N1).
TABLE 7-5 Format for Structure of a Join Strategy File
Controls Tab The Controls tab of the Universe Parameters dialog box enables you to specify additional limits that will affect individual users’ queries. These parameters are sometimes referred to as query governors: • Limit size of result set to Prevents the Enterprise server (for Web Intelligence), the user PC (for Desktop Intelligence), or the wide area network from becoming saturated with too many rows of data. It does not reduce the load on the source system database. Therefore, leave this box unchecked or increase it to a larger number such as 200,000 rows. If you use drill-down, the number of rows in the result set can be quite large, even if the initial summary report displays only ten rows of data, for example. However, larger result sets lead to slower report generation, particularly when you have complex formatting and variables.
TIP If you are concerned about novice users incorrectly retrieving large result sets, you can use Restriction Sets (see Chapter 13) to tailor these settings for individual users or groups. • Limit execution time to This is another check box to use carefully. This option limits the time the server connection or PC (for Desktop Intelligence) is tied up, but it will not limit the time the database is affected. So if an administrator sets the limit to 10 minutes, the database could actually try to run the query for 60 minutes. In the past, BusinessObjects Enterprise server supported only synchronous connectivity to the database, meaning users could not cancel a query and only received an error only after the query completed. With asynchronous connectivity, the database session becomes inactive after 10 minutes and users will receive an error message at that time. Desktop Intelligence will say “No Data to Fetch,” while Web Intelligence will indicate only partial results have been retrieved (but no error). However, the query is still executing to completion on the database server, consuming resources there. Also, this option refers to the time for all of the SQL statements to execute. If your query contains multiple, synchronized SQL statements (which get created when there are multiple contexts in the universe), ensure this setting is high enough for all the statements to execute.
NOTE If your queries are running this long, you need to do some serious index optimization, possibly modify your universe to generate more efficient SQL, or as a last resort, encourage users to schedule long-running reports.
Chapter 7:
Using Designer to Build a Basic Universe
125
PART II
• Warn if cost estimate exceeds Certain databases support the use of cost estimates when analyzing how long a query will take to execute. Although the preceding screen suggests this relates to the duration of the query, in reality, the cost is a relative measurement determined by the data source’s I/O utilization, memory consumption, and CPU time. This setting was not available in XI Release 1 and is not currently working in XI Release 2; when you set this parameter, it has no effect on the query completion. However, in previous releases, if you enabled the cost estimate, you also had to ensure that each user had write access to the Oracle PLAN_TABLE so that the cost estimate could be performed and then used to warn the users. • Limit size of long text objects to This parameter is useful for BLOB fields or for very long variable-length fields. Users can adjust their column widths if they do not want to see the full text. However, if you as the designer set this number too low, users cannot override it; they never can get to the data at the end of a long field.
SQL Tab When deploying BusinessObjects XI directly against a transaction system, you may want to limit complex SQL queries so that they do not affect response time for inputting data. Otherwise, I prefer to leave complex SQL enabled in pure reporting databases or data warehouses. Casual users may not require these features and can ignore the options. However, if you disable advanced SQL, then power users may get frustrated. The following three options in the SQL tab of the Universe Parameters dialog box allow you to limit complex queries: • Allow use of subqueries Subqueries are a powerful type of query that allows users to nest one query within a main query (see Chapter 23). As these queries are complex and use additional RDBMS resources, administrators can remove this capability. By default, leave it enabled. • Allow use of union, intersect, and minus operators These operators allow advanced users to combine multiple SQL statements into one data provider. By default, leave it enabled.
126
Part II:
A Better Universe
• Allow complex operands in query panel This option is similar to the preceding one but allows users to select the conditions from the query panel: Complex operands are “Both” and “Except.” The operand “Both” generates an INTERSECT query, and “Except” generates a MINUS query. The Multiple Paths options determine the kind of SQL generated behind the scenes. The users may not see the SQL, but these options do affect the performance and accuracy of any given query. • Multiple SQL statements for each context Contexts are explained in detail in Chapter 8. This option should be checked so that a separate SQL statement is generated for each context or star schema. If your universe has multiple contexts and you do not enable this box, users will receive an error message when trying to create a query that contains measures from two different contexts. In the Efashion universe, for example, one could not create a query that analyzes promotion costs and sales revenue for a given product without the use of contexts and this option. • Multiple SQL statements for each measure When you have measures that come from multiple tables within the same context, this box should always be enabled or queries from multiple fact tables may produce incorrect results. For example, in the Efashion universe, unit sales price and extended sales price are from two different tables within the same context. In order to produce correct results when these measures are used in the same query, Web Intelligence needs to issue two SELECT statements. It’s also useful to check this option even if you think you have one central fact table. For example, you may later create measures such as number of days or number of products that go against dimension tables. Without this option enabled, Web Intelligence will create a Cartesian product and give incorrect information when the measures come from more than one table. The disadvantage of this option, though, is that certain queries could be processed more efficiently with one SELECT statement and still return accurate results. For example, if your query contains a COUNT DISTINCT (see Chapter 11) of products from a dimension table with sales from a fact table, as long as the count object uses DISTINCT, you will get correct results. However, it will take longer and significantly more resources to process the multiple SELECT statements generated by default with this option set than when using one SELECT statement without this option enabled. My recommendation, then, is that correct queries are more important than fast queries. Check this option by default but monitor how many queries users create that generate multiple SELECT statements unnecessarily. • Allow selection of multiple contexts Enables users to create queries on objects from multiple contexts. This box should be enabled. In the Efashion universe, it allows users to analyze sales and promotions in one report even though sales and promotions are two different contexts.
Chapter 7:
Using Designer to Build a Basic Universe
127
PART II
Understanding Multiple SQL Statements for Each Measure The option Multiple SQL Statements For Each Measure has some nuances that are important to understand. First, even if this box is enabled, if the measures come from the same fact table, the query engine will issue only one SQL statement. This is a good thing, as it avoids tying up the database unnecessarily. Second, the query engine will issue only two SQL statements if the object is a measure (as discussed further in Chapter 9) and it contains an aggregate function (sum, count, and so on). When SQL joins two tables together, it will repeat each row for each combination in the GROUP BY section. Figure 7-2 illustrates how this happens. The ARTICLE_LOOKUP table has only one row and shows a price of 114.55. The SHOP_FACTS table has six rows showing that this style blazer sold six times during week 8 of year 2000. When SQL joins ARTICLE_ LOOKUP with SHOP_FACTS, the 114.55 unit price will get repeated six times and summed to 687.30—an incorrect result. Business Objects will refer to this problem as a “fan trap,” but SQL experts and DBAs will generically refer to it as a Cartesian product. BusinessObjects XI will prevent Cartesian products and this overstatement of results by issuing a SELECT statement for each measure coming from different tables. This is seamless to users.
NOTE This example uses the object Extended Price object, which includes a SUM. As discussed in Chapter 9, unit prices should never be summed. If anything, they can be averaged or recalculated with revenue/quantity sold. If you wish to see another example of a fan trap, disable the option Multiple SQL Statements For Each Measure and include the two measures from two different tables, such as Store Details \ Extended sales floor size and Sales revenue. These measures must contain aggregate functions such as SUM or COUNT.
128
Part II:
A Better Universe
FIGURE 7-2 Queries produce incorrect results when aggregates are used on multiple tables. Split the SQL statements to prevent this.
The reports in Figure 7-3 show how the results depend on which option is set in the SQL universe parameters. The top report shows the correct results as the SQL is split for each measure and each table. As a control, I have added an object to the universe that does not contain the SUM on price. Notice that both the Extended Price object that contains the SUM and the Unit Price that does not contain the SUM yield the same correct results: 114.55. For the middle report, only one SQL statement is generated, as the parameter “Multiple SQL Statements for Each Measure” was not selected in the universe. Notice how the Extended Price returns grossly incorrect results, 687.30. The results have been overstated by however many rows there are in the SHOP_FACTS table.
Chapter 7:
Using Designer to Build a Basic Universe
129
PART II
FIGURE 7-3
Splitting the SQL ensures correct results for reports with multiple measures.
Unfortunately, even with this setting to split the SQL, you cannot guarantee users will always get correct results as shown in the bottom report. Although there are two SQL statements for this report, the query contains an additional result object Year that forces a join to SHOP_FACTS and again overstates the results. Therefore, while splitting the SQL can help in many cases, it will not resolve all problems of having measures in multiple tables. The best way to prevent such problems is to have all measures in one fact table per context. Measures that contain counts are an exception and can be resolved differently as discussed in Chapter 11.
Links Tab The Links tab of the Universe Parameters dialog box allows an administrator to create a master universe that is then linked to other universes. As this is an architecture and maintenance issue, links are described more fully in Chapter 15. By default, leave this tab blank.
130
Part II:
A Better Universe
Parameter Tab The Parameter tab is new in XI. In the past, many database parameters could be set only by modifying the RDBMS.PRM file with a text editor. This file is still used for certain parameters. However, parameters you set here are specific to individual universes and no longer maintained in the RDBMS.PRM file. The universe-specific parameters are documented in the online help. Additional parameters that are database specific are available in the vendor documentation, specifically, in the Data Access Guide. Table 7-6 lists commonly changed parameters.
NOTE You cannot add parameters that are used in the RDBMS.PRM file. For example, the parameter OWNER is still maintained in the RDBMS.PRM file and will be ignored if entered here. To change a database parameter, 1. Click Parameters from the toolbar or File | Parameters from the pull-down menu. 2. Select the Parameter tab.
3. From the list of parameters, select the one you wish to change—in this example, COLUMNS_SORT. 4. In the Value box, enter the new parameter value, Yes. 5. Click Replace to update the parameter value and then OK to close the dialog.
Chapter 7:
Using Designer to Build a Basic Universe
Options
Default
Explanation
ANSI92
Yes|No
No
Determines the type of SQL generated, either ANSI 92 compliant or not. See Chapter 8 for more information.
COLUMNS_SORT
Yes|No
No
Determines the order that columns are displayed in tables in the structure pane.
CORE_ORDER_PRIORITY
Yes|No
Yes
Determines the order in which classes and objects are sorted when universes are linked. Yes causes them to be sorted according to the master universe. No causes them to be sorted in the derived universe.
DISTINCT_VALUES =
GROUPBY DISTINCT
DISTINCT
Determines how the SQL for Lists of Values is generated (See Chapter 10). With the default settings, the LOV query uses SELECT DISTINCT, which can be slow against large tables.
MAX_INLIST_VALUES
NN up to 256
99
Specifies the maximum values users can select when using IN LIST in query conditions.
TABLE 7-6 Database Parameters Configurable Per Universe
Universe Connections The universe connection determines how users connect to the data warehouse or data source when they build or refresh a query. The user name and password used for the universe connection can be the same as or different from the user name and password used to authenticate a user in the BusinessObjects Enterprise repository. Often they are the same if you use the database to control security. Certain databases, such as Teradata, also perform better when each database user has its own workspace, whereas others, such as Oracle, perform better with a “shared” database login as memory and resources are shared. Connections can be defined in two places within Designer: • When you access the universe parameters, Definition tab • Via the Connections button on the toolbar or select Tools | Connections from the pull-down menu
PART II
Parameter
131
132
Part II:
A Better Universe
This second option is new in XI and replaces the approach of defining connections via Supervisor in 5.x and 6.x. The Connection dialog in previous versions has now been replaced with a wizard that guides you through the process of adding and editing connections. As discussed earlier, when you work with universes, you are working on a copy and changes appear to users only when you export the universe. The opposite is true of connections. As you make changes to connections, they are immediately saved to the repository when you click Finish from within the Connection Wizard.
Connection Types Designer supports three different types of connections, each denoted with a unique symbol in the list of connections: • Personal connections that users may create for freehand SQL or that universe designers create when testing new data sources. The definitions reside in C:\ Documents and Settings\User\Application Data\Business Objects\Business Objects 11.5\lsipdac.lsi (personal data account.local security information), where User is the name of the network or NT user. • Shared connections that are shared via work group folders on a LAN server for designers to share outside the CMS repository. The definitions reside in sdac.lsi (shared data account). • Secure connections that reside in the CMS repository. In order to deploy universes to end users, you must use secure connections.
Two Approaches to Login Parameters To understand how login parameters within the universe connections work, you must first understand how BusinessObjects XI is deployed and how security concerns in the various data sources, whether OLTPs or data marts, interact.
Scenario 1: Use Database Credentials Let’s assume that you are deploying an Orders universe directly against a transaction system. Users who enter Orders use BusinessObjects XI to create real-time reports against the same data source. Therefore, you want the same security in the source system to apply in BusinessObjects XI. You want BusinessObjects XI to pass individual database logins to the Orders data source. In order to do so, you create a set of database credentials for each individual user that will be passed on to the Orders data source. While it would be preferable for users to have the same user ID and password between different systems, this is sometimes not the case when different administrators are involved. As shown in Figure 7-4, the user ID and password to log in to BusinessObjects Enterprise is Cindi/ASK. However, the user ID and password to log in to the Orders Transaction system is completely different: U761358/ASK1. In order to pass this second user ID through to the universe data source, an administrator defines a set of database credentials for each user (see Chapter 13). These database credentials will apply to any universe or connection with the option “use database credentials” enabled.
Chapter 7:
Using Designer to Build a Basic Universe
NOTE Database credentials are new in XI Release 2. In earlier versions of BusinessObjects Enterprise, there was a check box in the connection parameters “Use BusinessObjects User Name And Password.” If you used the Import Wizard to migrate these universes to the new platform, you were prompted to create database credentials for each user. The following happens when a user tries to refresh a query: 1. The user supplies a BusinessObjects Enterprise user ID and password, in this example, Cindi/ASK. 2. The CMS validates the user ID and password against definitions in the BusinessObjects Enterprise repository and checks permissions. 3. When the user refreshes a document based on the Orders universe, the CMS checks which connection parameters to supply to the data source. For the Orders connection, the parameters are set to use database credentials. The database credentials for user Cindi are defined as U761358/ASK1. 4. When the Enterprise Connection Server connects to the orders data source, the user ID U761358 is passed through to the database.
C AUTION If you enable the use of database credentials for the universe, then all users who access this universe must have a unique login ID to the data source and the credentials must be defined via the CMC (see Chapter 13). If this is missing, users will receive an error when trying to refresh a query. In Figure 7-4, the user Sam does not have database credentials defined and would receive an error.
Scenario 2: Shared Login to the Data Warehouse As shown in Figure 7-5, many companies use a data warehouse environment rather than accessing data directly in an OLTP. The CMS repository tables may be physically installed on the same machine as the data warehouse tables or on a separate server. However, the table owners and the database instance used are most likely different. As users execute queries against the data warehouse, the connection to the database uses the same user ID and password, BOEnterprise/BOEnterprise.
PART II
FIGURE 7-4 Database credentials can be different from BusinessObjects Enterprise login IDs and passwords.
133
134
Part II:
A Better Universe
FIGURE 7-5 Universe connections can use a common database login for different BusinessObjects Enterprise users.
The workflow is similar to that in Figure 7-4; however, in step 3, the user name and password are stored as part of the universe parameters connection and shared by multiple BusinessObjects Enterprise users. Database credentials for individual users are not read.
Which Connection to Use in a Universe When you specify the user ID and password in the universe connection parameters, the administrator must understand how these IDs and passwords interact and carefully consider ease of use, security, usage tracking, and cost. • Ease of usage If database credentials are not defined correctly or if they become out of sync with passwords in the source system, users will blame BusinessObjects XI for being too difficult to use or not working. • Security If you define row- and column-level security in the source system, you may want to use database credentials to leverage that security. If, however, you are only concerned about access to reports in the repository or if you use the tools in Designer to control row- and object-level security, then you may want to use a common data source login.
Chapter 7:
Using Designer to Build a Basic Universe
• Cost Finally, another consideration in choosing between unique source system IDs or a shared one is your RDBMS licensing. If your license is by named user, then it may be more cost effective to use a shared database login for data access. You will still need to pay for the appropriate number of concurrent licenses. Designer also enables you to set how long a database connection remains active to keep concurrency against the data source low. • Performance Certain databases perform better when there is a shared login, while other databases, such as Teradata, prefer individual database credentials because of the way resources and memory are allocated.
TIP Always, always test your connection when changing a user ID, password, or database name. Just when you think you’ve typed it perfectly, you may find you’ve made a mistake, rendering everyone’s universe unusable!
Advanced Connection Parameters The Advanced Parameters of the Connection Wizard provide additional options that affect users during query execution. These options and their defaults will vary depending on which database you are using. The first three settings tell the Enterprise server what to do when a query is complete: • Disconnect after each transaction This option can make repeated querying for users appear unnecessarily slow as the login process is added to each data refresh. It does, however, keep the number of database connections open to a minimum. • Keep the connection active for NN This allows you to specify a time limit. If no additional queries are submitted to the database during that time, then the connection is closed. A good balance is to allow the connection to be active for ten minutes, as shown in the following screen.
PART II
• Usage tracking There are two levels of usage tracking in a BusinessObjects XI deployment: the first is within BusinessObjects Enterprise, and the second is at the database level. BusinessObjects Enterprise usage tracking will tell you which users access which reports and how long those queries are executing. However, you also may track usage at the database level to determine how frequently certain indexes are used and whose queries are most often doing full table scans. If you decide to use a shared login from BusinessObjects Enterprise to the source system database (Scenario 2, Figure 7-5), it makes it harder to control runaway queries. The DBA sees only one user ID (BOEnterprise) logged in to the database, even though it may represent hundreds of different end users. For this reason, many companies assign user IDs and passwords at both the BusinessObjects Enterprise and data source levels.
135
136
Part II:
A Better Universe
• Keep the connection active during the whole session This means user queries are never slowed down for the source system/data warehouse login and logout process. This is great for users but can become expensive for RDBMS licensing and Enterprise server overhead.
• Array fetch size This option determines how many rows of data can be shipped back to the client or Enterprise server in one fetch. Increasing the fetch size causes query results to return faster to the user; however, higher settings consume more memory. Response times are more greatly affected by network utilization and query performance. If you are experiencing slow fetches, try increasing the number by increments of 10. For example, in one scenario, increasing the array fetch size from 10 to 100 caused query results to return 25 percent faster. • Array bind size This is a new setting in XI. This affects how much data can be held in memory before being written to the repository. When the bind array fills, it is transmitted to the database. This setting seems to have a smaller impact on performance than the array fetch size but a larger impact on memory used by the WIReportServer process. • Login timeout This is also a new setting in XI; it relates to the universe connection to the data source (not between users and InfoView). As the BusinessObjects Enterprise Connection Server connects to the data source, the user ID and password in the connection parameters are passed to the data source. Busy data sources may have slow login times. This setting allows you to increase the number of seconds the Connection Server will attempt to log in to the data source before returning an error.
Asynchronous Connections Earlier versions of BusinessObjects allowed you to specify the connection mode as either synchronous or asynchronous. Earlier versions of Web Intelligence did not support asynchronous connections that would allow users to cancel their query. With XI, Web
Chapter 7:
Using Designer to Build a Basic Universe
137
Intelligence supports asynchronous connection to the data source by default; if a user cancels a query, that query gets cancelled (at an appropriate point) on the database.
Custom Connection Parameters The Custom Parameters enable you to make additional changes that are database specific and rarely used. Your DBA may suggest changing certain custom parameters. In Oracle, for example, Hints can tell the Oracle optimizer a more efficient way of executing queries. For the most part, the cost-based optimizer will automatically figure out the best execution plan. However, when this is not working optimally, the DBA may recommend inserting Hints.
To create a connection that you use in defining the universe parameters, 1. Select the Connections button on the toolbar or select Tools | Connections from the pull-down menu. 2. Click Add. 3. The Welcome to the Connection Wizard screen appears. Click Next. 4. You are presented with a list of Database Middleware types. For each type, you expand the folders to select a particular driver version. For example, to use Oracle 10, click + next to the Oracle folder, then Oracle 10, and then Oracle client. Click Next. 5. Enter the Login Parameters. For universes deployed through the CMS repository, the connection type is secured.
6. Tab to move to the Name box and enter a connection name. The name should be meaningful to other universe designers.
PART II
Creating a Connection Step-by-Step
138
Part II:
A Better Universe
7. Enter the user name and password to be passed through to the data source as discussed earlier in “Two Approaches to Login Parameters.” If you wish to pass through individual database credentials for each user, check the appropriate box. 8. Depending on the database type, select the name of the database and the name of the database server. Then click Next. 9. When prompted to test your connection, always select Perform A Test. This will tell you if you have incorrectly entered a login parameter. Click Next. 10. Confirm or modify the Advanced Parameters and click Next. 11. Confirm or modify any Custom Parameters and click Finish. 12. When you are returned to the list of connections, click Finish to close the Connection Wizard.
Designer Options There are a number of options in Designer that determine the appearance of tables in the universe pane, how your universe definitions are saved, and printed reports. These options are discussed in various chapters as they are used.
Database Options Settings on the Designer database options determine if your universe joins and objects are automatically inserted and interact with strategies as discussed earlier in this chapter. To access these options, select Tools | Options | Database from the pull-down menus.
• Extract joins with tables As you insert tables into the universe structure, this option will insert joins according to the strategies you set in the universe parameters.
Chapter 7:
Using Designer to Build a Basic Universe
139
• Detect cardinalities in joins When Designer detects cardinalities, it analyzes the number of rows in each table to determine where the one-to-one, one-to-many, and many-to-many relationships are. Checking this option for large databases can cause very slow structure creation (half an hour in some cases). As a default, I recommend leaving this option disabled and only explicitly detecting cardinalities while working on joins via Tools | Detect Cardinalities.
• Table and column values This is a useful feature to show you a sample of the data in your tables as you build objects in the universe. As a default, Designer will present you with the first 100 values in your database.
Quick Design Wizard Designer includes a wizard for building basic universes. Although you probably will not be able to use a universe created with the wizard “as is,” it is a useful tool for creating a universe quickly and becoming more familiar with universe components. In the following example, you will create a new universe based on the MS Access database Efashion.MDB that Business Objects provides as a sample. 1. To invoke the Quick Design Wizard, start Designer and choose File | New or click Quick Design Wizard.
NOTE If the wizard does not appear, check that your default settings enable the wizard. From the Designer menu, select Tools | Options. On the General tab, click the check box File/New Starts Quick Design Wizard. 2. The wizard will present you with a welcome screen that gives you an overview of the steps to build a universe. Click Begin to proceed. 3. Give your universe a meaningful name such as Test Fashion. This is the name that users will see when selecting a data source for a report. 4. Click New to create a new connection to a data source connection or use the dropdown list to select an existing connection. 5. Click Next to proceed to Step 2 of the wizard, Create Initial Classes and Objects. In this step, you select either the full tables or individual data columns that will become universe classes and objects, respectively. By clicking the + sign next to the table name, you can choose individual columns from the table that will become objects. You may find it easier initially to add all the columns and delete the individual ones you don’t want. Hold down the CTRL key while clicking the following three tables: ARTICLE_ LOOKUP, CALENDAR_YEAR_LOOKUP, and OUTLET_LOOKUP. In this step, you only want to select dimension tables, not fact tables that are used for measure objects.
PART II
• Create default classes and objects from tables This is helpful during rapid development and testing but less than ideal for larger schemas. As you insert a table into the universe structure, objects are automatically created based upon each field in the table. Clearly, users will not need access to a number of key fields. Additionally, your column names in your data mart must be based on business terminology, and even then, you will still need to delete a lot of extraneous objects and move them around to more meaningful classes. Therefore, leave this option disabled.
140
Part II:
A Better Universe
6. Click Add so that elements from these three tables become universe classes and objects as shown in the following example. If you click the + sign next to any of the individual classes, you will notice that Designer has added all the columns in each table with a blue box next to the item to denote a dimension. These symbols and object types are discussed further in Chapter 9.
7. Click Next to proceed to Step 3 of the wizard, in which you select objects that become measures. A measure is often referred to as a “fact” in a fact table in a data warehouse. It is numeric data that business users wish to analyze by different dimensions. In BusinessObjects XI, measures generally include a SQL aggregate function such as COUNT or SUM. These are also discussed further in Chapter 9. For now, click the + sign next to the table SHOP_FACTS, select MARGIN, AMOUNT_SOLD, and QUANTITY_SOLD, and then click Sum. Notice that the wizard will add a measure object with a pink circle or sphere before each of these fields. At this point, you also could create Count objects to count products or customers.
Chapter 7:
Using Designer to Build a Basic Universe
141
PART II
8. Click Next to proceed to Step 4 of the wizard. In this step, the wizard tells you how many classes, objects, and joins your initial universe contains. Click Finish to exit the wizard and view the universe in Designer. 9. Click File | Save from the pull-down menu or click the Save button on the toolbar to save your universe.
NOTE In earlier versions of Designer, if your universe name was longer than eight characters or contained spaces, you would have been prompted for a filename different from the universe name. This is no longer the case in XI, which will automatically use the long universe name as the filename. 10. For other designers or end users to see this universe, you must export it to the repository. From the Designer pull-down menu, select File | Export. Congratulations! You have just completed your initial universe. If only a real business universe could be this easy!
142
Part II:
A Better Universe
Summary This chapter introduced the Designer interface and parameters that affect how you build your universe. A number of the parameters determine what users can do when building queries and how the SQL is generated. Universe connections affect query performance and interaction with the physical data source. While universe parameters affect the current universe, connections apply to all universes that use that connection.
8
CHAPTER
Universe Joins
J
oins define how two tables relate to one another. In Designer, your strategies (under File | Parameters) can automatically propose joins based on common names between two tables. Alternatively, you can manually define the joins. Most of the complexities around joins occur when your universe contains multiple star schemas or when you are using BusinessObjects XI against a normalized transaction system.
Join Graphics In Designer, you can change the appearance of the join lines and the symbols used to display relationship cardinalities. You also can have Designer provide you with additional information that will help you create or modify the joins more accurately. These settings will apply to all universes (unlike parameter settings reviewed in Chapter 7 that are universe specific). Figure 8-1 shows the database structure for a sample Oracle Sales History (SH) database. A number of the graphic settings have been changed to make the structure easier to read. To display this information in all universes, select Tools | Options | Graphics from the Designer menu.
143 Copyright © 2006 by The McGraw-Hill Companies. Click here for terms of use.
144
Part II:
A Better Universe
Arity or three-legged stool shows one to many relationship
Column formats must be the same between join columns
An ellipsis indicates more columns
Row count shows fact tables are usually larger than dimension tables
Key fields are underlined
FIGURE 8-1 This sample Oracle sales history universe shows table sizes, key names, and cardinalities, useful information in defining joins.
The Join Shape settings determine how you would like the join lines drawn. This is purely personal preference and does not affect your universe design. The Arrow join shape is the least helpful, as it does not provide any information about the cardinality of the join. Use either Arity or 1,n. Arity will give you a crow’s foot for a many relationship, and 1,n will display numbers. The Best Side check box merely has the line drawn from the side of the table that will make your entity-relationship diagram appear less busy and easier to read. Table 8-1 summarizes other graphics options.
NOTE Key info is not extracted for the sample MS Access databases, so changing your parameters or display option has little effect. It does, however, work correctly for Oracle and SQL Server databases.
Chapter 8:
Universe Joins
Purpose
Default number of columns
For tables with many columns, Designer will display the first n columns in the structure pane and use an ellipsis to indicate that more columns exist in the table.
3-D Effect
Displays a shadow box around the table name.
Aliased Name
Aliases are described later in this chapter, in the section “Aliases.” This check box will allow you to see both the alias name used in the universe and the physical table name in the underlying RDBMS.
Show Row Count
This option works only when you have separately extracted the row counts for each table (View | Number Of Rows In Table). The row count will display the actual or expected number of rows in each table, useful for determining join order and outer join issues.
Show Format
Show Format will display the format of the column: C for character D for date N for number T for long text L for lob—all large binary objects (blob, clob, bfile, nblob in Oracle) Join fields are either character, date, or number. Most databases do not allow you to join between two columns that are in different formats, even if the values are the same. For example, if the ARTICLE_ID in SHOP_FACTS is character and ARTICLE_ID in ARTICLE_LOOK_UP is numeric, the database will return an error during query execution and/or when you select Parse in editing the join statement. During the universe integrity check, quick parsing will not reveal this error, but thorough parsing will. Therefore, use thorough parsing.
Underline Keys
Joins between two tables are usually between key columns. For Designer to underline which columns are keys, check this box, and in addition, extract the key information via your strategies (see Chapter 7). Select the File | Parameters | Strategies tab. In the Join box, select All Matching Column Names. Note that the first join strategy does not include key info. If Designer does not underline the key names in the structure pane, refresh your database structure by selecting View | Refresh Structure.
Left Justified or Centered
Left Justified and Centered affect the appearance of whether the column names are left aligned or centered beneath the table name in the structure pane.
TABLE 8-1 Designer Graphic Options Used in the Structure Pane
PART II
Option
145
146
Part II:
A Better Universe
Show Row Count Extracting row count information requires a full table scan against each table. It can be slow to generate this information for fact tables that contain millions of rows of data, as it does a SELECT COUNT(*) against the table. Therefore, when you turn on the option to display the row counts, Designer does not automatically fetch these numbers. To fetch the numbers, ensure that your mouse is not on any one table, and then select View | Number Of Rows In Table. Designer will ask you if you want to set or detect row counts for all tables. Click OK. Select Refresh row count for all tables, as shown here:
The Modify Manually Tables Row Count option allows you to enter manually the number of rows for an individual table. This can be useful if you are working with test data and you want to enter expected rows or if you know the approximate row counts for large fact tables and you do not want to wait for Designer to extract this information. The row count information is used in two ways: First, it helps you as the designer understand when you are joining large tables together. Second, when generating the SQL for a query, the SQL generated will list the largest table first in the FROM section of a SQL statement to make queries run faster. Databases that do not have an optimizer will benefit from careful ordering of tables in the SQL statements. Databases such as Oracle and DB2 have an optimizer, so there is no need to spend time modifying row counts (unless you are using the rule-based optimizer). The row count information works in conjunction with the REVERSE_TABLE_WEIGHT parameter in the database.prm file. By default, this parameter is set to Y to list tables largest to smallest. If you wish to have smaller tables appear first in the FROM section of the SQL statement, set this parameter to N.
Basic Joins Once you have set your graphics options, you can begin modifying or creating basic joins. Displaying the joins in list mode can be helpful in determining the order of the tables in the join statement as well as seeing long join statements. Click the View List Mode button on the toolbar or select View | List Mode from the pull-down menus.
Chapter 8:
Universe Joins
147
Referring back to the Test Fashion universe you created in Chapter 7, the universe has three basic joins: • From SHOP_FACTS to CALENDAR_YEAR_LOOKUP • From SHOP_FACTS to ARTICLE_LOOKUP • From SHOP_FACTS to OUTLET_LOOKUP
View List Mode button
Double-click the join line or statement to modify it
There are several ways to modify the join statement: • Double-click the join line in the structure pane. • Double-click the join line in the join list. • Manually enter changes in the formula bar.
NOTE To display the join statement in the formula bar, select View | Formula Bar from the pulldown menus.
PART II
The arity or three-lined “crow’s foot” indicates that the relationship between SHOP_FACTS and ARTICLE_LOOKUP is one to many. For every one article in ARTICLE_LOOKUP, there may be one or many sales transactions in SHOP_FACTS (for example, blazers can sell one or more times). View List Mode gives an overview of all join statements, as you can see here:
148
Part II:
A Better Universe
Modify the join between SHOP_FACTS and ARTICLE_LOOKUP. You are presented with the Edit Join dialog box. Keys are often used in joins. If your keys are not underlined in the structure pane, check File | Parameters | Strategies and refresh the structure.
Table1, SHOP_FACTS, appears on the left-hand side, and Table2, ARTICLE_LOOKUP, on the right. In some RDBMSs, which table is right or left does not matter, but in others, it can affect how quickly a query is processed. When Designer proposes joins via the Quick Design Wizard, it puts the tables on the side in which they appear in the structure pane. Thus in the preceding example, Shop_Facts is Table2 for the join to Calendar_Year_ Lookup but Table1 for the joins to Article_Lookup and Outlet_Lookup. This order may result in faster queries for certain databases, particularly for joins other than equi-joins (BETWEEN, >=, >!, =).
NOTE When Oracle uses the cost-based optimizer, the order of the joins and the order of the tables in the FROM section of the SQL does not matter. However, if you are using the rule-based optimizer, it does. The first drop-down box lets you define the join operator:
Chapter 8:
Join Operator
Universe Joins
149
Explanation
=
Equi-join. This is the most common and default join type. Two tables are related when every data value in the left table has an equivalent value in the right table
!=
Not equal
>
Greater than
=
Greater than or equal
> button to access the full Select statement and SQL functions. The functions here relate to your specific database. The SQL Editor and popular functions are discussed further in Chapter 11. 5. In the Functions column, click the + sign next to Number functions. Scroll to the Sum() function and double-click to add it to the Select statement.
PART II
2. Designer will present you with the same dialog boxes as when modifying objects. Enter the name Promotion Cost and set the object type to Number.
202
Part II:
A Better Universe
6. Ensure your mouse is positioned in the middle of the Sum parentheses in the top box. In the Tables and Columns box, click the + sign next to the table PRODUCT_PROMOTION_FACTS to find the column PROMOTION_COST. Double-click to add this field so that the SQL appears as follows: sum(product_promotion_facts.promotion_cost)
7. Click Parse to check that your SQL is correct.
TIP You can wait to parse all objects when checking the universe integrity, but it is easier to diagnose problems if you parse objects as you build them. Parse will verify that the SQL statement contains the correct syntax and that the object type matches the database field type. 8. Click OK to save your Select statement and return to the Definition tab. 9. Select the Properties tab and verify that the object qualification is a measure. The default qualification is Dimension, but this should have changed automatically when you selected the Sum function.
10. Verify that the projection aggregate is set to Sum. The default projection aggregate is interpreted from the SQL aggregate. 11. There is no reason to have a list of values for measure objects, so leave the option Associate A List Of Values unchecked.
Chapter 9:
Classes and Objects
203
12. Click OK to save your object changes. 13. Click Save to save the changes made to the universe.
About Aggregates Two forms of aggregates are involved in a measure objects: SQL functions and projection aggregates. Users can create a third aggregate called calculations within individual reports.
SQL Aggregates
C AUTION Always use a SQL aggregate on a measure unless it involves a unit price or something similar; otherwise, you risk overloading your servers, network, and client PCs.
FIGURE 9-4 SQL Sum and GROUP BY aggregate individual rows by common dimensions, reducing the number of rows of data sent to the Enterprise Server.
PART II
SQL aggregates such as SUM, MIN, and MAX require a GROUP BY clause that the query engine automatically includes in each SQL statement. Refer back to Figure 9-2. There are 23 rows of data in the sample fact table. If I select debits and credits without the SQL SUM function, then my report will display 23 rows. If I use the SUM function and request only debit and credits by day, SQL will group the debits and credits for each day. For example, there are four detail entries for September 12, 2002, in Figure 9-2. SQL sums these into one entry for September 12, as shown in Figure 9-4. With the SUM function, Figure 9-4 shows 10 rows of data compared to the physical 23 rows from Figure 9-2. Failure to use SQL aggregates correctly can unnecessarily cause millions of rows of data to be sent across the network. In this example, the number of rows returned to the client workstation or to the Enterprise Server has gone from 21 to 10 through use of a SQL aggregate function. In a real-world example, this could be the difference between returning a few rows or millions of rows of data to a client.
204
Part II:
A Better Universe
FIGURE 9-5 Projection aggregates affect the number of rows displayed in a report but do not affect the number of rows retrieved from the database.
Projection Aggregate The second form of aggregate is the projection aggregate, used in multidimensional analysis and when users remove dimension columns from a report or chart that still exist in the results set. In the following example, I have deleted the Date object from the report display but not from the query itself. There are still ten rows in my result set. In Figure 9-5, Web Intelligence now does the grouping in the report to yield one row of data for the entire month of September. As a general rule, the SQL function you use will match your projection aggregate used on the individual object properties. As discussed earlier in connection with measures, price is one measure in which designers may not use a SQL aggregate; however, it would be useful to set the projection aggregate to Avg to allow further analysis. With inventory and ending balance, I recommend using the SQL SUM function but then setting the projection aggregate to None.
Object Formats Object formats determine how data is initially formatted within a report display. Users can override any of the default formats by formatting individual cells within a report. Using object formats, the universe designer can centrally define a format that includes number, alignment, font, border, and shading. Object formatting is often overlooked, and the fact that the Object Format dialog is somewhat hidden in the pop-up menu rather than in the Edit Properties dialog makes it all the easier to forget object formatting. However, for certain objects and formats, you can save hundreds of users time by applying these formats once, rather than by each user in each report. Also, if you intend to display hyperlinks in a report (discussed further in Chapter 11), you need to format the object to read as HTML. In the following example, you will change the object format for Promotion Cost to include dollar signs with no decimal places. 1. From the universe pane, expand the Test Fashion Measures class by clicking the + sign. 2. Select the object Promotion Cost. 3. Right-click to access the pop-up menu and select Object Format or choose Edit | Object Format from the pull-down menu.
Chapter 9:
Classes and Objects
5. Click OK to apply the formatting changes and then close the dialog box. Many of the formats you can apply in Designer are also available to end users within Web Intelligence and Desktop Intelligence. The various options are discussed further in Chapter 21.
PART II
4. Select the Number tab and specify the desired format. For many numeric fields, in particular, key or ID fields, set the number format to drop the decimal place.
205
206
Part II:
A Better Universe
Summary Classes and objects act as the user interface to the physical columns in the data source. Designer provides three different types of objects (measures, dimensions, and details) to help users differentiate between types of information more easily. This chapter covered the basics of building different kinds of objects and highlighted some important design principles: • Point dimension objects to lookup tables. • Always use SQL aggregates on measure objects. • Sort dimension objects from biggest to smallest to facilitate drill-down. • Follow the four Cs in naming objects (customer-oriented, clear, consistent, concise). • Ensure object types and data field types match the type in the physical database. Following these principles will make your universe powerful yet ensure users consistently get correct results. In Chapters 10 and 11, you will add even more intelligence to the objects.
10
CHAPTER
List of Values
T
he list of values is a powerful feature that allows users to select from a pick list when setting conditions in a query. You as a designer determine which objects have lists of values via the object properties. Because users can select conditions from a list of values, they do not need to enter conditions manually and therefore do not need to memorize lists of codes or guess how many leading zeros there may be in a particular field. Designer allows you to customize the default list of values even further to present meaningful names with the codes or to shorten particularly long lists into a more manageable size.
How List of Values Works When a user adds a condition to a query, BusinessObjects XI essentially launches a second query and returns a list from the dimension or lookup table in the RDBMS, as shown in Figure 10-1. In the following example, the user has a condition on City (1). To be able to pick from a list of city names, the Enterprise Server will query the data source for a list of valid cities (2). A list of cities is displayed to the user (3), and the user selects London (4). The list of values ensures the query condition is valid and in the correct syntax, such as London as opposed to LONDON. When you are working in Designer, this list of values query file exists as an object.lov file, where object is the list filename specified in the object properties. This same file is used for Desktop Intelligence and is stored under C:\Documents and Settings\user\Application Data\Business Objects\Business Objects 11.5\universes\Enterprise Server Name\folder\universe
When Web Intelligence users access a list of values, the .lov file is cached as part of the user session on the Web Intelligence Report Server. The name of the file is no longer object.lov but rather is a system-generated filename. Designer automatically creates these query files whenever a universe designer enables a list of values on a universe object and the user requests a list of values for adding a condition to a query. Unless a designer customizes the list of values, the SQL generated is always SELECT DISTINCT Table.column FROM Table
207 Copyright © 2006 by The McGraw-Hill Companies. Click here for terms of use.
208
Part II:
A Better Universe
FIGURE 10-1 A list of values query is associated with an object in the universe. It queries the dimension tables to present users with a pick list for conditions.
Notice that the query engine adds a DISTINCT keyword to all list of values queries. This ensures that users receive only a single row for each distinct value. For example, a Customer dimension table may have multiple rows for each customer ID as changes to customer information are kept and time-stamped. In setting conditions in a query, users will need to see the unique customer ID only once. The use of the DISTINCT keyword is sensible from a user-functionality point of view, but it clearly has an impact on query response time when your list of values is directed to a large fact table.
TIP You can change the default setting for a list of values to use a GROUP BY rather than DISTINCT. This parameter is universe specific and is set by selecting File | Universe Parameters | Parameter tab. Set the value DISTINCT_VALUES=GROUPBY. See the section “Parameter Tab” in Chapter 7 for more information.
Chapter 10:
L i s t o f Va l u e s
209
While the file storage location is different, the process to generate the list of values in Desktop Intelligence is similar to that in Web Intelligence. When users add a condition to a query, they must select an operand, as shown here:
PART II
Users can either manually enter the value for the condition or select the operand Value(s) From List (Figure 10-1, Step 1). This operand will send the object.lov query to the dimension table in the RDBMS (Step 2). The RDBMS sends the query results back to the Web Intelligence Report Server (or client for Desktop Intelligence) (Step 3). Users then select which condition value(s) they want in the original query condition (Step 4). When the user launches the main query, the .lov query is no longer involved. Also, if a user selects the operand type Constant and manually enters a filter value, then the .lov query is not involved. Once the user session has ended, the .lov file is no longer available, unlike in Desktop Intelligence, which permanently stores the object.lov file. For this reason, you as the designer must be particularly cognizant of long lists of values that are slow to generate. With BusinessObjects 6.5 and earlier, the way the repository was structured made exporting pregenerated lists of values to the repository exceedingly slow. A binary query file had to be extracted from the relational repository and rebuilt in the file system. With XI, when you export the universe and lists of values to the repository, it’s primarily copying files to the file system, a significantly faster operation than in 6.5. With this change in architecture, then, long-time Business Objects customers have an opportunity to rethink their approach to lists of values. Designers can customize the object.lov query to shorten long lists of values. For example, if you have millions of products, you may want to prompt users first to select a product category, in what is referred to as cascading lists of values. If the users do not know the codes or spellings of the product categories, for example, then BusinessObjects XI may first launch a prodcat.lov query. In this respect, Steps 2 and 3 may be repeated multiple times until the user finally selects values to add to the query in Step 4. The size of the object.lov files also may change over time as the number of products changes or as users select different product categories.
210
Part II:
A Better Universe
NOTE If you are a long-time Crystal user, you will note that the approach to lists of values in the universe is quite different from the Crystal Reports approach. Crystal Reports historically has had static lists of values (parameters) that were stored with the report and could not be cascaded. BusinessObjects, meanwhile, has long had dynamic lists of values that are stored with the universe. Crystal Reports XI also now supports dynamic lists of values and cascades via Business Views.
List of Values Settings When you first create an object, Designer enables lists of values by default and assigns a name based on the object name. In the following example, you will explore the settings for the Month Number object that you used in Chapter 9: 1. Click the Time class and expand the folder by clicking the + sign. 2. Double-click the object Month Number to modify the object properties. 3. Select the Properties tab. Notice that the check box Associate A List Of Values is enabled. By default, this check box is enabled on all dimension and detail objects.
4. You can accept Designer’s default List Name, or you can modify the name to be more meaningful. In this case, change the List Name to MONTHNN.
TIP I prefer to change the List Name, as it helps when using the same list of values for multiple objects. It also helps when you need to use Windows Explorer to clean up the .lov files on your local disk or verify the file size of a customized list. 5. The check box Allow Users To Edit This List Of Values is checked by default. Table 10-1 explains the purpose of each of these check boxes.
Chapter 10:
L i s t o f Va l u e s
Explanation
Allow users to edit this list of values
This is allowed by default. This option lets Desktop Intelligence users create their own custom lists, adding whatever filters, sorts, or personal data files they find most useful. I have rarely seen this used, even by power users. The main caveat here is that if the designer customizes and exports a .lov file, the universe .lov will overwrite the user’s .lov, regardless of which is more recent.
Automatic refresh before use
This should rarely be checked and only for those objects in which the dimension information changes frequently. Otherwise, the users can easily refresh lists of values by request. Particularly with large dimension lists or slow RDBMS response times, it is important not to force an automatic refresh. However, if your company has recently gone through a major reorganization, or there have been a number of RDBMS changes that would cause old lists of values on Desktop Intelligence users’ folders to be out of date, you may want to enable the automatic refresh for a defined period. For Web Intelligence users, the lists are always refreshed for each session.
Hierarchical Display
When you customize a list of values to display additional levels in a hierarchy, this lets users drill within the hierarchy to select their condition. When the list is cascaded, this option ensures a more intuitive interface.
Export with universe
This box should be checked only when the designer has customized the list of values with the universe, the list of values is slow to execute, or the acceptable values come from a personal data file or other source to which users may not have direct access.
TABLE 10-1 List of Value Settings
6. Click Display to see the same list of values that users will see when using them in a query. 7. Click OK to return to the Object Properties panel. 8. Click OK to close the Object Properties panel.
When to Disable LOVS By default, lists of values are enabled on all dimension and detail objects, but there are instances in which it is better to disable them by removing the check from the check box Associate A List Of Values.
PART II
Option
211
212
Part II:
A Better Universe
Nonindexed Fields One would think that if you have disallowed an object to be used as a condition (select Edit | Object Properties and then click the Advanced tab), that would automatically remove the list of values functionality from the object. It doesn’t. So for many of the same reasons that you disallow an object to be used as a condition, you also may not want to associate a list of values. If the field is not indexed, you may not want to associate a list of values. For example, let’s assume that Customer Name is an object whose source system field is not indexed. It is still allowed as a condition because you want users to be able to search for all customers that start with the name Deloitte & Touche. Ideally, you want Customer Name to be used only for wildcard searches and you would rather they use Customer Code as a condition, since it’s indexed. In this case, allow the list of values on Customer Code and disable it on Customer Name. “Unfriendly!” you say? Read the upcoming section “Simple Customization.” You can still help users pick their customer codes according to customer name, but through a customized list of values that gives better query performance (user friendly!).
Details Rarely will users want to use details as conditions in queries. For example, when users are looking for customer sales, do they use detail objects such as street address or phone number for the exact condition when it’s unknown to them? No. If they know the phone number, they may use it as a condition, but then they are usually entering the phone number manually, not choosing it from a pick list. However, if you look at the sample eFashion universe, it makes a lot of sense to allow a list of values for the object ZIP code, even though it is a detail object. I would recommend customizing it to display the state; I would also have ZIP code as a dimension object, not a detail (refer to Chapter 9) so that users can drill by it.
Simple Customization A simple customization may involve adding a meaningful description next to the code or adding a prompt to shorten a long list. Each customization has three main steps: 1. Associate a list of values with an object. 2. Add additional information or conditions. 3. Export the customization with the universe.
NOTE With XI Release 2, some of the customizations that you did before may no longer be necessary. For example, if you customized ID fields to include a description and forced query filters to use the ID fields for query performance reasons, the use of keys (as explained in Chapter 9) may be a preferred approach when the ID fields are not meaningful to the end users. Keys initially were leveraged only by Desktop Intelligence, but in XI Release 2, Web Intelligence also now takes advantage of them. As of Service Pack 1, however, use of these keys was problematic so do reevaluate before using. Similarly, to create a cascaded list of values in earlier versions of Designer, you had to modify multiple lists of values. New in XI Release 2 is the ability to define the cascade in one place. With these changes, reconsider your design practices.
Chapter 10:
L i s t o f Va l u e s
213
Adding a Description Object to an ID Object Some codes may have a logical meaning with which users are familiar. For example, many accountants know the meaning of certain account ranges. Power users also may know a number of account, product, and customer codes. However, in many cases, the codes are meaningless and users will only ever want to use names or descriptions as conditions. However, filtering queries on nonindexed description fields can result in slow queries. Customizing the list of values for ID fields meets both the users’ need of seeing a description while also ensuring that the query is filtered on an indexed field. You also may want to include additional dimension objects in your list of values to facilitate sorting. Figure 10-2 shows that it may be meaningful to add Country, Region, and City to the Customer Id list of values.
PART II
FIGURE 10-2 Customers reside in cities that are part of countries. Displaying country information along with customer ID makes for a more meaningful pick list.
214
Part II:
A Better Universe
Associating a List of Values In the following example, you will use the Island Resorts Marketing or BEACH universe. To ensure you do not affect the original universe, import the universe from the repository (choose File | Import and select Island Resorts Marketing). Then select File | Save As and enter the new name: Test Island Resorts Marketing. The sample universe includes a Customer Name object. You will create an object that accesses an ID field that is indexed, and then customize the list to include a description. Later, you will also customize this same list to display the customer’s country and city. 1. Select the Customer class. 2. Select Insert | Object or click Insert Object. 3. Replace the default object name OBJECT1 with Customer ID. Complete the Description and SQL Select fields shown next:
4. Click Apply.
NOTE If you navigate to the Properties tab before selecting Apply, Designer does not update several settings and you may get an error with subsequent steps. 5. Select the Properties tab. 6. Change the list name to CUSTID.
Chapter 10:
L i s t o f Va l u e s
215
7. Click Display. If the list is blank, click Refresh. Note in the illustration that you are presented with a fairly meaningless list of codes to which you want to add the customer name. 8. Click OK to return to the Object Properties tab.
Adding More Information
1. From Object Properties, select the Edit button to edit the list of values. Designer presents you with a standard query panel. For more information on using the query panel, refer to Chapter 20. 2. Click the Customer class to expand the list of objects. 3. Drag the Customer (CUSTOMER.NAME) object to the right of the new Customer Id object. 4. The Customer Id has no sequence that is meaningful to users, so add a sort on Customer so that the names are sorted in alphabetical order. While Customer is still selected in the Result Objects, click the Sorts icon. The final query definitions should appear as follows:
PART II
Now that the object has an associated list of values, you can modify the .lov query file to include an additional column of information.
216
Part II:
A Better Universe
5. Click OK to return to the Edit Properties of Customer ID panel. 6. Click Display and then Refresh to see the results of your customized list of values. Set the view to Tabular View (these views are explained later under “Tabular vs. Hierarchical Views”). This is what users will see when accessing the list of values:
7. Click OK to close the list of values display and return to the Properties tab. 8. If you are satisfied with your customizations, enable the check box Export With Universe and click OK.
NOTE When you enable the check box Export With Universe, the customized list of values is not immediately exported as a separate element of the universe. Instead, you only have told Designer to export the .lov query file to the repository along with the universe whenever you next choose File | Export.
Purging Data from a List of Values Now that you are satisfied with the customization, you are ready to export the list of values with the universe. When you clicked Refresh in Step 6 of the preceding section, your list of values query executed and the actual customer IDs and names became part of the .lov file. In earlier versions of BusinessObjects, exporting the data with the .lov file was generally a bad thing for performance reasons. With XI, the decision to include the data has more to do with relevance (particularly if it is a cascaded list of values as described in the next section) than performance. If you do not want this data exported with the query definition, follow these steps to purge the pick list data and ensure only the query file gets exported: 1. From the pull-down menu, select Tools | Lists Of Values | Edit A List Of Values. 2. Expand the Customer class by clicking the + sign.
Chapter 10:
L i s t o f Va l u e s
217
PART II
3. Select the Customer ID object and click Purge. 4. Click OK to close the dialog.
Cascading Lists of Values The customer table in the Island Resorts Marketing universe is quite small (35 rows); however, for many real-world data warehouses and OLTP systems, the customer tables and product tables are fairly large. For this reason, universe designers should customize the list of values to shorten the number of rows presented to the user by adding a prompt. This is often referred to as a cascading list of values because two lists are linked to one another. There is no fixed limit to how many rows are reasonable; it’s more a question of reasonable response time. For lists of values, aim for seconds, not minutes, or users may incorrectly assume the system is down.
NOTE For Web Intelligence users, the list of values displayed is “chunked” according to the list of values batch size setting for Web Intelligence Report Server. For example, in Figure 10-3, the list of values batch size is set to 1000. This means that even if your list of values returns 2000 values, the user is presented with the first 1000; to get to the next set of 1000 values, they request the next page. When cascading your list of values, you must first be familiar with the dimension tables, how they relate, and which level of prompts will give a good response time without annoying the users. If a user is simply trying to find a customer code, the user does not want to be asked five questions in advance to arrive at the customer code; one or two levels of cascades should be the most you do. Whenever possible, strive to display more columns of information in the original list of values rather than adding a prompt as your first choice. The goal of the prompt is to shorten your list to guarantee a reasonable response time and navigable size; the goal is not to generate the smallest list possible.
218
Part II:
A Better Universe
FIGURE 10-3 List of values behavior is affected by Designer customizations but also by Web Intelligence Report Server settings.
For customers, you may shorten the list by adding a prompt for customers beginning with a certain letter or a cascade for customers residing in a certain city or region. In looking at the sample data in earlier Figure 10-2, for example, you may want to prompt the users to filter the customer ID list according to customers who reside within a particular country. For individual products or SKUs, including a filter on product category or line of business brings the list of values to a more manageable size. In the following example, you will continue to work with the Customer Id object. First, study the dimension data. In looking at earlier Figure 10-2, notice which city and country each customer resides in. Additionally, each country is divided into multiple regions within the country; if your business users had not specifically told you this or if you had not studied the dimensional data, you may have incorrectly assumed that Region referred to World Region (such as North America, Europe, and so on). Ideally, users will tell you which customizations they want, but for them, the choices may not be clear, and the business definitions may not be obvious; it’s up to you as the universe designer to give them your best guess for the friendliest, fastest customization.
Chapter 10:
L i s t o f Va l u e s
219
Next, look at the tables involved, as shown in Figure 10-4. If you decide to prompt the users on Country of Origin, then four tables will be joined together to present the shortened list of Customer Ids. In this demo example, the tables are small, so the joins are not a problem. In a production implementation, carefully evaluate the impact on response time when your list of values customization involves more than one table. At this point, also see if a shortcut join is available, for example, to shorten the list of product IDs according to which plants make the products (see Chapter 8). Prompting on City may result in a faster query, but it may not make sense from a business viewpoint if managers are organized by country. To cascade the list of values from Country to Customer ID:
2. When selecting values to cascade, position them from highest to lowest level of detail: in this example, from Country to Customer ID. 3. In the Available pane, expand the Customer folder and select Country of Origin. Click > to add it to the pane on the right.
4. Select Customer ID and click >. Once you add an additional level in the hierarchy, notice that Designer automatically now includes Prompt Text for Country of Origin. 5. Click Generate LOVs.
PART II
1. From the pull-down menus, select Tools | List Of Values | Create Cascading Lists Of Values.
220
Part II:
A Better Universe
FIGURE 10-4
Adding Country as a prompt in the Customer Id list of values involves four tables.
TIP Whenever you create a cascaded list of values, always check the Hierarchical view for a more intuitive list of values, described more fully in the later section “Tabular vs. Hierarchical Views.”
How the Cascade Works If you go back and preview the Customer Id object, you will see that Designer has changed several settings. If your cascade also included other levels within the hierarchy such as region and city, the list of value settings for those objects also will have been modified. It’s important to understand how the steps in the preceding section affect individual object settings, because if you ever wish to go back and change a cascade, you must do so manually, as described in this section. Further, if you implement a cascade after you have implemented other customizations, the cascade will overwrite those other customizations. Select the object Customer Id and double-click to bring up the Edit Properties box. To manually modify the list of values for the Customer Id object: 1. Select the Properties tab. 2. Select Edit to modify the CUSTID.LOV query and display the query panel. 3. Notice the object Country of Origin in the Conditions box.
Chapter 10:
L i s t o f Va l u e s
4. Click OK to close the query panel. 5. From the Object Properties dialog, click Display in the bottom right and then Refresh from the List Of Values dialog. You will be prompted to choose a country before you can see the newly filtered set of customer IDs. 6. You may either click Values to choose from a list of countries or enter France and click OK. Notice how much smaller the list of Customer IDs is now compared to the list in Step 6 under the earlier heading “Adding More Information.”
PART II
Adding a prompt here creates a cascade
221
222
Part II:
A Better Universe
7. Select OK to close the list of values. 8. Once you are satisfied with your customization, verify that the check box Export With Universe is enabled. When you create a cascaded list of values through Tools | Lists Of Values | Creating Cascading Lists Of Values, this option is set for you. 9. Click OK to close the Object Properties dialog.
Tabular vs. Hierarchical Views There are two check boxes for Hierarchical view, and they have different behaviors in Web Intelligence and Desktop Intelligence. Let’s start with a simple recommendation.
TIP Whenever you create a cascade, leave the option Hierarchical View enabled. Whenever you manually customize a list of values to either add a filter or add additional columns of information, choose the Object Properties Hierarchical Display as described in Table 10-1. For Web Intelligence users, the Hierarchical Display is most intuitive. For Desktop Intelligence users, there is little impact.
Hierarchical Display in Web Intelligence When a Web Intelligence user refreshes a query that contains a cascaded list of values, the list of values is grouped according to the hierarchy of the higher-level prompts as shown in the following screen. Users see only one prompt for Customer ID. When the list of values is exported with Hierarchical Display enabled, the cascade or initial prompt on Countries is embedded within the list of values. Users click the + to expand or collapse the individual countries.
One prompt
Expand or collapse the hierarchy
Chapter 10:
L i s t o f Va l u e s
223
Without Hierarchical Display enabled, the prompting and list of values are far less intuitive. Compare the following screen with the former. Notice that without the Hierarchical Display there are two filters in the top prompt box. To see individual customer codes for any given country, users must first specify the value there and refresh the list of values for a country. Then they must position their mouse on the customer ID prompt and refresh that list to get a subset of the list of customer IDs within France. A similar workflow is followed with Desktop Intelligence reports that contain cascaded prompts. 1. Refresh Country list 2. Choose Customer Id
PART II
Two prompts
NOTE The way Web Intelligence caches cascaded list of values is significantly different from how a regular list of values is cached. For example, in the preceding screen, each query refresh that uses the list of values for customers in France forces a regeneration of the list of values for those customers. Noncascaded list of values, however, use a cached pick list. Therefore, it’s important to compare the performance impact between a long list of values that is cached and a short list of values that is not cached.
Hierarchical Display in Desktop Intelligence With Web Intelligence, the hierarchical display corresponds to the prompts. With Desktop Intelligence, it does not. Instead, it corresponds to the result objects that are part of the list of values. In both the preceding screenshots in Web Intelligence, there were additional result
224
Part II:
A Better Universe
objects in the pick lists. These were displayed in a tabular format. However, in Desktop Intelligence, users see the list shown to the right. In order for the hierarchical view to work correctly in Desktop Intelligence, the result columns must be in a particular order. The list of values object must always be the first column. If the object is an ID or Code object, it would be intuitive if the description were the second column; but it’s not! After the base object, the result objects run from left to right, with the leftmost object being the top of the hierarchy and the description or most detailed object being on the right side of the query. Each of the objects should have a corresponding sort order. To continue with the customer example, Customer Id is the object whose list of values you are customizing. In the following screen, this is the leftmost object. Country of origin is the top of the hierarchy and appears second. Country of origin is the primary sort order. Base object whose values you want in the condition is the first column
The top of the hierarchy
The lowest detail
It is important to sort the objects according to the hierarchy levels, or the drill-down may appear nonsensical. Now when users request to select a list of values, they can scroll through the possible values by drilling down through a hierarchy. I have two complaints
Chapter 10:
L i s t o f Va l u e s
225
with the Desktop Intelligence Hierarchy view: first, it does not work particularly well with code/description customizations. I would like it if the final drill-down displayed both the code and the description. Second, when you do this kind of “wide” customization, it is not easy for Web Intelligence users to see the wide list of values. They can only scroll to the right in a cumbersome way. As with prompts, be careful that the Hierarchical view does not require too many extra clicks. In the preceding example, the country hierarchy alone would have been sufficient, and I would recommend leaving out the region and city columns for a real-world deployment.
As mentioned throughout this chapter, lists of values are query files. As the files are stored separately from the object definition, it is easy to use one list of values query with multiple objects. I refer to this capability as reusable or shared lists of values. Giving the lists meaningful names will make this process easier to maintain. You may want to share the same list of values for objects used in multiple alias tables, regardless of whether they have been defined as aliases within the universe or synonyms within the RDBMS. For example, customer number may be used in both Ship To Customer and Sold To Customer. Both objects use the same customer numbers. In the next example, there is a Sending Plant Id and a Receiving Plant Id for a company that has plant-to-plant transfers. The list of plant IDs remains the same. Sharing the list of values query across the objects will mean less customization for you as the designer. For users, it results in fewer list of values refreshes. To share a list of values across multiple objects: 1. Select the object that contains the customization and double-click to edit the object properties. 2. Select the Properties tab. 3. Under List Name, assign a meaningful query name or note the system-generated name. 4. Customize the list of values query according to the instructions in the previous sections. 5. Ensure the box Export With Universe is checked. 6. Select the second object that will share the query definition for the list of values. 7. Under List Name, fill in the same query name as in Step 3. You do not need to check the box Export With Universe on this secondary object. Figure 10-5 shows how two objects can share the same list of values customization.
PART II
Reusable Lists of Values
226
Part II:
A Better Universe
Two different object names
Only one object needs to have customization exported List name is the same for both objects
FIGURE 10-5
Sending Plant Id and Receiving Plant Id share the same list of values query, PLANTID.LOV.
Incorporating Personal Data Files Throughout this chapter, I’ve warned against exporting data with the universe list of values unnecessarily. However, there are several instances in which you may want to break this rule: • The list is extremely small and it is faster for the repository to send the users a preexecuted query than it is for the users to execute the object.lov query themselves. • The dimensional data in the data warehouse or OLTP is in transition; new groupings and codes are not available in a central RDBMS, but they are available through a spreadsheet or text file. • A universe designer can incorporate personal data into the customized list of values and export it to the repository. Desktop Intelligence users may also do this on an individual basis. Personal data files can be text, spreadsheet, or database files. Each file must follow a specific layout: • The condition column or pick list value must be in the first column. • The remaining columns may contain additional information. Unlike standard customized lists of values, these additional columns cannot be used for sorting once in Designer, so do the sorting first in the data file. • It is okay to have column headings, but you must tell Designer they exist.
TIP If your list of values is in a spreadsheet, create an Excel range name with just those columns and rows you want to appear as a list of values. Using the EFASHION universe as an example, let’s assume that you want to regroup certain SKU numbers into different product lines, as shown in Table 10-2, which contains proposed product groupings that do not yet exist in the data warehouse or OLTP. The new groupings are
Chapter 10:
L i s t o f Va l u e s
SKU Description
Category
Product Line
New Product Line Grouping
141406
Belted Tunic
Lounge wear
Accessories
Sweat-T-Shirts
150850
Zipper Vest
Lounge wear
Accessories
Sweat-T-Shirts
155576
Rudolph Shirt
Lounge wear
Accessories
Sweat-T-Shirts
159421
Striped Leggings
Lounge wear
Accessories
Trousers
160556
Spotty Leggings
Lounge wear
Accessories
Trousers
161363
Double Breasted Silk Jacket
Lounge wear
Accessories
Jackets
167119
Jacquard T-Shirt
Lounge wear
Accessories
Sweat-T-Shirts
182379
Lurex Leotard
Lounge wear
Accessories
Sweat-T-Shirts
182488
Chenille Leotard T-Shirt
Lounge wear
Accessories
Sweat-T-Shirts
182880
Diamond Cigarette Holder
Lounge wear
Accessories
Jewelry
183861
Lycra Culotte Shorts
Lounge wear
Accessories
Trousers
TABLE 10-2 Lists of Values Can Access Personal Data Files
available in a spreadsheet file that not all users can access. In the RDBMS, Lounge wear and Jewelry are currently grouped under the line Accessories. In the personal data file, they are regrouped into a newly created line, Jewelry. Other SKUs are moved into existing but different Proposed Lines such as 161363 Double-Breasted Silk Jacket from Accessories to Jackets, and Leggings to Trousers. Once you have ensured your data file is in the appropriate format, you can associate this data file with the object list of values: 1. From the pull-down menu, select Tools | List Of Values | Edit A List Of Values. 2. This will present you with a list of all objects in the universe that have an associated list of values. Expand the Product class, then select SKU number. 3. Change the radio button from Corporate Data to Personal Data. When you change this option, you will receive the following warning message:
PART II
SKU Number
227
228
Part II:
A Better Universe
4. Click OK. Designer presents you with a Personal Data selection screen. 5. Specify the data file that contains your list of values and the format. If it is an Excel spreadsheet, you can specify a range name.
6. Click Run to have Desktop Intelligence access your personal data file and return to the List Of Values dialog box. 7. Click Display to see this new list. Change your view from hierarchical to tabular. Designer displays the customized list of values in the format that will appear to users when they request a list of values for a condition object. 8. Click OK twice to close the display list and List Of Values dialog box. 9. Modify the object properties for SKU number to mark the box Export With Universe. When you click Run in Step 6, the data from the spreadsheet (or other personal data file) is dynamically added into the object.lov file. Designer exports this file with the universe definitions when you export the modified universe to the repository. If you skip Step 6 and users do not have access to the personal data file on a central server, they will receive an error message when trying to run the list of values. Similarly, if users ever click Refresh, they will need access to the data file or will receive an error message.
Summary Lists of values and their customizations allow users to more easily filter their data. In the past, designers often had to weigh the disadvantages of increased universe size and import times against more usable lists of values. With the XI architecture, that is no longer a concern and designers can focus more on creating lists of values that improve query performance and ease of use.
11
CHAPTER
Advanced Objects
I
n the previous chapters, you created some basic objects. In this chapter, you will add a significant amount of intelligence to columns of information. Designer provides two main categories of functionality to do this: internal Designer functions and SQL functions that are RDBMS specific. The first part of the chapter covers functionality that is specific to Designer but database independent. The second part of the chapter covers SQL commands that may be dependent on which RDBMS you use.
Reducing Maintenance with Base Objects and @Select The @Select function is an internal function that allows you, as the designer, to reuse universe objects without forcing you to repeat the entire SQL syntax. For example, take an initial object Sales that provides information on revenue in U.S. dollars. You can add a number of forms of intelligence to this object: Sales in Local Currency, Sales in Euros, Sales Adjusted for Inflation, Sales with 10% Projected Increase, and so on. These additional objects are not columns in the database; they are objects you create by using SQL commands described in the second part of this chapter. However, they all reference the same initial column in the RDBMS, such as Sales_Fact.Amount, and then include further calculations to local currencies or forecasts. When building advanced objects with Designer, you can select either the RDBMS column or a universe object. Whenever possible, select the object. You will save time on universe maintenance. Imagine six months from now, the physical field for Sales (Sales_Fact.Amount) in the RDBMS is renamed. If all of the related sales objects explicitly referenced the RDBMS field, that is how many objects you now must modify manually. However, if all the related sales objects used @Select, you need to modify only the one base object. The syntax of @Select is @Select(Class\Object), where Class is the name of the class that contains the base object—for example, Measures, and Object is the name of the object that contains the base object—for example, Sales. When using @Select, you can still see the full SQL statement by enabling the check box Show Object SQL in the SQL Editor. In all the examples in this chapter, I use @Select whenever possible but display the full SQL syntax.
TIP Whenever possible, use objects rather than individual RDBMS columns. This will save you work if ever you rename an RDBMS column, as you will need to modify only the SQL of the base object; Designer will automatically update the SQL for all other objects that use the base column.
229 Copyright © 2006 by The McGraw-Hill Companies. Click here for terms of use.
230
Part II:
A Better Universe
The @Where function is similar to @Select in that you can reuse a WHERE clause from an existing object.
The SQL Editor When changing SQL statements, you can either enter the SELECT statements in the formula bar (to display, select View | Formula Bar), or you can use the SQL Editor to change either the SELECT statement or the WHERE clause. The SQL Editor also provides some help on Designer functions and SQL syntax. Figure 11-1 shows the SQL Editor. You launch the SQL Editor by clicking the >> button from the Definition tab of the object properties. As you modify the SQL for an object, you can either point and click your way through it, or you can enter the functions, columns, and operators manually. Regardless of how you build the SQL statement, be sure to parse or validate (formula editor) each object as you go. Parsing validates that your statement is correct and won’t produce an error when a user launches a query. Parsing will not catch all SQL errors and may be slower for objects that use @Select (as multiple SQL statements must be checked), but it will catch the majority. In order to build a statement with point and click, you often start with the Functions box on the right. For example, to create the measure object Revenue from the Island Resorts Marketing universe, as shown in Figure 11-1: 1. Modify the Object Properties by double-clicking the object, in this example, Revenue. From the Select box, click >> to launch the SQL Editor. 2. Under Functions, expand the Number functions by clicking the + sign. Scroll to sum() and double-click. Notice that the mouse insertion point is correctly between the parentheses. If you had started with the Tables and Columns on the left, your mouse would be in the wrong place. 3. Under Tables and Columns, expand the INVOICE_LINE table by clicking the + sign. Double-click DAYS to insert INVOICE_LINE.DAYS into the statement. 4. Under Operators, double-click the multiplication sign (*). The list of available operators will change depending on whether you modify a SELECT statement or a WHERE clause. 5. Under Tables and Columns, double-click NB_GUESTS. 6. Under Operators, double-click * again. 7. Under Tables and Columns, scroll to the SERVICE table, click + to expand it, and double-click PRICE. The close parenthesis should still be in the correct place. 8. Click Parse to ensure you have built the SQL statement correctly with the functions, operators, and parentheses in the correct positions.
Some Caveats about SQL Functions SQL contains a number of commands that are common to all databases. However, database vendors have added a number of extensions to make SQL more powerful. These extensions are not common for all databases. Some companies have development policies to keep the universe database-agnostic, particularly when they are contemplating migrating to a new
Chapter 11:
Enter SQL statements here
Start with a SQL function
Advanced Objects
231
Always Parse an object
Use objects to reduce universe maintenance
PART II
Toggle to display SQL columns or universe objects
FIGURE 11-1
Help text for the SQL command
The list of operators changes
SQL function
The SQL Editor helps you write SQL statements to enhance objects.
RDBMS. Analytic application vendors that use BusinessObjects XI as the reporting engine also may strive to keep their universes database-agnostic. However, when you avoid using database-specific SQL in the universe, you are generally forcing end users to do more work in the reports (see Chapter 14 for further discussion). My recommendation is to use your database SQL to its fullest. Your universe will be more powerful, and you will save users time.
SQL Parameters and the PRM File The available database-specific functions are stored in the database.prm file (located under C:\ Program Files\Business Objects\BusinessObjects Enterprise 11.5\win32_x86\dataAccess\ ConnectionServer\oracle). The corresponding help text or function description as shown in Figure 11-1 is stored in a separate XML file that is language specific as RDBMSLL.PRM, where LL refers to the Language. For example, the English language help text for Oracle functions is stored in oracleen.prm. Business Objects provides you with a default database.prm file that you may want to modify. You may want to modify the database.prm file for the following reasons: • To enable users to access SQL functions that have been disabled by default • To improve the help text for frequently used functions, especially if your company has decentralized universe designers
232
Part II:
A Better Universe
• To add SQL functions that your RDBMS vendor has recently added but that Business Objects has not yet added in the database.prm file • To add functions that your DBA may have created If a command does not exist in the file, designers can also manually enter it in the SQL statement rather than changing the .prm file. When you change the database.prm file, you must restart Designer for the change to take effect. Following is a section from the Oracle.prm file on the SQL UPPER function:
upper($1)
Function Group specifies if the use of the function requires the generation of a GROUP BY in the SQL. Upper does not, but SUM would. ID corresponds to the name of the function that appears to you in the SQL Editor. InMacro indicates if Desktop Intelligence users can access the SQL function to create their own objects. If you scroll through the .prm file, note that by default, users cannot access the Oracle DECODE function. If you want them to be able to, set IN_MACRO="True". Type specifies if the output results are in an alphanumeric (“String”), date (“DateTime”), or numeric (“Numeric”) format. The Arguments section provides prompts when users create their own objects. The Argument Type indicates the format required. In the preceding example, users will be prompted to enter a String that then gets passed to ($1) as part of the SQL command. In the case of Upper($1), the string will be the universe object to convert to uppercase. If you were looking at an aggregate function such as SUM, the Argument Type would be "Numeric". The Arguments section and settings are similar to TRAD in earlier versions of the .prm file. SQL shows the actual SQL syntax. The number of SQL parameters is indicated with ($1) and so on.
Help Text for SQL Functions In previous releases of Designer, the description or help text for various SQL functions was stored in the same file as the function itself. To allow for multilingual deployments, the help text for the functions is now stored in a separate, language-specific XML file. Thus for each entry in the RDBMS.PRM file, there is a corresponding entry in the RDBMSLL.PRM file. For example, with the preceding Uppercase function, the ORACLEEN.PRM file contains the following settings:
Returns a character string in upper case Uppercase
String:
The Message id= “Help” message is what will appear to you as the designer when you select a function from the SQL Editor or to end users who create their own objects. In Figure 11-1, this is the text in the bottom left, “Returns the sum of the values.”
Chapter 11:
Advanced Objects
233
The Message id within the Arguments section is what will appear to end users if additional parameters are required. In the preceding example and following illustration, the default argument message “String:” is not particularly helpful. Note that all messages within the Arguments section must end with a colon ( : ).
The dialog in Desktop Intelligence does not allow for a much longer message, but note in the following a clearer argument message, “Object to convert” versus the preceding “String”:
Modified argument message
PART II
Default message
234
Part II:
A Better Universe
Multiple Arguments and Prompt Messages Some SQL functions require multiple arguments. For example, SUBSTR displays a certain number of characters beginning at a certain position and counting forward so many characters (or until the end if this third argument is not supplied). So designers and users must specify at least two arguments and an optional third: • The field or object to extract the text from, so Argument Type = “String” • Which position to start extracting from, so Argument Type = “Numeric” • Which position to stop extracting from, so Argument Type = “Numeric” As an example, assume you want to create an object called Area Code from the object Phone Number. Poorly designed, the object did not store phone numbers numerically, and they do contain parentheses and dashes in the field such as (973) 555-1212. To extract just the area code requires the following SQL: SUBSTR(Customer.Phone,2,3)
The Oracle.prm file would contain the following arguments and SQL:
substr($1,$2,$3)
The help text in the ORACLEN.PRM file appears as follows:
Extracts a sequence of characters from a character string Substring
String: Initial position: Number of characters:
Condition Objects Condition objects are unique objects that allow users to access predefined conditions that the designer specifies in the WHERE clause. Condition objects are denoted with a filter symbol. The Island Resorts Marketing universe, shown next, contains several predefined conditions. To access a condition object, click the Classes/Conditions filter in the lower-left corner. Click the + sign next to each class to see the Condition Objects.
Chapter 11:
Advanced Objects
235
Formula bar shows the WHERE clause
PART II
Conditions view
Objects view
Most of these conditions are fairly simple. In building condition objects, you, as the designer, must evaluate if the objects add clutter or value. If it saves the users time, create the object. If it defines some unique groupings that do not otherwise exist in the dimension tables, create the object. If it ensures a degree of consistency in how users filter the data, then create the condition object. Objects that contain one value such as Year 1993 do not add much value; users probably could have added the condition themselves. The object Young American, on the other hand, contains two conditions (Customer.age = 100,000), as doing so requires a different SQL clause. Condition objects will automatically use the WHERE clause, whereas filtering on measures requires use of a HAVING clause (explained in Chapter 23). If you try to build such a condition object, you will receive an error upon parsing. A work-around using a subquery in the condition is discussed in the next section.
236
Part II:
A Better Universe
1. Using the Island Resorts Marketing universe, set the Classes and Objects pane to display the condition objects. Position your cursor in the class where you want the new object to appear—in this example, Customer. 2. Click the Insert Condition button on the toolbar or select Insert | Condition from the pull-down menus. 3. In the Name box, enter Platinum Customer. 4. In the Description box, enter some meaningful help text, such as: A platinum customer is a predefined list of customer codes with revenues of $100,000 or more in any given year. 5. In the Where box, click >> to call up SQL Editor. 6. At this point, you could manually enter the WHERE statement shown in the next screen. These step-by-step instructions use point and click to build the condition object. Under Classes and Objects, scroll to the class that contains the object you want to use for the WHERE clause. In this example, click the + next to Customer. 7. For response time reasons, you want the WHERE clause on the indexed Customer Id object rather than the nonindexed Customer. Double-click Customer Id to have it added to the WHERE statement. Note that Designer uses the @Select function.
NOTE The Island Resorts Marketing universe may or may not have Customer ID as an object, depending upon whether your universe was newly installed with XI Release 2 or imported from a previous version. If you do not see the object within Classes and Objects, then select the appropriate field from Tables and Columns and skip to Step 9.
Chapter 11:
Click to view SQL syntax
Advanced Objects
237
If you select an object, Designer uses its @Select function
PART II
Select the RDBMS column or the universe object name
8. To view the SQL syntax, click the Show Object SQL check box, shown next. Notice that Designer grays the SQL statement box and does not allow you to edit the statement. SQL syntax
9. In the Operators box, scroll to IN and double-click to add this to the SQL statement. 10. You do not need to transform your values, so you will not use any functions. Manually enter the list of customer IDs (106,502,104,102,506,402,406) generated by the preceding report. Because Customer Id is a numeric object, it does not require single quotes around each condition value. 11. Always click Parse to test the validity of the SQL statement.
238
Part II:
A Better Universe
12. Click OK to close the SQL Editor. The condition object properties should now look like the illustration at right: 13. Click OK to close the Object Properties screen. 14. Click Save to save the universe changes. If necessary, export the changes to the repository with File | Export. When users build a query, they can now add the condition object to the condition panel.
Condition Object with Subquery The preceding object works perfectly fine and will provide the best query performance. However, what if your top customers change from quarter to quarter or year to year? In this case, you could add a subquery to the condition object so that the list of customers with a certain revenue level is generated dynamically. Subqueries are slow, so use them with care. The following SQL would be used in the Where pane to create such an object: Customer.cust_id in ( SELECT Customer.cust_id FROM Customer, Sales, Invoice_Line, Service WHERE ( Customer.cust_id=Sales.cust_id ) AND ( Sales.inv_id=Invoice_Line.inv_id ) AND ( Invoice_Line.service_id=Service.service_id ) GROUP BY Customer.last_name, Customer.cust_id, 'FY'+Format(Sales.invoice_date,'YYYY') HAVING sum(Invoice_Line.days * Invoice_Line.nb_guests * Service.price)
>=
100000)
TIP Consider using @Prompt to allow users to specify the revenue amount dynamically when they use this object.
Time Conditions Condition objects involving time functions are popular. Additionally, BusinessObjects XI does not allow users to add calculations within the query panel, so condition objects become the only way in which users can create rolling reports. The following objects use SYSDATE, which returns the current date according to the RDBMS.
Chapter 11:
Advanced Objects
239
The following SQL creates a One Year Ago condition object. The comparison column is in a date format. Because SYSDATE is a date column including the day of the year, you subtract 365 days to arrive at the same date last year. TIMES.END_OF_CAL_YEAR=SYSDATE-365
If the comparison column is not in a date format but is numeric, then you must also convert the SYSDATE calculation to numeric with TO_NUMBER. The following SQL creates a Last Year object in which the year is four digits. To extract only the four digits, use the TO_ CHAR function.
You can further nest date functions to create a Current 3 Months condition object. In the following example, -3 shows that three months should be subtracted from the SYSDATE: SH.TIMES.CALENDAR_MONTH_NUMBER BETWEEN TO_NUMBER(TO_CHAR(ADD_MONTHS(SYSDATE,-3), 'MM') ) AND TO_NUMBER(TO_CHAR(SYSDATE,'MM') )
NOTE The WHERE statements from each condition object and the Row Restrictions set through the universe security restrictions (Chapter 13) are appended to the entire SQL statement. If users combine incompatible condition objects, they may get no rows returned.
Objects with Prompts: Interactive Objects Business Objects refers to objects that contain prompts as interactive objects. Each time a user accesses an interactive object, BusinessObjects XI prompts the user for additional information that you, as the designer, build into the object. Prompts can be useful but also annoying if the user always wants the same values. For example, if a user always wants current year data, it can be aggravating if the object prompts the user for the year each time the user refreshes the query. In such a case, the user is better off placing a fixed condition in a report. Objects with prompts should be reserved for items in which some sort of condition is required either to limit the number of rows returned or to guarantee correct results. In Chapter 9, Figure 9-2, you looked at the risk of constructing a query that involved a single point in time (for semi-additive measures such as account balance, ending inventory, number of customers) and a period of time (debits and credits; movements in and out; customers acquired). One way to ensure users select one point in time for semi-additive measures is to prompt users to enter an individual date whenever they select month-end inventory, as shown in Figure 11-2. (It would be wrong to put the prompt on the Day object, because it would prevent users from analyzing movements in and out for more than one day.) Notice in Figure 11-2 that the object or TABLE.COLUMN in the SELECT portion of the SQL can be different than the TABLE.COLUMN in the WHERE clause. In the preceding figure, the DEBIT_CREDIT.BALANCE is used in the select, but Day is used in the WHERE clause. Because these two columns can be different, the format types also may be different. The Balance object uses the Type=Number, yet the @Prompt uses D to indicate that the prompt answer will be in date format. Prompts are added in the WHERE clause of a new or existing
PART II
TIMES.CALENDAR_YEAR=TO_NUMBER(TO_CHAR(SYSDATE-365,'YYYY'))
240
Part II:
A Better Universe
Different format types Help text on how to use prompt Different columns/objects
FIGURE 11-2
Create interactive objects with @Prompt.
object. Under Functions, double-click the @Prompt function to insert the syntax in the SQL statement, as shown here:
The @Prompt function uses the following syntax: @@Prompt('Message','type','object or list of values',MONO/MULTI,FREE/CONSTRAINED)
where • Message is the prompt you want users to see when they run a query that contains this object. • Type is the object type or field format for the condition column. The query engine uses this to determine if the values require quotes or not. The base object and the
Chapter 11:
Advanced Objects
241
WHERE clause column may be two different types. In this example, Balance is numeric and Day is date. Acceptable values are • A for alphanumeric • N for number • D for date
• MONO/MULTI If users can select only one value, use MONO. If users can enter more than one value, use MULTI. Note that the SQL operator must correspond to this setting. If users can enter more than one value, use the IN operator. • FREE/CONSTRAINED If users must select a value from the list of values, use CONSTRAINED. If users can either select from a list of values or enter their own value, use FREE.
TIP The @Prompt function is very particular about commas, quotation marks, and matching object types. Be sure to Parse the object. When a user now constructs a query that uses the Balance object, BusinessObjects XI will always prompt them to Select the Day for the Ending Balance. The following example illustrates how prompts can become user unfriendly. In the following query, the user wants to see daily account balances and correctly includes the Day object as a result object:
PART II
• The 'object or list of values' parameter can be either the individual objects whose list of values you want to use or a list of values you enter manually in the prompt. When entering a predetermined list of values, you must enclose the values in single quotes, separated by commas, and the complete list must be enclosed by brackets. For example, suppose I wanted to restrict users to the most recent two ending balances: {'09/30/02','10/31/02'}.
242
Part II:
A Better Universe
However, the Balance object also now includes the prompt to filter the query for one day (in addition to the user’s condition on day). This generates the following SQL: SELECT Daily_Balance.Date, Daily_Balance.Balance FROM Daily_Balance WHERE ( ( Daily_Balance.Date ) = @Prompt('Select the Day for the Ending Balance','D','Time\Day',MONO,FREE) ) AND ( Daily_Balance.Date BETWEEN {d '2002-09-01'} AND {d '2002-09-30'} )
First, from the user’s viewpoint it seems nonsensical that Web Intelligence will prompt for information that the user has already included in the conditions. Second, users will only ever be able to retrieve balances for one day at a time, whereas it is a valid business question for them to review daily balances over a period of time. In this respect, it is important in training and object descriptions to emphasize how these objects work and when to use them. As you build interactive objects, follow these guidelines: • Use interactive objects only when the absence of a prompt could lead to inaccurate information or unacceptable query response times. • If the prompts are for user friendliness or automation, have two objects, one without a prompt for unrestricted information and one with the prompt. Differentiate between these two objects with clear names—for example, Balance and Balance-Date Required. • Provide usage information in the object description or in training.
C AUTION At the time of this writing, if the list of values for the prompt is long, Web Intelligence seems to hang in building the prompt page. If your prompt accesses a long list of values, verify if this problem has been resolved in the latest service pack before deploying.
Pseudo Optional Prompts If you do not want the prompt to be mandatory to limit the number of rows, try the following technique, originally suggested by Walter Muellner of Mercury Business Solutions in Austria. The Where clause uses an OR statement to allow users to either answer ALL or choose individual values from the list: 'ALL' IN @Prompt('Enter City or ALL','A', 'Customer\City',multi,) OR City.city IN @Prompt('Enter City or ALL','A', 'Customer\City',multi,)
This is a very creative approach to balancing user friendliness with prompting. When users enter ALL, the first part of the condition SQL gets used ('ALL' IN 'ALL'). Because the condition statement uses an OR clause, the second condition is not evaluated. Conversely, if users enter city names (or anything other than ALL), then the first part of the SQL is not true and so it does not get used, while the second condition does. Of course, if ALL is a possible data value in the City column, this poses a problem. The alternative is to use a symbol such as * or %—however, the risk is that users mix up true uses of these symbols
Chapter 11:
Advanced Objects
243
(wildcards in certain databases). Finally, in order for this to work, the prompt in both condition statements must be exactly the same or users will be prompted twice.
Oracle Hints
/*+ Index(TableName IndexName) */
The following example uses the sample Oracle Sales History (SH) database and the detailed product ID. In defining the Object properties for the Product Name, the SELECT statement would be as follows: /*+Index(SH.SALES_FACT SALES_PROD_BIX) */ SH.PRODUCTS.PROD_NAME
In earlier versions of Designer, the objects with hints did not parse. In Designer XI Release 2, the object will parse if you have entered the hint correctly.
Reusing Interactive Objects with @Variable Designer allows you to reuse the prompt as a variable that you can then use in other objects. The variable can be one that you create with @Prompt, or it can be a system variable. BusinessObjects XI provides the following system variables: • BOUSER The BusinessObjects Enterprise user ID • BOPASS The BusinessObjects Enterprise password • DBUSER
The database credentials used to connect to the data source
• DBPASS The database password used to connect to the data source As an example, let’s assume that a hierarchical PRODUCT table contains both products and employees responsible for those products. So that users automatically see information for their products, the My Product object could contain the following WHERE clause: PRODUCT.PRODUCT_OWNER = @Variable('BOUSER')
Reusing Interactive Objects with @Where As mentioned previously, @Where allows you to reuse a WHERE clause in multiple objects. There are two benefits to using @Where: the first is decreased maintenance, and the second is decreased user prompting. If a query contains multiple occurrences of the exact same prompt, Web Intelligence and Desktop Intelligence will prompt the user only one time. For example, let’s assume that users must filter Customer information by City to ensure only a limited amount of data is returned. The dimension object City contains a prompt. A designer could add @Where (Customer\City) to Customer Name, Customer Id, Customer Age Group.
PART II
Some designers have expressed concern that this approach causes the index not to be used. While I have not seen this problem in practice, it is true that the Oracle optimizer can sometimes get confused when there are many OR connectors. You can use Oracle Hints in your SELECT statement to encourage the optimizer to continue to use an index. I am not an advocate of building hints into universes, because it undermines the ad hoc nature of user queries, and in the end, Oracle still may ignore your hint. However, good response time is paramount to a successful deployment, so if you run into problems, incorporate hints where appropriate. The syntax for Oracle Hints for indexes is
244
Part II:
A Better Universe
Even if a query contains all four of these objects in a query, the user is prompted only once to select a city.
Prompts in Objects vs. Reports Objects with prompts achieve a similar functionality as queries with prompts (Chapter 20, “Prompts”). In Chapter 14, you will look at the pros and cons of where to put this kind of intelligence. The main difference to consider with prompts is flexibility and maintenance. If you want to give the users flexibility, put the prompts in the query. If you want to minimize your maintenance costs, keep the prompts centralized in the universe objects. The following table summarizes some of the key differences between prompts in objects versus prompts in a query. Universe Object with Prompt
Query with Prompt
Designer builds into universe
User builds in query
Centralized, so cost-effective to maintain because the designer creates the prompt once
Decentralized, so expensive to maintain because users must create the prompt in every document
Users cannot remove, so it can be inflexible, but error-proof, as it requires an answer
Users can remove, providing flexibility
Aggregate Awareness An aggregate table is a summary table that DBAs build to execute queries faster. Aggregate tables are smaller than detail tables and can be aggregated in a number of ways. Most DBAs will strive for a certain compression ratio—for example, 10:1; the aggregate or summary table should be ten times smaller than the detail table, or for every ten detail rows, there is one summary row. Before you spend your time reading this section, talk to your DBA to determine if your database will automatically take advantage of aggregate tables. Newer versions of databases can automatically rewrite a query to leverage an aggregate table when it is available. The universe designer does not need to explicitly specify these aggregates. Unfortunately, though, it seems many organizations have been slow to take advantage of the database’s query rewrite, so I am providing instructions here on how to use Designer’s aggregate awareness. Given the choice, though, don’t do this in the universe as it poses maintenance challenges; do it in the database. Alternatively, consider third-party solutions from technology partners such as HyperRoll or Netezza that are geared to improving query performance. Figure 11-3 shows two sample dimensions, Time and Product. In the Time dimension, there are five years of history, with four levels going from Year to Day. Within a given year, there are 365 days. If the Time dimension contains five years of history, this results in 1825 rows of data. The Product dimension has four levels, ranging from Total Product to individual SKU. There are 210 SKUs (this is a very small product dimension). A DBA may create an aggregate table summarizing data to any of these levels, across any dimension, as shown in Figure 11-4. The SALES_FACT_DAY table contains daily sales figures for five years, at the SKU level for all customers. The SALES_FACT_MONTH table aggregates sales by month and by product line. Customer is not aggregated in any way. The following table shows the potential number of rows in such a fact table, if you have 30,000 customers. Typically, not every product sells daily, nor does every customer buy every product on a daily basis, so the potential rows represent strictly a worst-case scenario.
Chapter 11:
Advanced Objects
245
PART II
FIGURE 11-3
Two sample dimensions showing the number of potential rows at each level
However, the table illustrates the purpose of using aggregate tables for faster queries. If a user wants to analyze customer or product line sales only on a monthly or quarterly basis, the queries will run much faster against a 21.6 million–row table than an 11.497 billion–row table. Time
Product
Customer
Potential Rows
Day, SKU
1825
210
30,000
11,497,500,000
Month, product line
60
12
30,000
21,600,000
FIGURE 11-4
Aggregate tables are summary tables that allow for faster queries.
246
Part II:
A Better Universe
The existence of aggregate tables does not help user queries. Users must access the summary tables, ideally automatically with awareness built into the RDBMS to force the query to be processed in the most efficient way. You most often will use aggregates with measures from fact tables as shown in Figure 11-4. For extremely large dimensions, you also may have a smaller dimension table, for example, that removes dimension details lower than month and product line (as shown in Figure 11-3). The following process outlines the key steps to enabling aggregate awareness:
Creating Aggregate Fact Tables Business Objects has provided two aggregate tables as part of the EFASHION.MDB. You will focus on the one table: AGG_YR_QT_MT_MN_WK_RG_CY_SN_SR_QT_MA
The naming of the table is a bit cumbersome, so hereafter, I will refer to it as the aggregate fact table. The table name reveals some information on the contents of the table: • AGG Aggregate • YR Year • QT
Quarter
• MT Month Text • MN
Month Number
• WK
Week
• RG Maybe region was intended but it is not in the final table • CY City • SN
Store Name
• SR Sales Revenue
Chapter 11:
• QT
Quantity
• MA
Margin
Advanced Objects
247
I do have some concerns with the design of this table, as it has a fair bit of dimensional information that is typically stored in separate tables, but for demonstration purposes it will work fine. Notice that the number of rows for the aggregate table is 1982 compared to 89,171 in the detailed SHOP_FACTS table. Whenever possible, you want queries to run against the smaller AGG_YR_QT_MT_MN_WK_RG_CY_SN_SR_QT_MA rather than the larger, detailed SHOP_FACTS.
In looking at Figure 11-5, you see that the aggregate table does not include any information on Articles. So the dimension tables ARTICLE_LOOKUP and ARTICLE_COLOR_LOOKUP will become incompatible with the summary objects. The fact table includes a lot of dimensional information. Time information is aggregated to the week level. You can retrieve dimensional information from either CALENDAR_YEAR_LOOKUP or the aggregate fact table. Outlet information is not aggregated; the aggregate tables contain details on the STORE_NAME, which is at the same grain as the OUTLET_LOOKUP but does not contain information about the store location.
Adding Aggregate Awareness to Measure Objects You are now ready to define aggregate awareness to the individual measure objects Sales Revenue, Quantity Sold, and Margin. Aggregate awareness uses an internal function Designer: @Aggregate_Aware(sum(smallest_table.column), sum(medium_table.column), sum(biggest_table.column))
FIGURE 11-5 A detail fact table and a summary aggregate table may share some of the same dimension tables.
PART II
Identifying Dimension Tables Irrelevant to Aggregate Tables
248
Part II:
A Better Universe
You can have multiple tables in the SELECT statement, with the smallest table first and the largest or most detailed table last. The @Aggregate_Aware function allows you to use any of the SQL Aggregate commands (SUM, COUNT, AVG, MIN, MAX); however, the aggregate command must be specified for each column as shown here. Right: @Aggregate_Aware(sum(Agg_yr_qt_mt_mn_wk_rg_cy_sn_sr_qt_ma.Sales_revenue), sum(Shop_facts.Amount_sold))
Wrong: @Aggregate_Aware(sum(Agg_yr_qt_mt_mn_wk_rg_cy_sn_sr_qt_ma.Sales_revenue, Shop_facts.Amount_sold))
NOTE If you normally have Designer automatically create objects when you add a table, turn this feature off before adding aggregate tables: Choose Tools | Options | Database. Remove the check mark from Create Default Classes And Objects From Tables. You do not want separate objects from these tables. Instead, you will point existing objects to access the aggregate tables. To follow the steps, use the Test Fashion universe created in earlier chapters. 1. Insert the aggregate table into the universe structure. Click the Table Browser button or use the pull-down menu to select Insert | Table | AGG_YR_QT_MT_MN_ WK_RG_CY_SN_SR_QT_MA. 2. Expand the class Test Fashion Measures. 3. Select the object Sum of Amount Sold or Revenue. 4. Click the >> next to sum(Shop_facts.Amount_sold)to invoke the SQL Editor. 5. If you wish to avoid re-creating the SQL for the detail SHOP_FACTS table, ensure your mouse is positioned at the start of the SQL statement. 6. Under Functions, click the + sign next to @Functions to expand the group and display the Designer internal functions. 7. Double-click @Aggregate_Aware to insert the syntax in the SQL statement box. 8. Under Functions, click the + sign next to Number to display the SQL RDBMS functions. Scroll to sum() and click to insert the syntax into the SQL statement. 9. Under Tables And Columns, expand the aggregate table AGG_YR_QT_MT_MN_WK_ RG_CY_SN_SR_QT_MA and double-click SALES_REVENUE to insert the table. column between the parentheses of sum(). 10. Delete the right parenthesis and move it to the end to close the statement. Your SQL statement should appear as follows:
Chapter 11:
sum() appears around each individual table column
Advanced Objects
249
Designer-specific functions
Aggregate table
PART II
11. Click Parse to verify you have entered the correct syntax.
TIP According to Business Objects, Parse on aggregate-aware objects only partially checks the SQL syntax. If you use @Select with @Aggregate_Aware, the parsing may be slower and less accurate. For complete universe integrity, be sure to test the objects by running queries and viewing the full SQL generated. 12. Click OK to close the SQL Editor and then OK again to save the object definitions. To enable aggregate awareness on Quantity Sold and Margin, repeat Steps 3–12, selecting the appropriate objects and columns. At this point, there are no joins between the aggregate fact table and the dimension tables, nor is the aggregate part of a context. The aggregate table would normally have keys to join to the dimension tables that Designer may have detected; however, the design of this table is a bit unusual, so you must manually add the following two joins: Agg_yr_qt_mt_mn_wk_rg_cy_sn_sr_qt_ma.Store_name=Outlet_Lookup.Shop_name
250
Part II:
A Better Universe
NOTE I normally wouldn’t recommend joining a description field from one table to a description field in another; the joins should be between indexed ID fields. If, however, users want stores within a particular state, for example, you have no choice with this model. Calendar_year_lookup.Yr=Agg_yr_qt_mt_mn_wk_rg_cy_sn_sr_qt_ma.Yr AND Calendar_year_lookup.Week_In_Year=Agg_yr_qt_mt_mn_wk_rg_cy_sn_sr_qt_ma.Wk
1. Either draw join lines between the respective tables and columns or use the pulldown menu Insert | Join. Note that the second join is a complex join that must be entered manually. 2. Add these two new joins to a new context. If you have correctly defined the complex join, you can use the Detect Context button or use the pull-down menu Insert | Context to include the two joins in a new context. Complete the entries as follows:
3. Click OK to accept the modified context. 4. From the pull-down menu, select File | Save or click Save to save the changes to the universe.
Specifying Which Objects Are Not Compatible with the Aggregate Table The table now exists in the universe, and you have told Designer to use this table for certain measure objects. You now have to tell Designer that the aggregate table cannot be used when certain dimension objects exist in the query. This can be very confusing. Try to stay focused on two things: • You are essentially telling Designer when to use the detail table. • You need to worry about only one context or star schema.
Chapter 11:
Advanced Objects
251
Refer to Figure 11-4. Note that all article objects are incompatible with the aggregate table. If a user includes any article information in a query, it is not available in the aggregate table, and you must tell Designer to use the detail SHOP_FACTS table. You are only concerned with this one context and do not need to worry about the promotion objects. This second point is especially confusing, because when Designer detects incompatibility, it unnecessarily and incorrectly marks objects from other contexts. If you mark promotion objects as incompatible here, you prevent users from constructing a query that compares sales by store (using the aggregate table) with promotions by store. To define incompatible objects, follow these steps:
1. Open the pull-down menu Tools | Aggregate Navigation.
2. Highlight the table for which you will define incompatible objects, AGG_YR_QT_ MT_MN_WK_RG_CY_SN_SR_QT_MA. 3. Under Associated Incompatible Objects, you can select entire classes or individual objects. Click the Article Lookup class.
PART II
NOTE You only need to mark objects as incompatible that exist in the one context or star schema.
252
Part II:
A Better Universe
4. If you created a measure Number of Article Codes in Chapter 7, set this object to incompatible as well.
Select incompatible objects
Toggle to display incompatible objects Not recommended
Toggle to display condition objects
C AUTION If you toggle to display tables that contain incompatible objects, only aggregate tables should be displayed. If more than just the aggregates are displayed, you have a problem. 5. You can now use the toggle check box Incompatibles Only to filter those objects that have been marked as incompatible against the aggregate table. 6. Click OK to close the Aggregate Navigation box. 7. From the pull-down menu, select File | Save or click Save to save the changes to the universe.
Testing and Viewing SQL Statements Now that you have defined which objects are incompatible with the aggregate fact table, you need to make sure that the query engine generates the correct SQL. To test this, use Figure 11-4 to develop a test plan as shown in Table 11-1. Take each measure that contains @ Aggregate_Aware and add a dimension object from each of the dimension tables to the query. As you create a query for each scenario, verify that the SQL generated uses the appropriate table. To view the SQL statement, follow these steps: 1. Launch the query panel from Designer by selecting Tools | Query Panel.
Chapter 11:
Advanced Objects
If Your Query Contains These Objects
BusinessObjects XI Should Use This Table
1
Sum of Amount Sold
AGG_YR_QT_MT_MN_WK_RG_CY_SN_SR_QT_MA
2
Sum of Amount Sold, Month Name
AGG_YR_QT_MT_MN_WK_RG_CY_SN_SR_QT_MA
3
Sum of Amount Sold, Month Name, Shop Name
AGG_YR_QT_MT_MN_WK_RG_CY_SN_SR_QT_MA
4
Sum of Amount Sold, Promotion Cost, Month
2 SQL Select statements: AGG_YR_QT_MT_MN_WK_RG_CY_SN_SR_QT_MA PRODUCT_PROMOTION_FACTS
5
Sum of Amount Sold, Month Name, Store Name, Article
SHOP_FACTS
6
Sum of Amount Sold, Article Color
SHOP_FACTS
7
Sum of Amount Sold, Number of Article Code
SHOP_FACTS
TABLE 11-1 Test Plan for Aggregate Awareness
2. Follow the test plan outlined in Table 11-1 to add the result objects to the query. The following screen shows a query based on Scenario 3 in Table 11-1:
PART II
Scenario
253
254
Part II:
A Better Universe
3. To verify that the correct fact table is used in the SQL, click the SQL button on the Query Panel toolbar. Note that for Scenario 3, the aggregate fact table was correctly used.
NOTE When you view the SQL via the Designer query panel, it adds a DISTINCT to the query. This does not happen in either Desktop Intelligence or Web Intelligence. SELECT DISTINCT Outlet_Lookup.Shop_name, Calendar_year_lookup.Month_Name, sum(Agg_yr_qt_mt_mn_wk_rg_cy_sn_sr_qt_ma.Sales_revenue) FROM Calendar_year_lookup, Outlet_Lookup, Agg_yr_qt_mt_mn_wk_rg_cy_sn_sr_qt_ma WHERE ( Calendar_year_lookup.Yr=Agg_yr_qt_mt_mn_wk_rg_cy_sn_sr_qt_ma.Yr AND Calendar_year_lookup.Week_In_Year=Agg_yr_qt_mt_mn_wk_rg_cy_sn_sr_qt_ma.Wk ) AND ( Agg_yr_qt_mt_mn_wk_rg_cy_sn_sr_qt_ma.Store_name=Outlet_Lookup.Shop_name GROUP BY Outlet_Lookup.Shop_name, Calendar_year_lookup.Month_Name
)
4. When you add Article Code to the query as in Scenario 5, the SQL engine automatically selects the SHOP_FACTS table without any user intervention. SELECT sum(Shop_facts.Amount_sold), Calendar_year_lookup.Month_Name, Outlet_Lookup.Shop_name, Article_lookup.Article_code FROM Shop_facts, Calendar_year_lookup, Article_lookup, Outlet_Lookup WHERE ( Shop_facts.Article_code=Article_lookup.Article_code ) AND ( Calendar_year_lookup.Week_key=Shop_facts.Week_key AND ( Shop_facts.Shop_code=Outlet_Lookup.Shop_code ) GROUP BY Calendar_year_lookup.Month_Name, Outlet_Lookup.Shop_name, Article_lookup.Article_code
)
For Scenario 4 in Table 11-1, BusinessObjects XI will generate two SQL statements and seamlessly stitch the results together in the report. This step can go wrong for two reasons: (1) if your File | Parameters, SQL tab, Multiple SQL Statements For Each Context setting is not enabled, or (2) if you used Tools | Aggregate Navigation | Detect Incompatibility; in the latter case, Designer incorrectly marked objects from other contexts as being incompatible with an aggregate table.
Chapter 11:
Advanced Objects
255
PART II
The most obvious error in this step of building aggregate awareness is if the wrong table is used in any instance. However, the ultimate goal is to get correct results. So as a final test, you should run a query to ensure that you get the same data when either the aggregate table or the detail table is used. In the preceding examples, Sales for September 2001 is $300,848, according to both the aggregate table and the SHOP_FACTS table. There are a few reasons why you may not get the same result for an aggregate table as for a detail table: • One of the tables is incorrect If the DBA has not built the aggregate table correctly, you may not be able to fix it, but you must communicate this issue to both DBAs and end users. When something is wrong, BusinessObjects XI will always get the blame, because most end users don’t know and don’t care which component in the information flow actually has the problem. If the summary table is incorrect in all circumstances, don’t include it in the universe design. If it is correct in most circumstances and the DBA is working to resolve one minor inconsistency, use the table but clearly explain in the object description when the data may be incorrect. • The aggregate table contains dimensional information that is different from details in the lookup or dimension tables As a general rule, I don’t like when dimensional information is stored in the fact table. It’s even worse when there is a difference between dimensional information in a fact table and a dimension table. Yes, in a perfect world the data is clean and consistent. However, I’ve yet to see a company that had such clean data. In the example of AGG_YR_QT_MT_MN_WK_RG_ CY_SN_SR_QT_MA, the store name exists in both this aggregate fact table and the dimension table OUTLET_LOOKUP. What if the fact table contained data for a store that did not exist in OUTLET_LOOKUP? Users would get different answers between queries that use the aggregate table and queries that use the detail table that joins to the dimension table that is missing information for a store. • The universe contains a mistake in the join or in a dimension definition An error in the design is completely within your control and must be resolved before deploying to end users.
256
Part II:
A Better Universe
Derived Tables Derived tables are similar to views in the database, but as they are defined in the universe, they give universe designers more flexibility. A derived table is a query that can be referenced by you as a table. As it is a query and not a physical table, it’s important to understand that the same performance issues that affect queries also affect derived tables: • Do not use derived tables in place of aggregate tables. Aggregate tables must be physical tables built by the DBA to provide fast query performance. • Do use derived tables that minimize the complexity of the queries users have to create themselves. • Do use derived tables in place of views and stored procedures that in the past you would have asked a DBA to create. Derived tables may be most useful when you want to UNION two queries together (for example, a supplier and customer table unioned to create a vendor table), when you want to include @Variable in the query logic, and in some cases, when you have different aggregation levels.
NOTE If you use derived tables to create different aggregation levels, be careful to consider the impact on joins, contexts, and many-to-many relationships. If your database supports newer analytic and report functions (see the section “Ratio to Report” later in this chapter), these functions will give you much better response time than using derived tables. This example uses the Island Resorts Marketing universe. Earlier, in the section “Condition Objects,” you created a condition Top Customers. A valid business question may be “How much of my business do the Top Customers account for?” To answer this, you need to get the total sales for all customers as well as the total sales for only the top customers and combine them in one query. Within the Island Resorts Marketing universe, the object Revenue is calculated from the Invoice_Lines table. To create an object Top Customer Revenue, you create a derived table: 1. From within the structure pane, right-click and select Derived Tables from the popup menu or select Insert | Derived Tables from the pull-down menu. 2. Within the Derived Tables box, replace the generic `Derived Table` name with a meaningful table name such as Top Customers.
Chapter 11:
Advanced Objects
257
Calculations must have field names
PART II
3. In the SQL Expression box, enter the desired SQL to create the derived table. If you have used Desktop Intelligence or Web Intelligence to create the initial SQL, you must ensure that each calculation is assigned a field name. For example, in the preceding screen, AS Year will create the field Top Customers.Year within the derived table. 4. Parse the SQL statement by clicking Check Syntax. 5. Click OK to close the Derived Tables dialog. 6. Add the necessary joins and include in relevant contexts. In this example, add the join `Top Customers`.cust_id=Customer.cust_id and include in the Sales context. 7. Create the object Top Customer Revenue as a measure with the following SQL that accesses the newly created derived table: sum(`Top Customers`.Revenue)
258
Part II:
A Better Universe
Now, when a user creates a report that contains these two measures, Web Intelligence generates two SQL statements and automatically presents the results as one seamless report. Note in the following that any data not in the derived table appears as a null value. For example, Customer 101 did not have revenues greater than 100,000.
With the use of derived tables, then, a user can easily create a report that shows that 78 percent of the total revenue comes from the top 7 customers. From derived table From physical table Invoice_Lines
HTML Links You can embed links to web sites based on object values. For example, if an object returns a list of customers and you know the web site address for each customer, a user can click on the customer name in a report to link to that customer’s web site.
C AUTION If SQL tests your patience, combining HTML into your SQL may cause you to lose your patience entirely! Pay careful attention to quotes and note that the syntax is different for each database.
About HTML The basic syntax for a link to a web site is • An HTML anchor element • Href The hot spot reference where you will provide the web site address or URL. You may display the URL to users or display different text. •
Ends the HTML anchor element
Chapter 11:
Advanced Objects
259
Designer requires HTML elements to be enclosed in single quotes. (HREF uses double quotes for the URL.) So, if you want to create a simple list of authors who may be visiting your bookstore, the syntax would be as follows: Text to display to users
Following is an example with the author name and web site completed. Jodi Picoult
In the object, you need to add the single quotes around the HTML elements, the and .
At this point, your object would not parse, because it lacks a table.column. To have BusinessObjects XI display the results of a column, the data must be concatenated with the HTML statement. Concatenation symbols vary from database to database; MS SQL Server and MS Access use a plus sign (+), whereas Oracle uses two vertical bars (||). Therefore, your basic HTML syntax for MS Server or MS Access is ''+TABLE.COLUMN+''
and for Oracle it is ''||TABLE.COLUMN||''
If you want the website portion of the Select statement also to be dynamic, you can either access a column that provides a web site address or transform data from another column to form a web address. Concatenating HTML commands with SQL data in addition to fixed strings can get messy pretty quickly. For all the concatenations to work correctly, you must use the RDMBS CONCAT function, rather than the + or || operators. The following example is based on an MS Access database in which the web site address is a column in an Author lookup table: {fn concat({fn concat('')},{fn concat( Authors.Author, '')})}
This second example is based on the sample Sales History database in which the web site address is derived from the city column. The web site address consists of three parts: • The prefix, www. • The city name, which comes from the SQL column SH.CUSTOMERS.CUST_CITY. • The end of the web address, .co.uk. Commercial web site addresses in the U.S. end in .com or .net, while web site addresses in the U.K. end in .co.uk. For this object to work in a global deployment, one would need to add a DECODE or CASE function to test the Country as well. Concat(concat(''),concat( SH.CUSTOMERS.CUST_CITY , ''))
PART II
''Jodi Picoult''
260
Part II:
A Better Universe
In order for Desktop Intelligence to generate the SQL statement correctly as an HTML link, you must set the Object Format to Read As HTML. Select the object and right-click to bring up the following pop-up menu:
On the Object Format dialog, click the box Read As HTML.
When users run a report, the object with the dynamic link to a web site address is displayed as a hyperlink. As long as you set the object format in Designer as Read As HTML, Desktop Intelligence users can access the web site by clicking the link. For Web Intelligence users, though, they must specifically format the cell to read the data as a hyperlink. In the screen shown here, you also see the correctly formatted web site address that will take you to the web site for the city of Leeds (www.leeds.co.uk).
Chapter 11:
Advanced Objects
261
Popular SQL Functions
Concatenated Concatenated objects combine information from multiple fields. A common usage is to combine a customer or employee’s First Name and Last Name into a new object, Name. Depending on your database, you have two ways to concatenate fields: • The CONCAT function, which is database specific and allows you to combine two columns of data. One can nest CONCAT statements to combine multiple columns, but personally, I find the nested functions harder to read than an operator. • An operator that allows you to combine several columns into one. Microsoft databases use +, and Oracle uses ||. The following object uses the CONCAT function and Designer’s @Select to reference existing objects in the universe: CONCAT(@Select(Hr Employees\First Name),@Select(Hr Employees\Last Name))
The SQL statement will appear as follows: CONCAT(HR.EMPLOYEES.FIRST_NAME,HR.EMPLOYEES.LAST_NAME)
Using an operator has the following syntax and allows you to combine more than two fields plus spaces between each column: ( HR.EMPLOYEES.EMPLOYEE_ID ) ||' '|| ( HR.EMPLOYEES.FIRST_NAME )||' ' || ( HR.EMPLOYEES.LAST_NAME )
Time Objects If you look at any quarterly or annual report, it contains current period and Year-To-Date information as shown from the most current Business Objects 10Q filing, as in the following earnings statement: Three Months Ended September 30
YTD (Ended September 30)
2005
2005
2004
2004
Net license fees
120,308
105,705
360,317
337,380
Services
141,073
113,765
412,248
321,563
Total revenues
$261,381
$219,470
$772,565
$658,943
PART II
Take a deep breath. If the Designer internal functions have overwhelmed you, get a latte, have a glass of wine (at home, of course!), or do some yoga: SQL functions are ever more powerful and limited only by your creativity, but potentially, they are more overwhelming (especially if, like me, you have a nasty habit of putting commas and parentheses in all the wrong places). In the universe design process, this is when the power users, universe Designers, and DBAs must partner together to build a technically correct but business-robust universe. There are entire books dedicated to SQL commands alone, so it is impossible to cover all of the functions here. What follows are just a few examples of some popular objects that use SQL functions to deliver business functionality.
262
Part II:
A Better Universe
To create objects that include time period awareness or year-to-date functionality is a two-step process. First, you must determine what is the definition of “to-date”: Is it whichever accounting month the books have closed? Is it the calendar day of today? The answer to this may depend on whether you are viewing accounting information or sales order information. Accountants may want closed accounting months, whereas salespeople will want the latest date possible. The second step involves grouping the information into columns of data as shown in the preceding table. Grouping information into columns of data is described in the next section, “If-Then-Else Logic with CASE.” If users want to run rolling reports, you can provide them with condition objects that let them select current time periods or a rolling period. If you are looking for a closed accounting month, the best practice is to store the closed accounting month as a flag in the time dimension table. If this is not available, create an interactive object that prompts for the closed accounting month.
The prompt “Enter the last closed accounting month” can now be used as an @Variable in any Year-To-Date objects. For example, YTD Sales would include in the WHERE clause the following: @Select(Time\Fiscal Month Number) button, and OK.
306
Part II:
A Better Universe
To give the group Supervisors the right to create user IDs and set passwords: 1. From the main CMC, click Users. 2. Ensure that the page navigation says All Users and click Rights.
3. Click Add/Remove. 4. Under Available Groups, scroll to the Supervisors group and click >. 5. Click OK so that they appear under Home > Users > Rights. From the Access Level drop-down, change the default View to Advanced. 6. Under Explicitly Granted, click the following Rights: • Add Objects to the Folder • Change User Password • Edit Objects
Chapter 13:
Securing the System
307
7. Click OK to update the rights. 8. Click Update to save the changes to the Advanced Rights. The user Jami will now be able to create user IDs and reset passwords. She can add users to the group Finance, as Jami was granted Full Control to the Finance user group.
NOTE Remember that creating the user IDs and granting access to folders are two different tasks. Supervisors will be able to add users to only those groups for which they have Full Control, and thus can grant access only to the folders that the relevant user groups access.
So far, you’ve given users the ability to log in to InfoView, access content stored in folders, and in some cases, save content to these folders. This is the front portion of Figure 13-1. The question now, then, is where is this BI content coming from? Some of the content may be from Excel spreadsheets that get saved to the repository. If the content is from Web Intelligence or Desktop Intelligence documents, the users cannot yet refresh the data even if they have the right “Refresh the report’s data.” In order for users to be able to refresh reports or create new reports, they must also have access to a universe and a universe connection. If you want users to be able to refresh reports at any time, assign the access level View On Demand to both the universe and the universe connection. Otherwise, users may only be able to: • Create a query with no data (with the View access level). • Schedule a query (with the Schedule access level). Further, if you grant access to the universe and forget to include the universe connection, then users may successfully build a query and then try to execute the query, only to eventually receive an error message. As with documents, you can choose to organize universes into folders and grant access to groups at the folder level. In particular, I would recommend having Test and Development folders for universes that only developers or pilot users can access (unless you have completely separated these environments as discussed in Chapter 15 in the section “Approaches to Development, Test, and Production Universes”). If you don’t have dozens of production universes, you can store these universes in the top universe folder.
C AUTION For the group Everyone, the default access to all universes and universe connections is View. This allows users only to see that the universe exists and to build a query without any data. It doesn’t allow them to execute a query either on demand or scheduled. If a Designer chooses to export a universe to a specific group, then the access level is automatically changed to Full Control for the universe and Advanced for the universe connection. This potentially allows any user with access to the Designer application the ability to change a universe.
PART II
Granting Access to Universes
308
Part II:
A Better Universe
In the following example, you will allow the Marketing group to access the Sales Summary universe and Sales connection. 1. From the main page of the CMC, select Universes. 2. Click the Sales Summary universe. 3. From the universe properties page, click the Rights tab.
View On Demand also needed for this connection
4. Click Add/Remove. 5. From the list of Available Groups, choose the Marketing group and click > to add it to the list of groups with an access level for Sales Summary. 6. Click OK. 7. Change the access level for the Marketing Group to View On Demand. 8. Click Update and ensure that the rights in the Net Access column change to View On Demand. Repeat the preceding steps to grant access to the Universe connection.
TIP If each universe has only one universe connection, consider granting the group Everyone, View On Demand to all connections. The connection alone does not provide access to the data; users need access to the universe to get to the data. If, however, your data is separated physically, for example, one Sales universe but with a connection to a European sales database and a North American sales database, then indeed you may want to control access at the connection level in addition to the universe level.
Chapter 13:
Securing the System
309
As shown in the illustration accompanying Step 3 from the preceding steps, the Universe Properties page shows which connection the universe uses. 1. From the main page of the CMC, select Universe Connections. 2. Click the Sales connection. 3. From the connection properties page, click the Rights tab. 4. Click Add/Remove. 5. From the list of Available Groups, choose the Marketing group and click > to add it to the list of groups with an access level for Sales connection. 7. Change the access level for the Marketing Group to View On Demand. 8. Click Update and ensure that the rights in the Net Access column change to View On Demand.
Further Securing the Data: Column- and Row-Level Security In this chapter, you first created users and addressed user authentication. Through the use of folders and groups, you then managed access to reports within the folders and, ultimately, the universe and connections to allow users to refresh the reports or create new ones. This is the last phase of authorization or the right-most section displayed in Figure 13-1. BusinessObjects XI offers more granular security at both the column and row levels.
Object-Level Security Object-level security, often referred to as column-level security, allows you to control access at the individual object level. Do not confuse object-level security with all the references to objects in the preceding sections. Remember that objects within the repository refer to users, reports, groups, and so on. Objects within a universe and to which I am referring in this section relate to dimensions and measures. In earlier versions of BusinessObjects, object-level security was global to all universes and assigned to individual users. Thus if Jami, for example, was given the level Private, then Jami could access all Private objects in all universes she had access to. Within XI Release 2, these object levels can now be managed at the group level and are universe specific. In Chapter 9, you left all the object definitions as Public. BusinessObjects XI offers five levels of column security: Private, Confidential, Restricted, Controlled, and Public (numbered 1–5 in Table 13-5). Private, priority 1, is the most restrictive and public is the most permissive. Table 13-5 provides some sample objects for which you may want to have an object-level restriction. For example, the user Peggy processes payroll, so she needs access to social security numbers, designated as Private. Salary objects have a security access level equal to Confidential. Users with an access level of Confidential or of a higher priority (Private) can access Salary objects. Profit-related objects are set to Controlled. Members of Finance and Marketing group whose security access level is set to Controlled (in this case, anyone who has been with the firm at least three months) can access the Profit objects, as can any users that have a higher-priority security level (Restricted, Controlled, Private).
PART II
6. Click OK.
310
Part II:
A Better Universe
Object Name
Security Access Level
Priority
User or Group
Social Security Number
Private
1
Peggy
Salary
Confidential
2
All Employee Managers
Bank Balance
Restricted
3
Finance Users (but not Marketing)
Profit
Controlled
4
Finance and Marketing users
Amount Sold
Public
5
All
TABLE 13-5 Five Levels of Object-Level Security
When you use object-level security, three things happen if a user does not have access to the object: • When a user creates a new query, the user never sees the object in the universe. • When a user tries to refresh a query that contains the private object, the user receives an error message. This error message is currently very user-unfriendly: “An internal error occurred while calling the Process DPCommands, Error WIS30270.” • When a user accesses a report that contains the private object, the user does see the object in the report and if data is available, he or she sees the data. In this way, object-level security is not entirely secure. Ways to overcome this breech include either publishing reports with no data or forcing a refresh on open. You implement object-level security in two places: • The universe’s object properties, set within Designer • The universe object-level security within CMC These settings can be quite tedious to maintain. If you are not using them in your universe design or if you have implemented column-level security at the database level, leave all universe settings for objects as Public. To set the security access level on a universe object, use Designer, select Edit | Object Properties, and click the Advanced tab. Choose the desired restriction level from the drop-down box. In this example, the Salary object has Confidential access:
Chapter 13:
Securing the System
311
Within the CMC, you need to set the security access level for both the users or groups and the respective universes. You can do this either by individual universe or for all universes. In Figure 13-4, all object-level security is set for all universes according to group membership.
NOTE If you used object-level security from an earlier BusinessObjects implementation and imported those users, the import utility automatically created groups such as Object Level Security – Private.
1. From the Home page of the CMC, select Universes. 2. If you want to specify object-level security for an individual universe, user group, or user, then at this point click the desired universe. Otherwise, to apply the object-level security to all universes in the repository, select the Object Level Security tab. 3. Click Add/Remove. 4. From the list of Available Groups, choose the Object Level Security – Private group and click > to add it to the list of groups with an object-level security setting for all universes. 5. Click OK.
Security levels for all universes in this folder
Security levels assigned to groups
FIGURE 13-4 Special groups are created when object-level security is imported from earlier versions of BusinessObjects.
PART II
To set the object-level security for all universes, follow this procedure:
312
Part II:
A Better Universe
6. Change the default object-level security for this group from Public to Private. Note that the levels available are listed in order of precedence.
7. Click Update and ensure that the rights in the Net Security column change from Public to Private.
Object Restrictions Object restrictions are similar to object-level security. They have the same impact on a user’s ability to create new reports containing an object or to refresh a report. Some key differences: • Object-level security has multiple levels; object restrictions are binary in that either you can see the object by default or access to the object has been removed. • Object-level security is defined both in the CMC and the universe object definitions; object restrictions are defined only within Designer, Tools | Manage Security. • Object-level security applies across multiple universes; object restrictions apply to a specific object within that one universe. • You set object restrictions within Designer.
Chapter 13:
Securing the System
313
In the following example, the user Sam works in Supply Chain. He has access to a Sales universe, so he can see the orders; however, he should not be able to see the measure object Margin. In setting this restriction, you first set the restriction and then apply it to the user or group.
Create an Object Restriction When you create a restriction, you must group multiple restrictions together. To create an object restriction,
2. From the pull-down menu, choose Tools | Manage Security | Manage Access Restrictions or select Manage Access restrictions from the toolbar.
3. Designer will present you with a dialog that displays existing restrictions and groups to which they are applied. Click New. 4. For Restriction Name, enter Margin Restriction, and then select the Objects tab. 5. Click Add to insert an object. 6. Designer presents you with a New Restricted Object box. You can manually enter the Class\Object or click Select to use the Object Browser to expand any classes and select the individual object that you wish to restrict. In the next screen, I am adding a restriction on Margin.
PART II
1. Launch Designer and open the universe for which you wish to remove access to an object.
314
Part II:
A Better Universe
7. Click OK to close the Object Browser and return to the New Restricted Object dialog box. 8. Click OK to add the object to the list of restricted objects.
Objects hidden from users
Check All verifies the objects still exist Click Add to add more object restrictions Reset removes all object restrictions
9. Click OK to close the Edit Restriction dialog and return to Manage Access Restrictions dialog. At this point, you have defined which object(s) you want to restrict. You can now apply this restriction to the user Sam or to the group Supply Chain.
Apply an Object Restriction To apply an object restriction, follow these steps: 1. From within the Manage Access Restrictions dialog, select Add User Or Group.
Chapter 13:
Securing the System
315
2. From the Select Users and Groups dialog, you can scroll to the individual user or, if you have many users, search for them. To search for the user, enter the name in the Search For Text box and click the binoculars icon.
PART II
Toggle to see only groups or users
Start search
Search for user
Group or user to whom restriction applies
NOTE All groups and users are displayed in this dialog, even though these groups may not have access to the universe. You only want to apply object restrictions to groups or users that have access to the universe. 3. Select the user and click > to add the user or group to the right-hand side of the dialog, Selected Groups And Users. 4. Click OK to apply the change and close the dialog. 5. From the Manage Access Restrictions dialog, ensure that both the newly created restriction, Margin Restriction, and the user Sam are highlighted. Click Apply. In the following screen, under the Restriction column, indicates the restriction
316
Part II:
A Better Universe
has not yet been applied to the user. Once you click Apply, this column will change to Margin Restriction. Click here to apply
Not yet applied
Set to OR for row restrictions
C AUTION If you fail to click Apply in this last step, the restriction will not be implemented. 6. Click OK to save the restriction definitions and close the dialog.
NOTE Object restrictions apply to all instances of a user regardless of security access level and regardless of whether the restriction is inherited. If you have multiple instances of a user with different ways to inherit access to a universe, the objects will always be hidden, as the object restriction applies. When a user builds a query, the user will no longer see the restricted objects from the object list. If a user tries to refresh a query that contains a restricted object (or for which the user does not have sufficient security access), the user receives the error message shown here.
Chapter 13:
Securing the System
317
Many changes in Designer become available to users only when the universe is exported to the repository. However, with security restrictions, these changes are saved in real time to the repository.
Universe Parameter Restrictions: Connection, Controls, SQL
NOTE In the last section, you created an object restriction. In the subsequent sections, you are creating controls and row restrictions. When you want these restrictions to apply to the same user or group, you must create them as a set. It is not possible to apply multiple restriction sets to the same user or group. For example, the Finance group can only have the Big Queries restriction set applied to them and not also a different connection parameter. If you want to have both applied to the Finance group, you would need to define both restrictions under the same set. In the following example, the group Everyone can access all the reports in the \Finance folder. However, you may decide that while the members of Everyone may be allowed to execute queries that return no more than 100,000 rows, members of the Finance group should be able to return queries with 300,000 rows of data and longer execution times. 1. From within Designer, choose Tools | Manage Security | Manage Access Restrictions or click Manage Access Restrictions from the toolbar. 2. Under Available Restrictions, click New to create a new set of restrictions. 3. In the Restriction Name box, enter Big Queries. 4. Select the Controls tab, shown next. Designer displays the default settings from Universe Parameters. (For a further explanation of the settings on these tabs, see Chapter 7.) Any changes you make for the specific user or group are highlighted
PART II
In Chapter 8, you set a number of parameters in the Test Fashion universe. You can override certain parameters by group or by user. For example, the default result set for a universe may be 100,000 rows; with Access Restrictions, you could increase this to 300,000 rows for certain power users. These are sometimes referred to as universe overrides because they override the default universe parameters. Keep in mind that these controls are universespecific and would not, for example, allow power users to retrieve 300,000 rows of data from all universes. You also can set a different database connection for certain users or groups. This is useful if your database is replicated on two servers (for response time or security reasons). For example, a European group could have a connection to a database with just European Sales data that is physically located in Europe. A North American group could have a connection to a database with North American sales, physically located in North America.
318
Part II:
A Better Universe
in red. To restore the universe defaults, click Reset. In the following example, increase the size of result set to 300,000 rows and the execution time to 10 minutes.
Settings different from default are red
Reset to default
5. Select the SQL tab to control how SQL is generated and which operators the individual user or group can control. 6. Click OK to save your changes to this restriction definition. Now apply the Big Queries restriction definition to the Finance group: 1. From within the Manage Access Restrictions dialog, select Add User Or Group. 2. From the Select Users and Groups dialog, scroll to the Finance group. 3. Select the group and click > to add group to the right-hand side of the dialog, Selected Groups And Users. 4. Click OK to apply the change and close the dialog. 5. From the Manage Access Restrictions dialog, ensure that both the newly created restriction, Big Queries, and the group Finance are highlighted. Click Apply. 6. Click OK to save the restriction definitions and close the dialog.
Row Restrictions Row restrictions restrict the rows returned in a query by appending a SQL WHERE clause to every query a user runs. Multiple row restrictions are appended to the query with AND. New in XI is the ability to connect the restrictions with an OR. Row restrictions are useful for security purposes, but also for user productivity. They save users time by automatically filtering the data according to what they need to see. Companies that have complex security requirements may elect to implement row restrictions at the database level rather than through BusinessObjects.
Chapter 13:
Securing the System
319
PART II
FIGURE 13-5 The Marketing group is organized by product and region. Row restrictions allow data to be filtered automatically.
Figure 13-5 shows a more detailed organization for the Marketing group. The group is organized by a combination of product managers who can view global information, and regional managers who can view sales information within their regions only. For example, Nancy is the Product Manager for children’s clothes (product category = Girls, Boys). Nancy should be able to view all sales for these product categories, regardless of which country the customer resides in. Helle is the Regional Manager for Europe; she should be able to view sales for all product categories, but only where the region is Europe. Figure 13-6 shows all data rows available in the source system. In order to restrict which rows of data Nancy sees, you will add a restriction for SH.PRODUCTS.PROD_CATEGORY IN (‘Girls’,’Boys’). Helle needs the restriction SH.COUNTRIES.COUNTRY_REGION = ‘Europe’. 1. From within Designer, choose Tools | Manage Security | Manage Access Restrictions or click Manage Access Restrictions from the toolbar. 2. Under Available Restrictions, click New to create a new set of restrictions. 3. In the Restriction Name box, enter European Data. 4. Select the Rows tab.
320
Part II:
A Better Universe
5. Click Add to insert a restricted table. 6. From the dialog at right, click >> to see a list of available tables. Choose SH.COUNTRIES. 7. Enter the WHERE clause SH.COUNTRIES. COUNTRY_REGION = ‘Europe’. Alternatively, click >> in the Where Clause box to call the Where Clause Definition box.
Helle, Regional manager of Europe, only sees these rows
Nancy, PM for Boys and Girls, only sees these rows
FIGURE 13-6 and Helle.
Corporate users see all data available, but a WHERE clause will filter the data for Nancy
Chapter 13:
Securing the System
321
8. Click OK to return to the Edit Restriction dialog box, shown here.
PART II
9. Click Check All to verify that the object still exists in the universe.
C AUTION Check All only verifies that the universe object exists in the repository; it does not verify SQL syntax or valid data values. If you enter either of these incorrectly, users will receive an error or no rows when a report or query is refreshed. 10. Click OK to close the restriction definition. 11. Apply the restriction definition to the user or group as in the previous sections. Row restrictions can be quite powerful but also problematic if restrictions are applied against multiple groups. Row restrictions do not have priority levels; instead, all restrictions are used to generate the WHERE clause and by default are connected with AND. For example, if the Marketing group incorrectly contained a row restriction for REGION=‘Americas’ and Helle’s individual user restriction contained REGION=‘Europe’, Helle would have no rows returned, since the two conditions are appended to the query with an AND connector. With BusinessObjects XI Release 2, you can override this default behavior and specify to use an OR connector: 1. From within the Manage Access Restrictions dialog, select the cog wheel icon in the bottom right.
322
Part II:
A Better Universe
2. Choose the option “Combine row restrictions using AND within group hierarchies and OR between groups.” Click OK.
Database Views vs. Row Restrictions Companies that have unique logins to the data source often create views for each user or group of users to accomplish the same thing as Designer’s row restrictions. To implement this, the DBA would create a security table that contains each user and a column with the data values for each restriction. The security table is then joined to the fact or dimension tables to ensure users see only their own data. There is no best solution for how to accomplish row-level security. Views may be easier to implement for many users with multiple security restrictions. Views are database-specific, so if your company uses more than one BI tool, the security model is open and independent of the tool. However, too many views may confuse a database optimizer, and queries may not be processed as efficiently. Unless the DBA creates an application to maintain the row restrictions, security becomes centralized with the DBA. Simple WHERE clauses generated when security is managed through Designer will leverage the optimizer. However, the security settings are not seamless and can be more difficult to maintain for larger user groups.
Table Mappings Table mappings provide another way to implement row-level security. Table mappings allow universe designers to remap the base table in a universe with a different table name. In this way, a corporate group of users may access data in a corporate fact table, whereas a regional group may access data in a regional table that contains less data. These “tables” do not necessarily need to be physical tables; they can also be database views. In order for table mappings to work, the column names from the original table used in the universe must be exactly the same as the column names in the mapped table.
Chapter 13:
Securing the System
323
To follow on the example in Figure 13-6, I could have multiple tables, either views or physical tables: • SALES that contains all sales data • CHILD_SALES that contains a subset of data for PRODUCT_CATEGORY IN (‘Boys’,’Girls’) • EURO_SALES that contains sales for REGION=‘Europe’ To remap a table, create a new or edit an existing restriction set and then apply it to the group or user.
2. Under Available Restrictions, click New to create a new set of restrictions. 3. In the Restriction Name box, enter European Data. 4. Select the Table Mapping tab. 5. Click Add. 6. Use the Select button to launch the table browser or enter the default table name in the universe. This is the name of the table that you will be replacing. If you use the Table Browser, click OK to return to the New Table Mapping dialog box, shown next.
PART II
1. From within Designer, choose Tools | Manage Security | Manage Access Restrictions or click Manage Access Restrictions from the toolbar.
324
Part II:
A Better Universe
7. Position your mouse in the Replacement Table box. Use the Select button to select the new table or enter the new table name—in this example, SH.EURO_SALES.
8. Click OK to return to the Edit Restriction dialog box. 9. Click Check All to verify that the table names exist in the universe structure. 10. Click OK to save the table mapping. 11. Apply the restriction definition to the user or group as in the previous sections.
Setting Restriction Priorities While Row restrictions are all taken into consideration and connected with an OR or AND connector, for other restrictions, only one should be valid. For example, only one table mapping should take effect. You can specify which restriction should take precedence in the event that a user belongs to more than one group to which such a restriction has been applied. For example, in the earlier section, you increased the row limit for the Finance group. Let’s assume that you also had a row restriction for the Marketing group that set the row limit to 200,000. If a user belongs to both groups, which restriction should take priority, the 300,000 row limit specified for the Finance group or the 200,000 row limit for the Marketing group? By default, the priority goes according to the order in which the users or groups are listed in the Access Restrictions. You can change this by manually setting the priorities. Priority 1 takes precedence over Priority 2 and so on. In the following example, you will set the Finance restriction to take priority over the Marketing restriction: 1. From within Designer, choose Tools | Manage Security | Manage Access Restrictions or click Manage Access Restrictions from the toolbar.
Chapter 13:
Securing the System
325
2. Note the Priority numbers in the following screen. You want to make Finance the top priority. Select Priority. If the Priority button is dimmed, be sure you have first selected a user or group.
PART II
New priorities
3. From the Set Group Priority dialog, move the Finance group to the top by selecting the group and clicking Move Up.
326
Part II:
A Better Universe
4. Click OK to close the Set Group Priority dialog. 5. Note in the Manage Access Restrictions dialog that the priority numbers are now a 1 for Finance and 2 for Marketing. 6. Click OK to save the changes to the priority levels.
Previewing Net Restrictions When a user belongs to more than one group or when you combine multiple restrictions into one set, it’s helpful to see what the net impact is: how will the restrictions be combined. To see this net effect, Designer provides a Preview option.
NOTE I recommend you use the Preview option from the toolbar or the pull-down menus and do not use the Preview button from within the Manage Access Restrictions dialog. When you use the Preview button from within the Manage Access Restrictions dialog, it does not immediately reflect all the restrictions. Also, you cannot readily check net restrictions for all groups and users. As an example, the user Sam was explicitly given an object restriction such that he cannot see the Margin object. He also may have inherited some row restrictions by belonging to the Marketing group. To preview his net restrictions, follow this procedure: 1. From within Designer, choose Tools | Manage Security | Preview Net Access Restrictions or click the button from the toolbar. 2. Scroll to the desired user or group or use the search capabilities to find the user or group. 3. Click Preview. 4. The Restrictions Preview dialog shows which restrictions affect the user, regardless of whether they were assigned via a group or an individual user. Note that only the tabs that contain restrictions appear in this preview. 5. Click Close to exit the preview and close again to exit the user list.
Only tabs with restrictions appear User or group Changes from default in red
Chapter 13:
Securing the System
327
Summary The security capabilities within BusinessObjects XI Release 2 have changed significantly from earlier versions of BusinessObjects. The options are more granular, providing more power but also risking confusion. In planning your implementation, first understand what is possible and then begin developing a security approach that fits your company security philosophy. Remember the following: • Leverage external authentication and single sign-on when possible. • Use Groups and Folders to simplify maintenance.
• Access-level security affects which menu options appear to end users within InfoView and within the individual applications. • Explicit access takes priority over inherited access. Thus if a user has inherited the right of denied to a particular report or folder and then the same user is explicitly granted the View On Demand right, the user will be able to view and refresh the document. • With object-level security (Private to Public), the most permissive right applies. Thus if a user is granted Private in one place and Public in another place, then the Private access prevails. • Restriction sets affect universe objects, rows of data, and SQL behavior. Group multiple settings together and apply them to different groups.
PART II
• With access-level security, the most restrictive rights apply when the rights are inherited through group membership. Thus if a user is granted view access in one folder through a group assignment and then denied the right to view an object (different from “no access” which translates to “not specified”) via a different group membership, the more restrictive setting takes priority and the user will not see the folder.
This page intentionally left blank
14
CHAPTER
Design Principles: Where to Put the Intelligence
Y
ou have built your universe, made it more robust with advanced objects and hierarchies, and developed a security strategy. You are off to a good start. As your universe evolves, you will face a number of choices about where to put the intelligence, specifically the business intelligence. This chapter focuses on the alternatives and the pros and cons of each alternative. My goal is to help you understand the cost/benefit implications of the choices as you deploy BusinessObjects XI.
What Is Intelligence? Intelligence is information with a business context. QUANTITY may be a physical column in a table. Add a time period such as month, then a context to the time period such as order month, and multiply the column by a price, and you arrive at Sales Revenue, something with meaning and value to business users. Users will rarely want to analyze straight columns of detailed data. If they did, the transaction or Enterprise Resource Planning (ERP) system would meet their needs just fine. To provide a business context, the raw data must be combined with other information, perhaps cleansed, transformed, and aggregated. Many transformations may be critical to the project’s success and known to programmers and Extract Transform and Load (ETL) experts; however, they mean nothing to a business user. If a customer code is 306 in one system and 0306 in another system, the business person really doesn’t care. The business person only cares and knows that this 306/0306 customer is Mrs. Whitwell. Transformations to make the data consistent are necessary to build the data warehouse or mart but are a given to the business user. If the business user wants to do a promotion for newly married customers, then perhaps classifying these customers under a grouping such as Newlyweds would be a form of intelligence. At first glance, you may assume that this customer grouping should exist in a dimension table. A dimension table within the database is certainly one place to put the intelligence, but the customer grouping could also go in the universe or a user’s report.
329 Copyright © 2006 by The McGraw-Hill Companies. Click here for terms of use.
330
Part II:
A Better Universe
Following are a few more examples of items that I would consider to be more than just straight calculations or transformations; they provide business intelligence: • Measures that include time periods, such as Sales Year To Date or Days Late • Variance analysis that compares the difference between two numbers, such as Current Year Sales versus Last Year Sales, Percentage of On-time Shipments • Ratios, such as Market Share, Patient Visits per Diagnosis, Gross Margin • Dimension groupings, such as customer age, income level, product size or type
Places for Intelligence There are a number of places to create and store this intelligence. Often, the decision of where to build the intelligence is based on one person’s knowledge of how to do it; it’s assumed there is only one alternative. For example, a universe designer may naturally assume that the universe should contain all the intelligence. Power users may want user objects and report variables to contain all the intelligence. Depending on how much disk space and time a DBA has, the DBA may want the intelligence to be in the table design so that it is tool-independent. This is where a good Program Manager or Project Manager will work with the different stakeholders and determine the best place for intelligence, considering a company’s resources, time, and flexibility. Guidelines should become best practices and part of a quality assurance process. Companies can build intelligence into OLAP databases, the data warehouse, the universe, or user objects and reports. If you are using BusinessObjects XI directly against a transaction system, your alternatives may be limited to the universe and reports. Figure 14-1 shows these different places and where the intelligence gets processed. In Chapter 11, you built an object called Current Year To Date Sales as part of the universe. Stepping through Figure 14-1, you could have used an OLAP database such as Microsoft Analysis Services to include the time period awareness in the sales column (place 1). The processing for this type of object is done on the OLAP server. The intelligence also could be a physical column in an aggregate fact table. The information is preprocessed by the RDBMS, so when a user runs a query, it is a simple fetch (place 2). If the object exists in either the universe or a user object, the RDBMS again does the work but does it upon query execution. The user may wait longer for the query to be processed, but the work is still done by the RDBMS. Larger-scale BI implementations will always strive to do more processing on the server, rather than on the mid-tier BI application server or, worse, on the user’s desktop. If a power user creates a report variable to calculate Current Year To Date Sales, then the RDBMS sends the detail rows to calculate that variable to either the Enterprise server in a Web Intelligence environment or the user’s desktop if it is Desktop Intelligence. In a thinclient environment, the BusinessObjects Enterprise server must calculate the variable and present the results to the user in HTML format (place 3). With Desktop Intelligence, all the detail rows travel the network to the desktop PC that then calculates the report variable (place 4).
Chapter 14:
Design Principles: Where to Put the Intelligence
331
PART II
FIGURE 14-1 Intelligence can be built into a number of places in a BusinessObjects XI deployment.
Evaluating the Pros and Cons of Each Alternative Occasionally, there is a single, clear-cut choice for where to put the intelligence. You are low on disk space, so you add it to the universe; the calculation is too complex for SQL, so you create a report variable. These are the easy answers. The not-so-easy answers are everything else in between. The best place for intelligence is as suggested by the consultant’s annoying but valid answer “it depends.” In the following sections, I offer examples of business intelligence that are better suited to one place than another. Each alternative will have a cost associated. The question you must answer is whether the benefits outweigh the costs and disadvantages. Building intelligence into the fact table provides faster response time and consistent results; is this a strong enough benefit to justify the cost of redesigning the table, modifying the load routines, and buying more disk space? In some cases, absolutely. In other cases, no.
OLAP Databases In presenting this topic at user groups and conferences, the percentage of companies that integrate OLAP databases with the BusinessObjects Enterprise deployment remains small. There are a number of reasons for this.
332
Part II:
A Better Universe
OLAP Databases as Independent Applications Companies often treat OLAP databases as separate applications for several reasons. First, each OLAP vendor provides their own access tools: • Hyperion provides Web Analysis (formerly named Analyzer) and a spreadsheet add-in to access Essbase OLAP databases. As Hyperion has now entered the query and reporting space, Hyperion and Business Objects increasingly compete with one another. • Microsoft uses Excel to access MS Analysis Services cubes and in Q2 2006 announced intentions to acquire ProClarity to provide visualization and dashboard capabilities to Analysis Services. • Business Information Warehouse (BW) provides Business Explorer as a front end to BW (Net Weaver) Info Cubes. Just as data marts and BI implementations can be implemented departmentally, so can OLAP databases. Unless a business sponsor and program management are in place to integrate the two, it seems rarely to happen. As these leading OLAP vendors offer their own front ends to their databases, customers often incorrectly assume that they must use the corresponding front end. Furthermore, Business Objects’ approach to OLAP access has gone through many transitions, so confusion and lack of awareness abounds. With BusinessObjects XI, the vendor now offers OLAP Intelligence, previously called Crystal Analysis, as a way of accessing third-party OLAP databases. Also, new in XI Release 2 is the ability to access OLAP databases through a universe. Finally, BusinessObjects XI itself, with its microcube engine, is also considered an OLAP tool. Thus, many companies assume that they need only BusinessObjects XI and do not need another OLAP database. This assumption is reasonable. However, because of some of the inherent limitations with the dynamic microcubes, there are instances in which an OLAP database can provide some significant benefits—as long as the competing vendors do not encroach on each other’s space within a customer organization. One of the biggest differences between the OLAP capabilities via the BusinessObjects XI microcube and an OLAP database is the data volume. There is no hard rule as to the size of a BusinessObjects XI microcube; it could be 300,000 rows of data. It would not be 3 million, as is the case of an OLAP database. In this respect, it is much more appropriate to think of applications such as MS Analysis Services and Essbase as databases or data sources than as competing tools. There also is a significant difference between drilling within a microcube and drilling against an OLAP data source. The goal with any OLAP deployment is to ensure that when users drill, it is at the speed of thought. Because an OLAP database is pre-aggregated, the response times are more predictable than relational query times. To ensure fast drilling times against a Desktop Intelligence or Web Intelligence microcube, report developers often cram too much information into a report. They are trying to get the microcube to act like an OLAP database. This approach is doomed to failure. When users drill within either a Web Intelligence or Desktop Intelligence report, they are drilling within a subset of cached data, as shown in Figure 14-2. When a user drills from year to quarter, the details for quarter already exist in the report. If not, then the user can drill through to the details and send another query to the relational database. The results are fetched and stored in the microcube. Herein lies a challenge: if your relational database is well tuned, this drill through to detail could take a few seconds or a few minutes (hopefully
Chapter 14:
Design Principles: Where to Put the Intelligence
333
PART II
FIGURE 14-2 Users drill within reports.
not hours). And what if the majority of users never look at quarterly details? Then you have unnecessarily built a larger report than required! Meanwhile, with an OLAP database such as Essbase or Microsoft Analysis Services, the cube is built in advance of the query. When a user drills from Year to Quarter, the drill goes against the highly tuned OLAP database as shown in Figure 14-3. This limits network traffic, as only the necessary results are sent to the BusinessObjects Enterprise server, as each user requests the details. The OLAP server performs sorts, nested rankings, cross-dimensional calculations, and more.
Advantages of Building Intelligence into OLAP Databases Clearly, for this section to have any relevance, your goal is to integrate your OLAP database as another data source in your BusinessObjects XI deployment. The question becomes, then, when to build intelligence into the OLAP database. As shown in Figure 14-1, when the intelligence is put in an OLAP database, the server does the work (place 1), thus minimizing network traffic. In general, building intelligence into any server-based technology will also ensure consistent business definitions (compared to varying calculations in user reports and spreadsheets). Further, OLAP databases have a better understanding of business analysis than most SQL-based reporting tools, so a number of functions are built into the OLAP engine. For time period calculations, Essbase includes dynamic period-to-date calculations with a toggle. Period-to-date functions are native to MDX and MS Analysis Services, rather than the complex SQL CASE functions presented in Chapter 11. Recall the discussions on
FIGURE 14-3 Drill within OLAP Intelligence is against the OLAP database.
334
Part II:
A Better Universe
semi-additive measures (from Figure 9-2) and the issue with comparing inventories and account balances (one point in time) with material movements and debit/credits (a period of time). BusinessObjects XI handles this through multiple SQL statements and user training; however, OLAP databases again are aware of these issues and allow you to flag with a simple setting that such measures may be aggregated by product, for example, but not by time. OLAP databases also provide you with more control over the calculation order, something particularly important for ratios and percentages. As an example of calculation order, look at the calculations for profit as a percent of sales, as shown in Figure 14-4. To get sales and profit totals for quarter four, you correctly sum across the rows. However, for profit as a percent of sales, if you sum across, you get an incorrect percentage of 84. To calculate percentages and ratios, you need first to get the sums by quarter, and then calculate down to take profit/sales. This second calculation gives you the correct result of 28 percent. Similar to this concept of a two-pass calculation are multidimensional and forwardlooking calculations. As shown in the next screen, profit and sales are at two different levels within the accounts hierarchy. To calculate profit, one must first know the subtotals for Margin and Total Expenses. Profit is not a simple sum, but rather, an aggregation of Subtotal Margin – Subtotal Expenses. To calculate profit as a percentage of sales, you must know both levels of subtotals, as well as the detail Sales that is used to calculate the Margin Subtotal; the database must look “forward” to first calculate Profit before it can calculate Sales as a percentage of Profit.
First subtotal
Second subtotal = Margin – Total Expenses = Profit/Sales: 52265/184972
This is simple for an OLAP database, which understands dimension members and levels (just say Profit % Sales!), but not so simple for SQL. Are there ways of doing this in the fact table, universe, or report? Of course! It’s all a matter of the time and cost to implement and maintain the intelligence. An OLAP database is also an ideal place to store dimensional information that needs to be aggregated in different ways. As discussed early in this chapter, a customer dimension could have groupings by physical region (customers in California) or by type of customer (newly married). Users are viewing the same measures but by different groupings. OLAP tools allow dimensions to be aggregated in different ways, often without drastically increasing the size of the database.
Disadvantages of OLAP Databases Before you rush out to implement the latest version of an OLAP database, note that they do have their disadvantages. First, they are another database and another data source. If your
Chapter 14:
Design Principles: Where to Put the Intelligence
335
Wrong value!
PART II
FIGURE 14-4 Percentages and ratios require a two-step calculation that OLAP databases easily handle.
organization is strapped for IT resources, you may be forced to limit which technologies you can support. As a separate database, it is another copy of the data, so there are latency and extraction issues. However, if the OLAP database is tightly integrated correctly with your data warehouse, I would argue that it is in fact another, smarter way to provide aggregate tables. OLAP databases are famous for ensuring consistent response times on precalculated data; however, this requires smaller data sets than what an RDBMS can handle. Some OLAP databases allow you to store data in relational tables (ROLAP) to increase capacity, yet this will have a performance impact. OLAP databases are not well suited for list analysis, and support for attribute analysis varies greatly. For example, if you want a list of customers above a certain age or a list of products packaged a particular way, OLAP databases generally do not support list-style reports. The following table summarizes the key benefits and disadvantages to putting the intelligence in an OLAP database: OLAP Database Benefits
OLAP Database Disadvantages
Understanding of semi-additive measures like inventory
Additional cost and expertise
Control over calculation order for ratios and percentages
Risk of duplicate, inconsistent data if not integrated with data warehouse
Multidimensional and multirow calculations
Expertise generally comes from IT
Aggregated, so fast, consistent response times Server-based, so consistent business definitions and minimal network traffic Built-in time period awareness such as year-to-date, year-over-year variances
336
Part II:
A Better Universe
Relational Tables Building the intelligence into relational tables provides many of the same benefits as OLAP databases: • Tables are preprocessed and so are generally faster than the dynamic SQL that a universe or Desktop Intelligence user object would use. • Tables involve server-based processing, so only limited data is sent across the network. • Tables are server-based, so business definitions are consistent. Again taking the example of Current Year To Date Sales, a DBA could build a fact table with the following structure: product_key
customer_key
time_key
C_Month
LY_Month
C_YTD
L_YTD
123
111
102003
500
400
5000
3850
456
111
102003
200
180
2000
1800
123
333
102003
710
300
7100
3000
123
777
102003
900
1000
8000
10000
As the data is loaded into the fact table, each column represents a “bucket” of information with the time period intelligence built into each column. C_MONTH contains sales for just the current month; C_YTD contains sales for each month in the current year. If the month is October, it contains sales from January through October. Data Integrator has a date generation transform, which generates the time periods needed (quarter, month, year, week, etc.). By using our special functions, we can aggregate fact data to these time periods and load the Fact tables in the warehouse with an appropriate indication of the “bucket” used. You can also create aggregations that manage running ytd, mtd, qtd fields. You use DI’s stateful functions to do this. Many analytic applications that build data marts (including SAP BW’s Info Cubes) use this kind of structure. However, if your company designs and builds your own fact tables, the DBA must program this kind of intelligence into the load routines; unlike in OLAP databases, there may be no simple toggle to achieve time period intelligence (although newer data integration tools may assist with this). A robust ETL tool may help with the process. For example, BusinessObjects’ Data Integrator has a date generation transform that will take an individual date value and create the appropriate year, quarter, and month hierarchies. Data Integrator also includes special functions to load data into fact tables to create running year-to-date measures, month-to-date measures, and so on. Even with an ETL tool, this kind of design requires more disk space and a stronger understanding of best practices in data warehouse designs. DBAs may not have the resources to implement this kind of design or the time. (Show me a DBA who is not overworked and overscheduled!) Recall from the first section in this chapter that dimension groupings such as customer age, income level, and product size are also forms of intelligence. Analyzing data by dimensions is the bread and butter of most businesses. Providing alternative groupings can help reveal
Chapter 14:
Design Principles: Where to Put the Intelligence
TIP If you do have dimensional information in a departmental database, different from the central data warehouse, this still may be accessible via Web Intelligence. It requires some creativity and some organizational issues, but here is a work-around: Web Intelligence in XI Release 2 allows for synchronized multiple data sources in a document. With this capability, the central data warehouse team does not have to load the departmental dimensional data into the central data warehouse to make it accessible to end users. They do, however, have to allow the department to build a universe off the departmental data source. End users can then easily combine the data from the central data warehouse universe with the dimensional data in the universe from the departmental data source.
When Not to Store Intelligence in Relational Tables Relational tables are not a good place to physically store ratios and variances, as the ratio always needs to be recalculated with an aggregated numerator and an aggregated denominator. To follow on the earlier example, let’s say you want to calculate the percentage variance between the current year-to-date sales (C_YTD) and last year’s year-to-date sales (LY_YTD). For each row in the database, you can correctly store the variance. product_key
customer_key
time_key
C_YTD
L_YTD
% Variance
123
111
102003
5000
3850
29.87%
123
333
102003
7100
3000
136.67%
123
777
102003
8000
10000
–20.00%
However, recall that Web Intelligence users will create reports that dynamically group information by dimensions. Thus a business user may ask for a variance analysis by product. In order to allow this, the universe designer includes the SQL SUM aggregate in the object
PART II
previously hidden patterns. For example, let’s take a wine merchant. Users can analyze sales by type of wine and rating. Users also can see which customers buy the most wine. Now break that customer list down by corporate customers versus individual consumers, and the analysis will reveal which group of customers generates the most business. If the dimension table contained income information for each corporate customer, the wine merchant can better understand if large corporate customers are more profitable than small business owners. The same logic applies to product information: what are sales for soft drinks in plastic bottles versus aluminum cans? Unfortunately, this kind of dimensional information is often not captured, or when it is captured, it is stored in departmental databases and spreadsheets. While Desktop Intelligence users can incorporate personal data sources into their reports, I would advocate that more dimensional information be stored in sources that are accessible to more users. If companies use a star or snowflake schema in data marts, then a data mart can contain both a standard customer dimension and a customer dimension with business-specific groupings and hierarchies. BusinessObjects XI can handle multiple dimensions with alternate hierarchies in each. Further, dimensional information in relational tables allows users to create lists and easily do attribute analysis with the information, a type of analysis that not all OLAP databases support and that is not possible when such information remains in personal workspaces only.
337
338
Part II:
A Better Universe
definition. This incorrectly sums the individual variance rows, suggesting that sales are 146.54 percent higher than last year’s sales. This is wrong! product_key
customer_key
time_key
C_YTD
L_YTD
% Variance
123
111
102003
5000
3850
29.87%
123
333
102003
7100
3000
136.67%
123
777
102003
8000
10000
–20.00%
20100
16850
146.54%
Subtotal for product 123:
Wrong!
To arrive at a correct variance, you must get the subtotal for the C_YTD by product 123, and then the subtotal of L_YTD to arrive at a correct variance of sales being 19.29 percent higher than last year. OLAP databases allow an administrator to control the calculation order; SQL tools do not. To guarantee correct results, the universe designer would ignore the variance column in the fact table and dynamically calculate the variance using a SQL statement in an object. Refer to Chapter 11, under “Ratio to Report,” for specific examples.
Summary The following table summarizes when to store the intelligence in a fact table and when it poses disadvantages: Relational Table Benefits
Relational Table Disadvantages
Precalculated in the table, so fast, consistent response times
Requires complex programming logic in the load routines
Server-based, so consistent business definitions and minimal network traffic
Fixed table design may limit flexibility IT/DBA must implement Requires additional disk space Not suitable for ratios and percentages
Universe I confess I am biased: I prefer to put as much intelligence as possible in the universe. Of course there are exceptions, but let’s start with the arguments for the universe. Intelligence in the universe offers much more flexibility than either an OLAP database or a relational table. When you add or modify an object, there is no need to restructure and recalculate a cube; there is no need to modify load routines and rebuild a table. The universe does not require the additional disk space that either OLAP databases or RDBMS tables require. Because the universe is centralized, it enforces consistent business definitions. Further, as shown in Figure 14-1, the processing is done on the database server, thus minimizing the impact on the network or BusinessObjects Enterprise servers that user report formulas can overload. The universe allows partial control of the calculation order, necessary for ratios and variance analysis, something relational tables cannot offer in an ad hoc reporting environment. In the preceding example, you cannot aggregate the variance stored in a
Chapter 14:
Design Principles: Where to Put the Intelligence
339
relational table or you get incorrect results. Within the universe, one uses the following syntax to control the calculation order: (sum(C_YTD)-sum(L_YTD)) /sum(L_YTD)
Alternatively, with databases that support newer SQL analytic functions, you can calculate ratios as RATIO_TO_REPORT(sum(SH.SALES.AMOUNT_SOLD)) OVER ( )
NOTE Programmers and DBAs certified in SQL are not necessarily adept at SQL for business reporting; this is often a unique and hard-to-find skill set. However, unless the IT department has a close relationship with the business and an understanding of business reporting requirements, they may miss opportunities to add intelligence to the universe. Users do not know SQL and do not know what objects can be built with SQL; IT knows SQL but may not realize that the business would benefit from measures such as number of customers (COUNT function), number of late orders (COUNT and DAYS_BETWEEN functions), variance analysis ((SUM1–SUM2)/SUM2), and so on. Further, a recurring complaint about IT maintaining the universe is lack of flexibility. Users want something, and IT is either too busy to implement it or wants to keep the universe general. This is when it makes sense to allow individual functions or business units to build and maintain their own universes. IT should still quality-assure these universes (see Chapter 16, under “Quality Assurance Check List”), but it may be easier to teach a power user how to build a universe than to get IT resources to build the universe the way the business wants. When a universe designer fails to build enough intelligence into the universe to satisfy the common business needs, end users are forced to create their own objects or to build the intelligence in the report. This approach may be fine for individual needs, but it can be a disaster for reports that are widely shared, as it can significantly increase maintenance costs and the risk of inconsistent business definitions. While current Sarbanes-Oxley compliance efforts seem focused on ensuring the integrity of information on the data capture side, I
PART II
As users build queries that analyze the percent variance by different dimensions (product, time, geography), the variance for each row returned is always recalculated with the correct numerator and denominator. Problems may arise when users add breaks and subtotals within a report, but this can easily be corrected with report formulas. Intelligence in the universe also does not necessarily require an overworked/understaffed IT department to implement. New intelligence can be added quickly, as is critical in a changing business environment. Responsiveness and flexibility are the two main reasons I am biased toward building intelligence into the universe. If the BI deployment cannot respond as quickly as the business requirements change, it will be less successful. Requirements change not simply because users “overlooked” something, but more often because they discovered a new or better way to explore information. Did anyone want to link click stream analysis with brick-and-mortar store sales before 1997? No. The majority of companies put control of the universe in the hands of IT. This can be for the good, as IT staff have the skills to understand relationships between tables, joins, and index issues. They also can write complex SQL.
340
Part II:
A Better Universe
would expect efforts to increase in the reporting environment. With BusinessObjects XI, there is no way to tell what has changed within a report. So if a user changes a report variable that suddenly calculates revenue in a slightly different way, there are no controls to document and identify this change. Changes in the universe at the object level are also not readily identifiable, but as a smaller group of developers are involved, they at least can be documented procedurally.
Disadvantages of Intelligence in the Universe Even though I prefer to build a robust universe, there are times when the universe is not the best place for the intelligence. Advanced objects will generally use complex SQL or internal Designer functions to create the objects. This can result in unpredictable query response times, unless you have taken the necessary steps to ensure consistent performance. Also, as the universe becomes more complex, there is a greater risk that certain objects will not work well together. For example, if a universe contains the two objects Sales and Current YTD Sales, will the user receive accurate information if the user places these objects in the same query? The first object, Sales, does not include any time-period constraints. The user therefore adds Month=10 and Year=2005 as conditions in the report. This makes the Current YTD Sales information wrong (it’s now one month of data versus year-to-date) as Web Intelligence appends the WHERE clause to the entire query. Hopefully, users will recognize query results that are blatantly wrong; it’s the not-so-obvious ones that pose a problem. In either case, a perfect universe would include only those objects that can be accurately combined together; a real-world universe accomplishes this most of the time and supplements it with good object descriptions and training! Universe Benefits
Universe Disadvantages
Designers (IT or power users) can implement, so it is flexible
Use of complex business SQL is a unique skill
Server-based, so consistent business definitions, minimal network traffic, and better scalability
Unpredictable response times compared to fact table or OLAP database, as SQL is processed at query run time
Ratios and variances are correct
Individual objects may not be correct when combined with other objects with conflicting definitions
Leverages newer RDBMS analytic functions
Database dependent
User Objects Here is another bias: I prefer to avoid the use of user objects. User objects cannot be shared by other users. Rarely does only one person work with or view a report, so if the intelligence is lacking in the universe, either put it in the universe or put it in the report so that it can be shared.
NOTE User objects are available only in Desktop Intelligence and have not been carried into Web Intelligence.
Chapter 14:
Design Principles: Where to Put the Intelligence
User Object Benefits
User Object Disadvantages
Users can implement, so it is flexible
Use of complex business SQL is a unique skill
Server-based processing minimizes network traffic
Unpredictable response times, as SQL is processed at query run time Objects cannot be shared with other users May require modification to the database.prm file to access certain SQL functions Not centrally maintained, so increases risk of inconsistent business definitions and higher costs Not supported in Web Intelligence
User Reports With robust calculations and formulas, Desktop Intelligence and Web Intelligence offers users the ability to overcome many limitations in SQL. The number of functions in Web Intelligence XI Release 2 is double the number of functions supported in earlier versions of Web Intelligence. Users are familiar with formulas from spreadsheets and are comfortable building some quite powerful ones within the Web Intelligence documents. In some cases, users may have no choice but to create a formula in a report for the following reasons: • It’s an individual reporting need. • The intelligence cannot be built with SQL. • It’s immediate and avoids the politics that accompany other alternatives. If the report really is for individual use and the formula is not a common business one, then the intelligence does indeed belong in a report. However, too often I see report-based calculations that were built there simply because there was little dialogue between the universe designer and end users.
SQL Limitations SQL does have limitations. OLAP database vendors often emphasize their solutions as a way to overcome a number of limitations of SQL (forward calculations, time period
PART II
The one problem that a user object solves and a report formula does not is that of too much data being sent across the network. If a user is using SQL for standard transformations (UPPER, TO_CHAR, and so on), then the same amount of traffic is sent across the network for a user-defined object as for a report formula. However, if a user builds an object that filters the query such as Order Date – Ship Date < 5, then the database server processes the query, generating less network traffic than a report variable that gets processed locally on the client or Enterprise server. When users build objects with SQL functions, it may require a modification to the database.prm file, increasing ownership costs. Another concern about both user objects and report formulas is that the business definition may no longer be consistent. One user’s definition of Current Month Sales may be based on the accounting month the invoice was sent; another may define it with the calendar month, and yet another, the date the product was shipped. The following table summarizes the pros and cons of user objects:
341
342
Part II:
A Better Universe
versus point in time, and so on). However, IBM, Oracle, and Teradata in recent years have provided a number of SQL extensions that make SQL more robust. SQL Server 2005 reportedly will also have more analytic capabilities. Forward calculations such as rankings and percent market share are now possible with SQL. But clearly, not everyone is on the most current database releases and not all intelligence can be solved with SQL; this is where many BI vendors have excelled. BusinessObjects XI in particular contains a number of formula functions that do not have a SQL equivalent. Variance Percentage (VarP), Percentile, and RunningSum are just a few. Long before database vendors added analytic functions to SQL, BusinessObjects offered a percent of sum calculation, as well as Rank and various running aggregate functions. Recall the particular problems that variance and ratio calculations can cause; the calculation order is very important to get the correct answer. With report formulas, users control the calculation order either by specifically inserting a formula at each break level or with Calculation Context Operators (explained in detail in Chapter 22). To use the earlier example of the variance between C_YTD and L_YTD, look how the percent variance is correctly calculated,
even for the break level by product. Desktop Intelligence and Web Intelligence automatically ensure the ratios are correctly calculated at each break level by using an extended syntax in the report formula. Within the individual rows, the full syntax for the ratio in Desktop Intelligence is as follows: =((-)/ ForEach ) In (, , )
At the footer or subtotal level, the syntax is slightly different: =((-)/ ForEach ) In
In some cases, it may be technically feasible to build the intelligence into an object, but the user needs it immediately. IT may maintain the universe and be unable to create a new object quickly enough; the user creates a report formula for time expediency. The user also may want to avoid the politics of having to get common buy-in for a universe modification.
Disadvantages of Intelligence in User Reports Too many report formulas can be problematic over time. First, report variables are stored within a document and therefore are not centrally maintained. As formulas change, there is
Chapter 14:
Design Principles: Where to Put the Intelligence
FIGURE 14-5 Creating a role of report reviewer can help companies minimize the risks of unnecessary and inconsistent report formulas.
PART II
no way to track how many versions of the report have been shared and modified. Multiple versions of the formula will now exist. This problem becomes worse when the original formula creator changes jobs or leaves the company. There once was a statistic about 75 percent of spreadsheets containing errors. I wouldn’t be surprised if report formulas have an equally high number of errors, or at the very least, cause a number of misunderstandings. One of my clients spent hours each month reconciling differences between two inventory reports: they both accessed the same universe in the data warehouse, but each contained different formulas. We eventually standardized on one report that became published and centrally maintained in the repository. Second, report formulas contain a significant amount of intelligence that could, and should, be leveraged across the company. If a company is to ensure business consistency and capture the power of user report variables, you must develop a process to review and maintain formulas. Figure 14-5 shows one possible process. A user creates a standard report that contains a number of formulas (Step 1). A report reviewer, who may be a power user or a universe designer, reviews the report and looks for formulas that are common needs (Step 2). When they fulfill common reporting requirements, the universe designer builds the intelligence into the universe (Step 3A). If it is not a broad reporting requirement but only fulfills the needs of a few users, then the intelligence will remain as a report formula. The report reviewer quality-assures the formula and saves the report to the public folders or corporate categories (Step 3B). Users may balk at this additional level of quality control, and the last thing a company wants to do is add barriers to sharing information. An alternative is to let users freely save documents to the public folders or corporate categories but ensure a report reviewer and/or universe designer checks the shared reports periodically. I have gotten a fair degree
343
344
Part II:
A Better Universe
of pushback from some BusinessObjects Enterprise administrators who wanted Corporate Documents (as the shared area was called in earlier versions) to be tightly controlled. With BusinessObjects full client, users could easily use the LAN file system to otherwise share the reports and may continue to do so in Desktop Intelligence in XI Release 2. In other words, if your deployment approach is an obstacle to sharing reports, users often will find their own ways to do so. When IT facilitates the sharing, though, IT can also provide some degree of control and quality assurance. With Web Intelligence, however, users can share documents only via the repository and not via the file system. My recommendation, then, is to actively facilitate sharing of reports. You may want to structure the categories and folders such that there is one super-controlled area and other areas with less restrictions, but making the whole repository too tightly controlled may make your deployment less successful in the long term. Another major disadvantage of report variables is their effect on response time and system load. Overly complex reports can overload the Enterprise server. Formulas that require detail rows may cause too much data to be sent across the network. Let’s look at the example of Last Year YTD Sales. The following Web Intelligence report formula looks at the Enterprise Server’s CurrentDate to determine which months are less than the current month. If it is less than the current month, then it displays the Amount Sold, else zero. The year must be one year ago.
The report appears as follows (assuming the current date is July 2005). Notice that while there were sales in August, the rows for these months correctly display zeros, as it is greater than the current month.
NOTE For a detailed explanation of these formula functions, refer to Chapter 22.
Chapter 14:
Design Principles: Where to Put the Intelligence
345
Each year goes to a separate column
PART II
Only months > button (labeled 3) to add Sweaters to the right-hand box, Select Product Lines (labeled 4). 6. When you are satisfied with your selections, click Run Query, labeled 5.
Customized Lists of Values
C AUTION The wildcard in the list of values search box is different from the wildcard you would use in the actual query. When using Matches Pattern in a query filter, the wildcard character is %; for example, N% finds all names beginning with N. In the following example, the data source contains a long list of customer cities. In order to work with a manageable list of cities, you must first select a country in which the customer resides. The precise appearance of the prompt dialog depends entirely on how your universe designer built the list of values. If the designer did not cascade the list and set the Hierarchical Display option (see Chapter 10), the prompt dialog and which question to answer first is confusing at best. The following screen shows a correctly designed list of values. The last prompt value the query author used was city of Leeds. The + sign next to each country name
PART III
For particularly long dimension lists such as customers or products, you may be prompted to further narrow the desired list of values. In such a case, the universe designer has customized the list of values query to include a prompt. If the dimension object displays an ID or code, the designer may customize the list of values to display the name or description in the list of values (refer to Chapter 10). For long lists of values, you can search to find a particular value or subset of values. For example, to find Customer Names beginning with N, enter N* in the list of values search box. The asterisk (*) acts as a wildcard for the list of values. Then click the binoculars icon to have the customers beginning with N appear in the list of values. Note in the following image that you can open the drop-down next to the binoculars icon to indicate if the search should be case-sensitive or not.
428
Part III:
Reporting and Analysis
indicates that the list of values for Customer City is cascaded or must first be further filtered by country. You can expand or collapse the list of cities for each country by clicking the + or –.
Prompt messages
Manually enter value here
Cascaded list of values
If you do not want to select from the list, you also can enter your value in the box provided. If the box does not appear, then the query author has set an option to force you to pick your value from the list. 1. Position your mouse on the prompt “Enter Value(s) for Customer City?” If your query contains only one prompt, then this row is highlighted by default. 2. Expand the country that contains your desired city, in this example, United Kingdom. 3. Highlight the city in the list and click >> to add it to the box on the right. 4. Once you have answered all the prompts and made all your filter criteria selections, select Run Query.
NOTE When the list of values is cascaded, the list is not cached, so there may be a delay when you select an individual country before the list of cities within that country appear.
Multiple Prompts Sometimes when you refresh a query, you may need to answer multiple prompts. The report author should ideally sort them in a logical order, for example, the year before the quarter. By default, Web Intelligence displays them in the order in which they have been added to the query. The default prompt message also gives an indication if you can select one value or multiple values. For example, “Enter Reservation Year” indicates you can choose only one year, whereas “Enter value(s) for Reservation Quarter,” means you can select more than one quarter. In the following example, there are three required prompts. A green check mark next to the Reservation Year indicates a value has been selected. A red arrow next to the Quarter and Month prompts indicates that these values have not yet been selected. The Run Query button remains dimmed until all the prompts have been answered.
Chapter 18:
Prompts answered Prompts not answered
Working with Documents
429
Dim until all prompts answered
PART III
Saving Documents One you have refreshed a document, you want to save the document with the new set of data. To save a document to the same place from which you opened the document, click the Save button on the toolbar. To close the document, select the Document | Close menu item or the X in either your browser toolbar or the Workspace panel. If the Save icon does not appear on your main toolbar, you may not have permission to save the original document, particularly if it is stored in a public folder. In this case, use the Document pull-down menu and select Save As to save the document to another folder.
When you save the document to a different location and name, you are making a copy of the file; no link is maintained to the original report file. In the Save As dialog, enter a document title. This will become the name of the file as it appears in the list in InfoView. If you wish, enter a longer description. The description appears when you expand your document properties or display the Encyclopedia. Specify keywords if you wish to provide additional search options for locating documents. Refresh On Open will automatically force a query refresh when you open the document. By checking the box Permanent Regional
430
Part III:
Reporting and Analysis
Formatting, you override users’ personal InfoView locale settings so that formatting for dates and numeric values are stored with the document.
NOTE If you check the box Refresh On Open, there is little point in saving the data with the document, particularly for large result sets with documents that have many pages, as the results are purged upon open. Under Location, the folders in which you can save a document depend on the rights the administrator has granted you. By default, your personal folder, Favorites, is selected. To see the Public Folders, click the + to expand the list of available folders. All folders for which you have view access appear in this list, however, you may not have create or edit rights that allow you to save a report to a public folder. If you do not have sufficient rights to save the document to a public folder, you will receive the following error message:
Save To My Computer As Using Document | Save To My Computer As also allows you to select a different file format, including Excel, PDF, or CSV.
Chapter 18:
Working with Documents
431
Excel When you choose to save a document to Excel format, your browser will prompt you as to whether you want to open the Excel spreadsheet immediately or you want to download the file first.
Comma-Separated Values (CSV) In some cases, you may not want the formatting preserved but just want the raw query results exported to Excel. If so, select Document | Save To My Computer As and either CSV or CSV (With Options). CSV With Options allow you to specify a different delimiter. When you save a document to CSV, all data is exported into one spreadsheet, including those from multiple report tabs.
Scheduling a Document If you have slow-running queries or reports that you wish to refresh on a regular basis, you can schedule them. The scheduling features are available through InfoView and for all BusinessObjects Enterprise document types (Crystal Reports, Web Intelligence Desktop Intelligence). From within your list of documents in InfoView, select Schedule.
NOTE If you do not see the list of actions beneath the document name, click the down arrow to expand the actions.
PART III
To download the file and specify a particular filename and path, select Save. By default, the Excel filename and Web Intelligence document name are the same. Web Intelligence will convert the document to spreadsheet format and, upon completion, will display a message “Download Complete.” Select Open to open the spreadsheet. Note that if your document contained multiple report tabs, these convert to Microsoft Excel worksheets. Formatting is preserved and charts are converted to Excel charts.
432
Part III:
Reporting and Analysis
The Schedule dialog appears as shown in Figure 18-3. By default, the Instance title is the same name as the document title. An instance refers to a version of a scheduled report. The administrator determines how many instances are saved. For example, you may have ten versions of a scheduled report. You can give each of your schedules a unique instance name, a useful feature particularly if you need to keep track of an instance when a report is submitted to regulatory agencies, what the supplier shipping status is as of a point in time, and so on. To schedule the report to run on a recurring basis or at a future point in time, click the drop-down next to Run Object.
Once you have selected any kind of recurrence (weekly, monthly, and so on), the options in Figure 18-3 expand. You can now select which days to refresh the query and how long the schedule is valid for. Changing the start or end date is a bit quirky, as you cannot simply enter the new date in the box displayed. You must click the calendar icon, and then click a
FIGURE 18-3 Use the scheduling capabilities for slow-running reports, or to refresh reports on a regular basis.
Chapter 18:
Working with Documents
433
day in the display. Even if you only want to change the year, you must click a date within the calendar display. Use the single-arrow buttons (>) to navigate forward a month and two arrows (>>) to navigate forward a year. In the following example, the report will refresh every weekday at 8:53 P.M. for a year:
PART III
Under Destination, you have the option of scheduling the output to refresh an instance within Web Intelligence, to send a report to another user’s Inbox within the InfoView folders, or to a user’s e-mail address. If you leave the format as Web Intelligence and the destination as Enterprise Server, then you also can use the Caching Options to preload the document in HTML, Adobe PDF, or Microsoft Excel format. In this way, when you select View Latest Instance or a particular instance, you can very quickly toggle to access the document in either PDF or Excel format, as it has already been converted to these other formats.
NOTE The cache here relates to the archived or scheduled instance. It does not correspond to the last saved version of the document as it may appear in the InfoView folders. Under Prompts, the last prompt values are used by default unless the document properties are set to Refresh on Open. You can override these values for the scheduled report.
E-Mail Recipients To send a scheduled report via e-mail, under Destination, select Email Recipients from the drop-down. You can use the default settings established by the administrator by selecting Use Job Server. The e-mail settings are shown in Figure 18-4.
434
Part III:
Reporting and Analysis
Specify the following settings: • From Enter your e-mail address using the full syntax; for example [email protected]. • To Enter the recipient’s e-mail address. The recipient does not need to be defined to the BusinessObjects Enterprise server.
NOTE There is no drop-down menu of available e-mail addresses. Business Objects technology partner APOS Systems, however, has a product Address Book Gateway that integrates with the Enterprise server to provide this capability. • Subject Here you can enter either static text or dynamic text that is populated according to the document title, refresh time, and BusinessObjects Enterprise login ID. To have the subject line filled in dynamically, select the desired text from the Add Placeholder drop-down. For example, the document title will appear here as specified by the placeholder %SI_NAME%.
FIGURE 18-4 Schedule reports to be distributed via e-mail.
Chapter 18:
Working with Documents
435
• Message This is text to appear in the e-mail notification when the scheduled report is available. As shown in Figure 18-4, the placeholders Title (%SI_NAME%) and Date/Time the report was scheduled (%SI_STARTTIME%) have been inserted into the e-mail. Within the e-mail message, you can insert a hyperlink for the user to click to view the report via InfoView. To do so, select Viewer Hyperlink from the Add Placeholder drop-down that is next to the Message box. When you specify a format such as Adobe Acrobat (PDF) or Excel, then you can send the report as an attachment. If, however, your output format remains the default of Web Intelligence, then the recipient must log in to InfoView to retrieve the report, or if you have inserted the Viewer hyperlink, the recipient can click the hyperlink to go directly to the scheduled report instance. Figure 18-5 shows the e-mail message generated by the Web Intelligence Job Server, according to the schedule settings shown earlier in Figure 18-4.
Events When scheduling a report to refresh, you can also schedule this to be triggered by an event. There are three event types: • When a schedule succeeds or fails • A custom event By scheduling a report to run according to the status of another schedule, in XI Release 2, you can ensure that reports refresh in a particular order. This capability did not exist in the earlier Broadcast Agent.
FIGURE 18-5 Users can schedule reports to be distributed via e-mail.
PART III
• When a file appears
436
Part III:
Reporting and Analysis
Scheduling a report to run upon an event requires two sets of tasks. The first involves an administrator defining an event in the Central Management Console. The second involves choosing the event to trigger and the event to wait for within InfoView.
Create Event To define an event in the CMC as shown in Figure 18-6, follow these steps: 1. Choose Events from the main CMC page. 2. Click the New Events button. 3. In the Type drop-down, select Schedule. 4. Enter a name for the event that includes the name of the document for which you will associate this event; in this example, Sales Query Completed. This name will appear to users in InfoView when scheduling reports based on events.
FIGURE 18-6 Use the CMC to create an event based on a successful query refresh.
Chapter 18:
Working with Documents
437
NOTE If this process seems confusing, it is! Part of the challenge is that the CMC was originally designed as an administrative tool, and yet, report scheduling is a user task. In order to schedule a query as dependent on another query refresh, you must ensure a unique name for the event, one that ideally indicates the name of the document with which it will be used. Without a unique name, the event can be used and triggered by other query completions, a situation that does not produce the desired dependencies. 5. Optionally enter a Description. 6. Under Event Based On, choose Success. 7. Click OK.
Schedule a Refresh Using the Event You want to ensure that a second report runs only when the first one is finished. In scheduling the first report, you must tell it to trigger the event Sales Query Completed, as shown here:
PART III
438
Part III:
Reporting and Analysis
In scheduling the second, dependent report, you must tell it to wait for the event Sales Query Completed.
Viewing Instances and Status Once you have scheduled a document to refresh, you can see the status and history of each schedule. From within the InfoView document list, select History. If you want to delete a particular instance, check the desired box and click the Delete button.
Chapter 18:
Working with Documents
439
PART III
Logging Off After a certain period of inactivity, your InfoView session may time out. For security reasons, though, it is best to log out when you are finished working with BusinessObjects XI. If your InfoView preferences have each document open in a separate browser window, first close these additional windows. Then, from the InfoView Header panel, select Log Off, the yellow padlock button (see Table 17-1 in Chapter 17).
NOTE If your InfoView session times out or if you log out of InfoView before closing your documents, you will receive the following error message from within the document browser:
440
Part III:
Reporting and Analysis
Summary This chapter covered the basics of viewing a document and the document’s components. A Web Intelligence document is much more than a report; it can contain multiple data sources and multiple report blocks to convey information from multiple perspectives. A document is a snapshot of the data. As data is updated, you will need to refresh your document. For reports based on continually changing data, you may wish to schedule your documents to refresh on a periodic basis. The next chapter highlights the more powerful capabilities of interacting within a document to analyze your data.
19
CHAPTER
Analyzing the Data
I
n the last chapter, you viewed, refreshed, and navigated a Web Intelligence document. In this chapter, you interact with a report further to discover new insights. You are not creating a query from scratch, but rather, you are exploring data within an existing report to make it more meaningful. Such an analysis can range from viewing information in a different block style such as tabular or chart, to re-sorting, filtering, and drilling down into the details. This report-based analysis is aimed at report consumers, not just power users. Thus, many of the actions are available via right-mouse clicks. Also, all the analysis discussed in this chapter is available via a zero-footprint browser; you do not have to launch the full-blown Java Report panel. However, while drill mode is supported in both the JSP and ASP versions of Web Intelligence, the HTML Interactive Viewer for on-report sorting and filtering is available only in the JSP version. If your company has not deployed the JSP version, you will have to modify the report to launch the Java Report panel to access some of the features discussed in this chapter.
The HTML Interactive Viewer In order to open a document with the HTML Interactive Viewer, you must set your InfoView Preferences for Web Intelligence as shown in Chapter 17. Figure 19-1 shows the Product Sales Report in the Interactive Viewer. Compare this to the same report shown in Figure 18-1 via the standard HTML viewer. Note that with the Interactive Viewer, you now have an additional toolbar for formatting the report, an Edit button to modify the report or query, an Insert pull-down menu, and additional options in the Document and View pull-down menus. The Left panel in the HTML Interactive Viewer is called the Context panel. It has many more capabilities than the standard HTML viewer shown in Chapter 18, including the ability to see additional objects in the query (but perhaps not displayed in the report) and a data summary that displays a description of each object. The data summary is nothing short of excellent. Finally, report consumers as well as query authors can clearly see the universe object descriptions. If Data Integrator is part of your deployment, then the data summary
441 Copyright © 2006 by The McGraw-Hill Companies. Click here for terms of use.
442
Part III:
Reporting and Analysis
Modify a report or query Report toolbar
FIGURE 19-1 The Interactive Viewer allows you to fine-tune a report and analyze data further.
also displays source information that describes where the data originated, how it was transformed, and when it was last updated. From the Document menu, you now have a Document | Properties option that displays the report author, document description, last modification date, and duration of the query refresh. From the View menu, you have additional options to View Toolbars (Formatting, Report, Formula) as well as formatting and query preferences. Table 19-1 describes the purpose of each button in the Report toolbar.
TIP If you do not see the Report toolbar, select View | Toolbars | Report.
Chapter 19:
Button
Analyzing the Data
Function Remove an entire cell or block, or invoke a drop-down menu to remove a row or column from a tabular block.
Apply Quick Filter
Apply a filter to a dimension or measure within the existing block.
Ascending Sort
Sort the data values in ascending order. To see the sort priorities, right-click the block and select Sort | Properties from the pop-up menu.
Descending Sort
Sort the data values in descending order.
Insert Break
Insert a break to a dimension within the existing block.
Calculations
Insert a sum, count, average, minimum, maximum, percentage to the table or crosstab.
Insert Row or Column
Insert a row or column when you wish to add a new variable or formula to the block.
Duplicate
Duplicate a block when you want to view the same data set in a different style.
Alerters
Apply an alerter to the block. The alert must already be defined within the document. The ability to define an alerter exists only in the Java Report Panel.
TABLE 19-1 Actions Available via the Report Toolbar
Block Types In Chapter 18, the different components of a Web Intelligence report were explained and the concept of a block introduced. A block is a set of data that contains column headings, row headings, and data values. BusinessObjects allows several block types: table, crosstab, form, and chart. A master/detail is a type of report but not specifically a block style. Within a master/ detail report you specify a block style to appear in each section. A report can contain multiple block types. Figure 19-1, for example, has both a crosstab block and a chart block within each section of a master/detail report. Each block can be populated from the same query or a different query. Table 19-2 summarizes the different block types and when to use them.
PART III
Name Remove
443
444
Part III:
Reporting and Analysis
Block Type
Use When . . .
Table
You want to detail information in a list or spreadsheet style. You may break the list into sections in a master/detail report or with breaks. Tables can contain additional columns for many dimensions, details, and measures.
Chart
You want to discover trends and patterns by exploring summary, not detail, numbers in a visual format. Charts are ideal for analyzing a limited number of measures by a limited number of dimensions.
Crosstab
You want to compare measures by different points within a given dimension. A crosstab is a particular kind of table layout that lets you compare actual sales with budget sales, for example, or to compare data from one period to the next.
Form
You want to see many details for a particular product, customer, or record. Instead of viewing a very wide report in which a lot of details are displayed on one row, a form lets you view the details vertically.
TABLE 19-2 Block Types
You can easily convert an existing block to another block style, or you can duplicate a block and then convert it to the new style.
Table When you initially create a new query, Web Intelligence uses the default block type of table. A table is a spreadsheet-style block that lists data in rows and columns. In this example, you will change a chart to a table to further analyze the individual data values. Assume your report displays a horizontal, stacked bar chart. This is a good way to quickly identify that Texas, New York, and California stores have the highest revenues. However, you cannot readily tell from this chart who sold more: New York or California. Nor can you easily see the performance by individual year.
To convert the chart to a tabular block, do the following:
Chapter 19:
Analyzing the Data
445
1. Click on the chart. 2. Right-click to invoke the pop-up menu. Select Turn Chart To.
3. A Turn To dialog appears. Here you can either select a different chart style or, in this example, select Tables.
PART III
4. Within each Type, you will see several thumbnails that indicate a subtype. Select Vertical Table and then click OK to close the Turn To dialog. The horizontal chart now appears as follows, giving a clearer breakdown of the revenue per year. Also, you can more easily see that sales for New York are higher than for California in 2003 but lower for the other years.
446
Part III:
Reporting and Analysis
Crosstab While the vertical table in the preceding section nicely displays the individual data values, comparisons are a challenge. A crosstab is the best block style for quick comparisons and transposes what may originally be rows in a tabular report to column headings. People frequently use crosstabs for the following types of analysis: • Customer sales by year, quarter, or month • Financial measures by actual and budget • Product sales by region To convert a block to a crosstab: 1. Select the block. 2. Right-click to invoke the pop-up menu. Select Turn Table To. 3. From within the Turn To dialog, select Tables, and then select the Crosstab thumbnail. 4. Click OK to close the dialog and see the crosstab. With converting a block to a crosstab, you cannot specify which dimensions appear on top and which appear in each row. Web Intelligence takes its best guess. You can easily swap the row and column headings. For example, to have the years appear across the top and the states appear vertically, follow these steps: 1. Select the existing crosstab block that you wish to convert. 2. Right-click to invoke the pop-up menu. Select Swap Axis. 3. The crosstab now appears as follows:
TIP To create stacked crosstabs and to use drag and drop to determine column and row headings, select Edit to launch the Java Report panel. See Chapter 21 for more advanced capabilities.
Chart Charts are a powerful way to uncover trends and patterns in your data. They can transform a dense page of numbers into a visual that quickly highlights opportunities and problems. Web Intelligence provides numerous chart styles. Advanced charting and formatting are discussed in Chapter 21. Often when you want to chart data, you only need a subset of the data that may appear in a table. In such a situation, I recommend using the Duplicate button to first duplicate the table and then convert it to a chart. 1. Select the tabular block that you wish to graph.
Chapter 19:
Analyzing the Data
447
2. From the Report toolbar, select Duplicate. If you wish the chart to appear to the right of the table, select To The Right. If you want the chart to appear beneath the table or at the end of the report, choose At The End. 3. Modify the duplicated table to remove any extra columns or to further filter the data. 4. Select the duplicated table and right-click to invoke the pop-up menu. Select Turn Table To. 5. From the Turn To dialog, select the desired chart style, then click OK.
Insert a New Report and Block I find the pop-up menus and Turn To the easiest, most intuitive way to view information in different block styles. Alternatively, from within the Interactive Viewer, you can also use the Left panel to insert new blocks or change the style of an existing one. When you insert a new block, you are not creating a new query. Instead, you are displaying data that already exists in the document in a new block style. This is discussed further in Chapter 21.
A master/detail report is a particular kind of report in which a dimension value is used to separate different blocks. Master/detail reports allow you to analyze data within a particular subset. The report in Figure 19-1 is a master/detail report that contains a crosstab and a pie chart for each product line. Accessories is a section header. Compare the layout in Figure 19-1 to the layout of the crosstab in Figure 19-2, in which the product lines (Accessories, City Skirts, etc.) are another column in the crosstab.
Click here to set as section
FIGURE 19-2 This crosstab does not yet contain a section heading for a master/detail report.
PART III
Master/Detail
448
Part III:
Reporting and Analysis
To change an existing column in a report to a section header, click anywhere in that column and then right-click to invoke the pop-up menu. Assuming you have correctly selected a dimension column, the pop-up menu contains an option Set As Section. In this example, the product line existed as a column in the crosstab. However, if it did not exist in the block, you can create a master/detail report by dragging an object onto the report page. 1. Display the Left panel by clicking the arrow to Show Left Pane or selecting View | Left Panel. 2. From the Left Panel drop-down, choose Available Objects. This shows you all objects that may be stored as part of the query results but that are not necessarily displayed in the block. 3. Drag the Lines object from the Left panel to the report. In order to create a section header, you must drop the object in the upper-left corner, just above the table. Pay careful attention to the shape and position of the mouse pointer. Drag and drop
4. When you drop the object onto the report, if you do not get the desired results, click Undo and try again.
NOTE The HTML Interactive Viewer has a multilevel undo, whereas the Java Report panel allows you to undo only the last action.
Chapter 19:
Analyzing the Data
449
Sort Sorting data within a report allows you to rearrange the rows alphabetically, or if your sort is on a measure column, numerically. For example, you can use Sort to find stores with the highest sales. When you want to analyze data within a subset by using Breaks, the breaks take priority over the sorts. In the following example, you will sort revenue in descending order to quickly identify which stores have the highest revenues. 1. Select the column you wish to sort within the table. 2. Web Intelligence highlights the selected column with a gray box. 3. Click Descending Sort from the Report toolbar.
FIGURE 19-3 Data is sorted first by Revenue and then by State.
PART III
When you want to have multiple sorts within a table, use the pop-up menu to set the sort priority. To access the sort priorities, select the table and then right-click. From the popup menu, select Sort | Properties. For example, compare the priorities and results shown in Figures 19-3 and 19-4. In Figure 19-3, the data is sorted first in descending order of Revenue and then by State. In Figure 19-4, it is first sorted by State and then by Revenue. The sort priority in Figure 19-3 will tell you which state had the highest revenues for all years. The second figure will tell you what the highest revenues were for a particular state. The questions sound similar, but the insight provided on a larger set of data is quite different.
450
Part III:
Reporting and Analysis
FIGURE 19-4 Data is sorted first by State and then by Revenue.
Breaks A break will break the table into multiple pieces so that you can better analyze the data within a group. A master/detail report is somewhat similar, except that a break does not create a separate master cell. Also, a break column must exist in the table, whereas a section header in a master/detail report does not have to exist in the table. Finally, breaks give you additional options for keeping tables together for printing. Once you create a break, you then use Calculations to generate subtotals. The first break column becomes the primary sort order. Often, this is the first column in the table, but it does not have to be. Using the same sample table from the preceding section, add a break to the State column: 1. Select the State column. 2. Select Insert Break from the Report toolbar. Web Intelligence will insert the break and by default add the State as a break footer.
CAUTION The Break button on the toolbar acts as a toggle to add or remove breaks. If you inadvertently click this when what you really wanted to do was check the break properties, you will lose all your subtotals and other break settings. Use Undo to restore them and be sure to use the pop-up menu when you want to change Break Properties. Figure 19-5 shows a tabular data set with a break on State and a second break on Year. In the table in Figure 19-5, it is now much easier to see that the data is sorted by state, compared to the data with a sort only in Figure 19-4. For each state, there is now a separate mini-table. Visually, you can now more clearly see the store performance from one quarter to the next.
Chapter 19:
Analyzing the Data
451
Remove duplicate Break header
Break footer
NOTE Although breaks make the data appear as if they are in separate mini-tables, in the strict sense, Web Intelligence still treats the table as one block, an important nuance when formatting the table. In Figure 19-5, the Format | Table options will be the same for both the California and New York mini-tables.
Break Options Figure 19-5 also shows the effects of certain break options, such as break header, break footer, and remove duplicates. To modify these options, right-click the table and from the pop-up menu, select Break | Properties. • Break Header Repeats the column headings within each mini-table. If your table contains more than one break and you enable the Break Header for each break, certain mini-tables will contain multiple rows of column headings. To avoid this, set the Break Header only on the first break (or on the largest grouping for which you want to create a separate minitable).
PART III
FIGURE 19-5 Use Breaks to group the data into what appears as mini-tables.
452
Part III:
Reporting and Analysis
• Break Footer Inserts a separate row beneath each mini-table. The calculation subtotals (not yet inserted) will appear in the break footer. • Remove Duplicates If you want the break value repeated only once in the first row of the mini-table, use this option. As shown in Figure 19-5, the state name California appears only in the first row of the table. Without this option set, California would be repeated in each row of the mini-table. • Center Value Across Break Works with the Remove Duplicates option so that the break value is centered within the rows of the table. (Note: This was not working as expected in SP1.)
NOTE Do not confuse the term break “value” with calculation values that may appear in the row of a break footer. A break value is the value from the dimension—in this example, California, New York, and so on. A calculation value would be the subtotals. Chapter 21 discusses formatting a table to improve the layout when you print a report (see the “Page Layout” section). Breaks have similar options that affect the mini-tables when you print a report: • Start a New Page For each break level, print the mini-table on a new page. This print setting is useful when you intend to distribute each break level to a different person—for example, if you have different product managers and have a break on product. • Avoid Page Breaks in Block Use this option to force Web Intelligence to start the break or mini-table on a new page. For breaks that contain many rows of data, particularly long tables, it may not be possible to avoid a break in the middle of the mini-table. If the grouping of data is longer than a page and not the first grouping of data in the block, a page break will occur before the break and the mini-table will span multiple pages. • Repeat the Header on Every Page For each page break, repeat the column headings. • Repeat Break Value on New Page For mini-tables that span multiple pages, repeat the break value in the first row of each page. If you choose to repeat the header as well, then the row with the break value is repeated beneath the column headings.
Calculations Calculations allow you to add subtotals to a table that contains breaks. If the table does not contain any breaks, then the calculations are grand totals for the entire block. In most instances, if you add a calculation to one measure, you will want them on all measures in a report. The subtotals are inserted as formulas in the break footer. Table 19-3 lists the calculations available via the Report toolbar or Calculation pop-up menu as well as the formula syntax inserted in the break footer. The Calculation dialog box is somewhat context-sensitive, depending on the object type (character, date, number). For example, you may want to count the number of states in which you have stores, but this is not something you would sum or average.
Chapter 19:
Analyzing the Data
Explanation
Formula
Sum
Adds the values for a particular measure. SUM is the default calculation when you first apply a calculation to a variable. However, SUM may not make sense for certain measures such as ratios and percentages.
=SUM([Measure Variable])
Count
Counts the unique values within a break. Use this with dimension or detail objects.
=COUNT([Dimension Variable])
Average
Calculates the average based on the individual measures displayed in the table. If you hide certain rows of data through a filter, the values from the hidden rows do not, by default, affect the subtotal. Average is not a weighted average, so for things like average price, you may want to create a formula to get a weighted average or use extended syntax, as discussed in Chapter 22.
=AVERAGE([Measure Variable])
Minimum
Displays the minimum value for a particular measure within the break.
=MIN([Measure Variable])
Maximum
Displays the maximum value for a particular measure within the break.
=MAX([Measure Variable])
Percentage
Calculates the percentage contribution a particular break level makes to the grand total. In addition, it inserts a new column in the table that shows the percentage each row contributes to the individual break level. This calculation uses the Context Operator ForAll described in Chapter 22.
=PERCENTAGE([Measure Variable]) ForAll ([Dimension Variable])
PART III
Calculation
453
TABLE 19-3 Calculations That Allow You to Create Subtotals
454
Part III:
Reporting and Analysis
When inserting calculations, Web Intelligence automatically adds a grand total to the end of the report. Use the page navigation buttons to scroll to the last page to see the grand totals. The following report shows a sum calculation and percentage calculation in the break footer. Stores in Texas accounted for 27.17 percent of the total revenues ($8,096,124) for this report.
To add Total Revenues to the sample table in the preceding section: 1. Select the Sales Revenue column. 2. Click the Calculation drop-down from the Report toolbar.
3. Select Sum.
TIP Consider formatting the break footer row so that your subtotals stand out. NOTE If you do not have your break options set to include a break footer, the calculations are inserted only as grand totals at the end of the report. Also, if you apply a break after you have inserted calculations, the calculations are not repeated in the break footer and remain as grand totals. To have them appear as subtotals in the break footer, first set the break, then insert the calculations.
Filter As you apply breaks, sorts, and calculations, you may find that you want to focus on one or more subsets within the report. Filters allow you to restrict the number of rows displayed in the report. They do not affect the query results; they affect only the data currently displayed
Chapter 19:
Analyzing the Data
455
in the block. It’s important to understand that the calculations will also change to reflect only what is displayed. In Figure 19-5 shown previously, the table displayed several years of data. To focus only on the year 2003, insert a filter on Year. 1. Position your mouse in the table on the Year column. 2. Select Apply Filter from the Report toolbar or right-click to invoke the pop-up menu and select Quick Filter. 3. Web Intelligence displays a list of values available in the report. Note that this is only a subset of the list of values in the entire database. You can either enter the text to filter on or choose the year from the list. In this example, select 2003 and click >> to add it the box on the right.
Enter filter value Choose filter value
Available operators Filter value
PART III
4. By default, Web Intelligence uses the In List operator to allow you to select multiple values. However, you can use the drop-down to choose Between, Not Null, and so on. Operators are discussed further in Chapter 20. 5. Click OK to see the effect of the filter.
Removing the Filter To remove the filter, you must use the Left panel, Document Structure And Filters. You cannot use the Quick Filter button. For example, assume you want to remove the filter on Year 2003. If you invoke the Quick Filter dialog and simply remove 2003 from the righthand box, Web Intelligence will attempt to filter the years for nulls. 1. Display the Left panel by selecting View | Left Panel, or click the arrow icon. 2. From the Left Panel drop-down, select Document Structure And Filters.
456
Part III:
Reporting and Analysis
3. Here you see the underlying components of each report. The top row gives the name of the document. Immediately beneath this are the prompts or query filters. This is different from report filters that affect the display only. Here we are working with report filters. In this example, there is one report tab called Store Sales. There are two blocks, a table block and a pie block. Note the filter on the Table for Year In List 2003. Move your mouse to this filter until it is highlighted with a red box.
Document title Report tab
Filter
4. Right-click to invoke a pop-up menu and select Remove Filter.
Measure Filters Filters in Web Intelligence XI Release 2 are simpler in many respects from filters in previous versions of the full client. Measure filters used to require defining a formula as did nesting filters. Now, you easily filter on measures by entering a value to compare to. For example, to find which stores have revenues less than 700,000 per quarter, do the following: 1. Select the Revenue column. 2. Click Apply Filter from the Report toolbar or right-click to invoke the pop-up menu and select Quick Filter. 3. Note that a list of values is not available for measures. Enter the value in the lefthand box, in this case 700,000, and then click >>.
Chapter 19:
Analyzing the Data
457
Enter value here
4. Change the operator from the default of Greater than to Less than or Equal to. 5. Click OK to apply the filter and close the dialog.
Report Filters are global filters that apply to all blocks in a report. In the section “Removing the Filter,” you saw that the report Store Sales had both a tabular block and a pie block. Each block contained a separate filter on year for 2003. When you want all existing blocks and new blocks to inherit the same filter, apply them to the report via the Document Structure and Filters panel. Select the component Page Body or the report tab (not the individual block) and rightclick to select Quick Filter. This dialog now contains all the dimensions and measures for this report, as shown in Figure 19-6. Under the column Available Objects, these objects exist in the query but may not necessarily appear in one of your report blocks. 1. Drag the object for which you want to filter from the left panel, Result Objects, to the right, Report Filters. 2. To choose a filter value from a list, click Values. 3. To add a filter on a measure, enter the numeric value and then click Update Filter. 4. Select OK to close the Report Filter dialog.
Nested Filters Nested filters within a report are new in Web Intelligence (see Figure 19-7). Previously, you could create a nested filter in a query but not within a report. You use nested filters when you need to group sets of conditions. For example, you have seen that stores in New York and California have the highest sales. They may be missing revenue targets only when sales are below 700,000 in a given quarter. For smaller stores, though, the revenue target would be much lower, at say 250,000 per quarter. To identify stores that are missing their revenue targets, you want to filter the report for (New York and California with revenue less than 700,000) or (stores in other states with revenue less than 250,000).
PART III
Report Filters
458
Part III:
Reporting and Analysis
FIGURE 19-6 Report Filters apply to all blocks in a report. Double-click to toggle AND/OR
FIGURE 19-7 Filters can be nested.
Add nested filters
Chapter 19:
Analyzing the Data
459
Nesting filters can be rather tricky. First and foremost, you must have a clear understanding of what you want nested and what filters you wanted connected with an AND or OR. 1. To add a nesting or another AND / OR connector, select the block from within the Document Structure And Filters on the left, and then select Filter to call the Filter Editor. If you have selected just an individual column, your dialog will be different from that shown in Figure 19-7. 2. Click the Add Nested Filter button on the right of the Filter dialog. This will insert an AND connector leftmost. 3. Double-click the AND to toggle it to OR. Use drag and drop to reposition the connectors and filters. 4. Click Apply.
Ranking
NOTE Ranking is only available in the Java Report panel; it is not available in the Interactive Viewer. To access the Java Report panel, your default InfoView preferences for Web Intelligence must be set to use the Java Report panel for modifying reports (rather than the Query-HTML or the HTML Report panel . . . not to be confused with the DHMTL Interactive Viewer that you have used so far J). Select Edit from the main toolbar to launch the Java Report panel. When you apply a ranking, you apply it in terms of the measure you are trying to analyze and whether or not the rank should be within breaks on dimensions. The following table gives some business questions that show which measure you would base the ranking on. Business Question
Measure to Rank
Which business units have the highest expense variance?
Expense Variance
What are the top-selling products?
Sales Quantity
Which customers generate the most revenues?
Sales Revenue
Which warehouses have the most product on hand?
Inventory
Which wine producers produce the highest-rated wines?
Rating
A challenge with the Web Intelligence ranking feature is to understand that there are different ways to rank the data. I would argue that the generally accepted approach is to rank according to a percentage of the total. For example, suppose you want the top 10 percent of product sales. Earlier versions of BusinessObjects did not allow this. The ranking calculation mode of Cumulative Percentage is new in Web Intelligence XI Release 2. As shown in Figure 19-8, there are four calculation modes for ranking. The large table on the left shows the total data set for certain product lines in the Efashion universe. The four tables on the right show you the effects of ranking using different calculation modes.
PART III
Whereas filters limit the rows returned in accordance with specific selection criteria, Ranking enables you to limit the rows according to top or bottom values of measures.
460
Part III:
Reporting and Analysis
• Count Allows you to specify a certain number of rows such as the top or bottom ten rows. In Figure 19-8, I have selected the top 3 rows out of 20. • Percentage This percentage is based not on the total revenues, but rather, on the total number of rows. So if you select 10 percent and your original table contains 20 rows, the rank will return two rows as shown in the second table on the right in Figure 19-8. This has been the default behavior in the full client product. • Cumulative Sum This calculation mode looks at the running totals. So if you want to return the first four rows, the Top Cumulative Sum would be 10,000, as the running total through Evening Wear is $9,893,537.
NOTE This ranking calculation mode was not working as expected in SP1. • Cumulative Percentage I would suggest that this last calculation mode is the most useful, as it returns a cumulative percentage. So if you want to know which products account for 80 percent of your revenues, everything from Skirts up would be selected.
FIGURE 19-8 There are multiple ways to rank.
Chapter 19:
Analyzing the Data
461
You can add a ranking to a table or chart: 1. Select the block you wish to rank. 2. Choose Ranking from the Java Report panel toolbar. 3. Web Intelligence displays the Rank dialog. Choose if you want to filter your data on the top-ranked items or bottom. In this example, select Top and enter a value such as 80.
PART III
4. In the Based On drop-down, choose the measure on which you want the ranking based. 5. Choose the Calculation Mode as described earlier. In this example, select Cumulative Percentage. 6. If you are working with a large data set that has multiple break levels, check For Each and indicate the dimension on which to reset the ranking. 7. Click OK to apply the ranking.
NOTE This Ranking function works only on the rows within the local document, so it is a ranking within a subset of data. If you want a genuine ranking based on all the data in the source data, this must be set up at query time, as described in the next section.
Server-Based Ranking Server-based ranking is new in BusinessObjects XI Release 2 and requires that your database support the analytic function RANK. When your database supports this, an Add A Database Ranking button appears on the Query toolbar from within the Java Report panel, Edit Query, as shown in Figure 19-9.
462
Part III:
Reporting and Analysis
Add a Database Ranking
Choose Top or Bottom
Placeholders
FIGURE 19-9 Server-based ranking is performed in the query.
NOTE This button is quite similar to the Add A Subquery button but is different in that it has a star. In the last section, you used the report-based ranking to rank data within a report. The server-based ranking is much more powerful in that you can rank data against the full data set. So you can answer questions such as • Who are my top ten customers by revenue? • What products did my top ten customers buy? • What are my top ten products according to margin? To perform a server-based ranking, follow these steps: 1. From the Java Report panel, select Edit Query. 2. Select Add A Database Ranking from the Query toolbar. 3. This will add a ranking row to the Query Filters section. Use the Top/Bottom toggle to select if you want the Top or Bottom ranking.
Chapter 19:
Analyzing the Data
463
4. By default, the value of Top 10 is selected. You can change the constant of 10 or enter a prompt. 5. Drag the dimension for which you wish to perform the ranking onto the placeholder “Drop a dimension here.” In Figure 19-9, this is Customer Last Name. 6. Drag the measure to base the ranking on to the placeholder “Drop a measure here.” In Figure 19-9, this is Amount Sold. 7. Select Run Query. The SQL generated will use the RANK function in the WHERE clause as follows:
) AS Rk__1
Drill So far in this chapter you added many meaningful breaks, sorts, and calculations. With multidimensional analysis, you look at the same data but from different viewpoints. The viewpoints may be from different dimensions by drilling across or different levels of detail by drilling down. A dimension is a kind of object by which you analyze numeric measures. Dimensions often have different levels or groupings associated with them called hierarchies. Multidimensional analysis is the process of analyzing data by different dimensions and levels within the dimensions. Within Web Intelligence, you can perform multidimensional analysis only with Dimension objects, not with objects the designer has created as Detail objects (see Chapter 9). Hierarchies allow you to analyze data by different levels of detail. Some hierarchies are very clear-cut, such as Time, going from Year to Quarter to Month to Week to Day. There is a natural order. Geography hierarchies may also be predetermined, running from Continent to Country to State. When the geography applies to a marketing region, however, each company introduces its own variation. One company may group the Middle East and Africa together; another company may include Mexico as part of North America because it is part of NAFTA or will group it under a different management region such as Latin America. Many of these groupings are predetermined as part of your company’s reference data and built into the ERP or data warehouse. The universe designer uses the hierarchies to build the default drill paths you use for multidimensional analysis.
PART III
WHERE SH.CUSTOMERS.CUST_LAST_NAME In (SELECT View__1.Column__1 FROM ( SELECT SH.CUSTOMERS.CUST_LAST_NAME AS Column__1, RANK() OVER( ORDER BY sum(SH.SALES.AMOUNT_SOLD) DESC FROM SH.CUSTOMERS, SH.SALES WHERE ( SH.CUSTOMERS.CUST_ID=SH.SALES.CUST_ID ) GROUP BY SH.CUSTOMERS.CUST_LAST_NAME ) View__1 WHERE View__1.Rk__1
Greater than a particular number, date, or character
Greater than or equal to
>=
Greater than or equal to a particular number, date, or character
Less than
Data > Values: • Show data • Show as percentages A scatter plot chart type is helpful in visualizing the correlation between two measures. For example, if you discount products, do you increase your sales volume? As shown next, there are higher discounts on higher quantities sold for sweaters. However, even though overcoats had high discounts, volume sold is still lower than other product lines. This chart also shows some additional properties with data markers (Appearance > Data > Vary Data Markers). The legend is centered across the bottom of the chart (Appearance > Legend > Position=Bottom).
E
PART III
• Show segment labels
530
Part III:
Reporting and Analysis
Chart Page Layout Be sure to check the Properties for the Chart Page Layout, Avoid Page Break In Chart, if your report will have multiple charts and tables. You would think this would be the default, but it’s not! Also, if you add a chart to an existing report that also contains a table, set the relative positioning as described earlier to ensure that as the number of rows in your table expands or increases, the chart placement moves with it.
Page Layout You can view the layout of your report as it will appear in print form by selecting View Page Layout from the Report toolbar. You set a number of layout options via the Properties tab such as the paper size and the report orientation (landscape or portrait). The Page Layout options appear, though, only when you have selected the entire report and not an individual report component (cell, table, or chart).
NOTE You cannot select the entire report when you are in Page Layout view. To modify the Page Layout options, 1. Ensure you are not in Page Layout view. This button acts as a toggle, so if necessary, select View Page Layout from the Report toolbar to toggle back to Draft mode. 2. Then click anywhere on the margin so that a gray box appears around the entire report page (not around an individual block). 3. Select the Properties tab.
4. To change the page orientation from the default Portrait to Landscape, click the row Page Orientation. 5. A drop-down menu will appear on this row. Click the down arrow to set the orientation to Landscape. 6. Change your view back to Page Layout to view the effect.
Chapter 21:
Advanced Report and Chart Formatting
531
NOTE There are inconsistencies in PDF printing from the Java Report panel versus the HTML Interactive Viewer. Unfortunately, the Page Layout options you set here are not transferred to Adobe Reader when you convert your report to PDF for printing from the Java Report panel. You must explicitly choose the paper size and orientation for PDF. However, they are used when you print from within the HTML viewer. The default paper size and orientation are set for all users on the Web Intelligence Server via an XML file. C:\Program Files\Business\Objects\Tomcat\webapps\businessobjects\enterprise115\ desktoplaunch\webiApplet\AppletConfig\defaultConfig.xml
To change the paper size to letter, replace A4 with LETTER: KEY VALUE="page*default">
Special Fields
1. From the Report toolbar, select View Page Layout. 2. Scroll to the Footer area.
TIP To more clearly see what is the Footer or Header area, view the report in Structure mode. 3. From the Report Manager, select the Templates tab and expand the group FreeStanding Cells.
PART III
Web Intelligence allows you to insert special fields for commonly used document information such as document name, last refresh date, and page numbers. You can access additional document information through report formulas. With report formulas, for example, you can create a formula to display either the original document author (DocumentAuthor) or the user logged in to BusinessObjects Enterprise (CurrentUser). Refer to Chapter 22 for additional instructions on report formulas. In the following example, you will add two cells to display a last refresh date and a page number:
532
Part III:
Reporting and Analysis
4. Drag the Template cell “Last Refresh Date” to the bottom-left corner of the footer. Notice that the formula for this cell is =LastExecutionDate()
5. Select the Template cell “Page Number / Total Pages” and drag it to the bottomright corner of the footer. Notice the formula for this cell is as follows: Page()+"/"+NumberOfPages()
6. By default, Web Intelligence uses a thin line on the bottom border of any free-standing cells. You can remove the cell borders by selecting both cells in the Report window (use CTRL-click to select both footer cells), going to the Properties tab, selecting Appearance > Text Format > Borders, and removing the bottom border. Figure 21-14 shows a formatted report with the default footer cells modified to include some additional text such as “Last Refresh Date” and “Page N of N.” You can modify these cells as you would modify any formula. Ensure the Formula toolbar is displayed. Then select the footer cell and modify the formula.
The default formulas in Figure 21-14 have been changed to =”Refresh Date “+LastExecutionDate() =”Page “+Page()+” of “+NumberOfPages()
Company Logo in Report Header You may want to add your corporate logo within the report header. To do so, you insert a blank cell that then points to an image file. Within the Web Intelligence document, the cell format must be set to be read as an image file. The image file must be copied to the Enterprise Server in the following path: C:\Program Files\Business Objects\BusinessObjects Enterprise 11.5\Images
1. Select View Page Layout from the Report toolbar so that a Page Header area appears at the top of your report. 2. From the Report Manager, choose Templates > Free Standing Cells > Formula And Text Cells > Blank Cell. Drag the Blank Cell to the Header portion of the page. 3. Choose the Properties tab. 4. On the General > Text line, enter the name of the logo file, preceded with boimg:// (this is the virtual mapping to the image directory on the Enterprise Server). Alternatively, you can enter this in the formula bar. 5. Under Display > Read Cell Content As, change the default from Text to Image URL.
Chapter 21:
Advanced Report and Chart Formatting
533
Logo
Chart position relative to table
PART III
Default footer cells
FIGURE 21-14
Formatted report in PDF
Formatting Master/Detail Reports Master/detail reports are broken into sections. Formatting a section is not that obvious, as you clearly see the beginning and end of the section only when you are in Structure mode. Further, you see the properties for the section only when you have clicked that gray folder icon that says Section On as shown in Figure 21-15. At the bottom of the report on the right, you also have an End of Section On. As indicated in Properties > Display, the end of the section is 7.39 inches. This is a fairly large section as the result of adding a chart below the table. You would have a smaller minimum height if the chart were to the right, but the width of the table makes this impractical. The important thing is to ensure that your minimum height does not exceed the length of your page and takes into account your headers and footers. When formatting a section, you have the following additional check boxes: • Show when empty is set by default and ensures the section cell appears even if there are no values.
534
Part III:
Reporting and Analysis
Click here
FIGURE 21-15 Use Structure mode to set section properties.
• Hide section when the following are empty has a drop-down menu for each dimension object that acts as a section header. With this box checked, if a particular section level has no corresponding data, all the tables and charts within that section are suppressed. • Bookmark section converts section cells to bookmarks when the report is converted to PDF for printing and offline viewing.
User Settings The Java Report panel user settings allow you to set the measurement in inches or centimeters, optionally display grid lines for positioning report components, and set snapping to grid. Figure 21-15 shows the report with grid lines. Note that these grid lines do not appear in a printed report; they are strictly for aiding in the layout. The User Settings button appears in the upper-right corner of the Java Report panel.
Summary Web Intelligence offers several methods of formatting a document. Use the HTML Interactive Viewer when you wish to make changes to an existing report. Use the Java Report panel when you build a new report, require advanced formatting options such as alerters or custom numbers, or are formatting large documents in which Structure mode is faster.
22
CHAPTER
Formulas and Variables
U
ntil now you have displayed and manipulated objects returned from a data provider that are called base report variables or universe object variables. Formulas provide a powerful way to enhance your reports by transforming columns of data into more meaningful information. There are advantages and disadvantages to using user-defined formulas and variables that are created by the report designer. The key disadvantage to these user-defined formulas is that they are document specific. In other words, they cannot be shared with other users or other documents. You must re-create the formulas in each new document. This process can be error-prone and maintenance intensive. Differences in the way report authors create similar formulas can create multiple versions of the truth. Is it “revenue net of returns” or “revenue without returns”? For these reasons, ensure you work with the universe designer to evaluate if the formula should be a universe object that is then available to all users and documents. However, it is not realistic or even possible for the universe designer to include every conceivable calculation in the universe. Formulas allow you to create one-time and unanticipated calculations that do not exist in the universe. Another advantage to using formulas is that Web Intelligence manipulates local report data using a syntax that can overcome many limitations of SQL. For more discussion on the pros and cons of report variables, see Chapter 14.
Web Intelligence Functions The number of formula functions in Web Intelligence XI Release 2 is roughly double that of previous releases. Table 22-1 provides a comparison of the functions from each of the various interfaces and versions. Use this table to understand when you may have report conversion issues between Desktop Intelligence and Web Intelligence or in evaluating if a report must be built in Desktop Intelligence.
535 Copyright © 2006 by The McGraw-Hill Companies. Click here for terms of use.
536
Part III:
Reporting and Analysis
Function Category
Function
BusinessObjects 6.5
Web Intelligence 6.5
Web Intelligence XI Release 1
Web Intelligence XI Release 2
Aggregate
Average
X
X
X
X
Count
X
X
X
X
CountAll
X
Max
X
X
X
X
Median
X
Min
X
Percentage
Numeric
X X
X
X
X
X
X
Percentile
X
Product
X
X
RunningAverage
X
X
RunningCount
X
X
RunningMax
X
X
RunningMin
X
X
RunningProduct
X
X
RunningSum
X
X
StdDev
X
X
StdDevP
X
X
Sum
X
Var
X
X
X
X X
VarP
X
Abs
X
X
X X
Ceil
X
X
X
Cos
X
X
EuroConvertFrom
X
X
EuroConvertTo
X
X
EuroFromRoundError
X
X
EuroToRoundError
X
X
Exp
X
X
Fact
X
X
X
X
Floor
X
X
X
X
Ln
X
X
X
X
Log
X
X
X
X
Log10
X
Mod
X
X
X
X
Power
X
X
X
X
TABLE 22-1 Comparison of Formula Functions in Various Product Versions
X
Chapter 22:
Function Category
Character
F o r m u l a s a n d Va r i a b l e s
Function
BusinessObjects 6.5
Web Intelligence 6.5
Web Intelligence XI Release 1
Web Intelligence XI Release 2
Rank
X
Round
X
X
X
X
ServerValue
X
Sign
X
X
Sin
X
X
Sqrt
X
Tan
X
ToNumber
X
X
X
X
Truncate
X
X
X
X
Asc
X
X
X
X
X X
X
Char
X
X
Concatenation
X
X
X
FormatDate
X
X
X
X
X
FormatNumber
X
X
X
X
Hyperlink
X
HTMLEncode
X
InitCap
X
Left
X
X
LeftPad
X
LeftTrim
X
X
Length
X
X
Lower
X
Match
X
Pos
X
Replace
X
X
X
X
Right
X
X
X
X
RightPad
X
RightTrim
X
X
X
X
X
X
X
X
X
X X
X
X X
X
X
X
X
X
SubStr
X
X
X
X
Trim
X
X
X
X
Upper
X
URLEncode
X X
X
TABLE 22-1 Comparison of Formula Functions in Various Product Versions (continued)
X
PART III
Fill
WordCap
537
538
Part III:
Reporting and Analysis
Function Category
Function
Date/Time
CurrentDate
X
X
X
X
CurrentTime
X
X
X
X
DayName
X
X
X
X
DayNumberOfMonth
X
X
X
X
DayNumberOfWeek
X
X
X
X
Logical
Document
BusinessObjects 6.5
Web Intelligence 6.5
Web Intelligence XI Release 1
Web Intelligence XI Release 2
DayNumberOfYear
X
X
X
X
DaysBetween
X
X
X
X
LastDayOfMonth
X
X
LastDayOfWeek
X
X
Month
X
X
X
X
MonthNumberOfYear
X
X
X
X
MonthsBetween
X
X
X
X
Quarter
X
X
X
X
RelativeDate
X
X
X
X
ToDate
X
X
X
X
Week
X
X
X
X
Year
X
X
X
X
Even
X
IsDate
X
X
X
X
X
IsError
X
X
X
X
IsLogical
X
IsNull
X
X
X
X
IsNumber
X
X
X
X
IsString
X
X
X
X
IsTime
X
X
X
X
Odd
X
BlockNumber
X
X
X
DocumentAuthor
X
X
X
X
DocumentDate
X
X
X
X
DocumentName
X
X
X
X
DocumentPartially Refreshed
X
X
X
X
DocumentTime
X
X
X
X
DrillFilters
X
X
TABLE 22-1 Comparison of Formula Functions in Various Product Versions (continued)
X
Chapter 22:
Function Category
Data Provider
BusinessObjects 6.5
GlobalFilters
X
LastPrintDate
X
PageInSection
X
SectionNumber
X
Connection
X
DataProvider
X
DataProviderSQL
X
Web Intelligence 6.5
Web Intelligence XI Release 1
Web Intelligence XI Release 2
X
X X
X
X X
DataProviderType
X
LastExecutionDate
X
X
X
X
LastExecutionTime
X
X
X
X
NumberOfDataProviders
X
X
NumberOfRows
X
X
OlapQueryDescription
X
SourceName
X
UniverseName
X
UserResponse
X
Application Value
X
ColumnNumber
X
CurrentUser
X
X X
X
X
X X
GetContentLocale
X X
GetLocale GetProfileNumber
X
GetProfileString
X
If
X
X
X
X
LineNumber
X
MultiCube
X
NameOf
X
NoFilter
X
X
NumberOfPages
X
X
X
X
X
Page
X
X
Previous
X
X
RowIndex
X
UniqueNameOf
539
X X
TABLE 22-1 Comparison of Formula Functions in Various Product Versions (continued)
PART III
Miscellaneous
Function
F o r m u l a s a n d Va r i a b l e s
540
Part III:
Reporting and Analysis
Types of Formulas A formula may contain any combination of universe object variables, user-defined report variables, functions, operators, calculation contexts, and numeric and string constants. Formulas can vary in complexity from basic calculations—formulas containing only universe object variables, basic operators and constants—to very advanced formulas using complex combinations of if-then-else logic, Boolean logic, other user-defined variables, and built-in functions that Web Intelligence provides. Formulas can perform calculations on any type of data, including numeric, string, date, time, and Boolean. Table 22-2 provides some samples of each type of formula.
Syntax Differences Between Web Intelligence and Desktop Intelligence The samples shown in Table 22-2 and most of this chapter concentrate on creating formulas in Web Intelligence. If you are a long-time BusinessObjects developer or will also author reports in Desktop Intelligence, it is important to note three major syntax differences between the Formula Editors in Desktop Intelligence and Web Intelligence: • Universe object variables and user-defined variables referenced in a formula are enclosed in square brackets [] in Web Intelligence but are enclosed by brackets in Desktop Intelligence. For example, the formula =[Revenue] * 1.10 would be used in Web Intelligence, but it would need to be created as = * 1.10 in Desktop Intelligence.
Type
Formula
Purpose
Numeric
=[Revenue]*1.10
Increases revenue by 10 percent
String
=[City] + ", " + [State]
Concatenates City and State separated by a comma into a single string
String
=Concatenation("Dear "; [Name])
Creates the salutation string that could be used for a form letter
Date
=ToDate("01/01/2005"; "MM/dd/yyyy") + 30
Converts a date string to a date data type and adds 30 days
Time
=LastExecutionTime()
The last time the report data was refreshed
Boolean
=[Revenue] < 100000
Will display true if revenue is less than $100,000 and false if revenue is greater than or equal to $100,000
String
=If([Revenue] 50000
=
Greater than or equal to
= [Revenue] >= 50000
$100 to the Expensive group. 8. Click OK to close the New Variable dialog and Close to close the Variables dialog. 9. Insert an additional column in your report with the new grouping variable, Price Category.
TIP For groups that are based on values from measures, consider creating a variable that uses ifthen-else statements and ranges to provide more flexible definitions.
Publishing to the Repository When you work with Desktop Intelligence documents, you routinely save your work to your local computer. If you want other people to access the document and refresh it, then you need to save it to the repository. This allows report consumers to view reports via InfoView and to schedule them.
Chapter 24:
Desktop Intelligence
635
To save your report to the BusinessObjects Enterprise repository, 1. Select File | Export To Repository. 2. Desktop Intelligence presents you with the Export dialog as shown in Figure 24-10. Choose the folder to export the document to. If this is a document that only you will access, choose Favorites. If you want others in your work group to access it, choose a Public Folder. For more information on Folders and Categories, refer to Chapter 17. 3. If your users navigate documents by categories, assign them by clicking the Categories button. 4. Click OK to begin the export process. Desktop Intelligence will confirm when the export to the repository is complete with a message “Export Successful.” Click OK to acknowledge the message. To schedule a Desktop Intelligence document to refresh on a periodic basis, you use InfoView. The steps to schedule a Desktop Intelligence report are the same as the steps for a Web Intelligence report. Refer to Chapter 18 for more information.
PART III
FIGURE 24-10 Export documents to the repository for users to access in InfoView.
636
Part III:
Reporting and Analysis
Summary Desktop Intelligence allows power users to author reports on the desktop, whereas Web Intelligence provides a Web-based authoring environment. Both types of reports can be accessed via InfoView. However, only Web Intelligence allows users Web-based drill, analysis, and report formatting. Desktop Intelligence has certain capabilities such as additional data provider types, disconnected analysis, templates, and custom hierarchies that are not available in Web Intelligence. Before developing a report, consider the intended target audience and their requirements.
Bibliography BusinessObjects Enterprise XI Release 2 Auditor’s Guide. Business Objects, 2005. “BusinessObjects XI Keeps the Information Buzzing at Burt’s Bees” (Business Objects Press Release). August 23, 2005. Chang, Dr. Daniel T. “CWM Enablement Showcase: Warehouse Metadata Interchange Made Easy Using CWM.” TDWI What Works, Volume 11. Eckerson, Wayne. “Analytic Applications: Build or Buy.” TDWI Business Intelligence Strategies Program, November 2002. Eckerson, Wayne, and Cindi Howson. “Enterprise Business Intelligence: Strategies and Technologies for Deploying BI on an Enterprise Scale.” TDWI Report Series, July 2005. Groff, James. SQL: The Complete Reference. McGraw-Hill/Osborne, 2002. Hope, Jeremy. Reinventing the CFO. Harvard Business School Press, 2006. Howson, Cindi. “Marketing the BI Application.” TDWI, August 2005. Loney, Kevin. Oracle 9i: The Complete Reference. McGraw-Hill/Osborne, 2002. McKnight, William. “How to Justify a Data Warehouse Using ROI.” TDWI, February 2003. Meta Integration (www.metaintegration.net). Mishra, Sanjay. Mastering Oracle SQL. O’Reilly, April 2002. Morris, Henry, et al. “The Financial Impact of Business Analytics, an IDC ROI Study.” December 2002.
637 Copyright © 2006 by The McGraw-Hill Companies. Click here for terms of use.
638
Bibliography
Object Management Group (www.omg.com). Pense, Nigel. The OLAP Survey 5 (www.survey.com/olap). Powell, Thomas. HTML: The Complete Reference. McGraw-Hill/Osborne, 2001. Schauer, Val. “Business Objects.” DM Review, January 2003. Stoller, Don. “Turning Your Business Intelligence Investment into a Profit Center.” TDWI Business Intelligence Strategies Program, November 2002. Vesset, Dan. “Trends in the Market for Business Intelligence Software.” DM Review, August 2001. Watson, Hugh, et al. “Current Practices in Data Warehousing.” Wu, Jonathon. “Measuring the Value of Your Business Intelligence and Data Warehousing Initiatives.” Knightsbridge Solutions, April 2004. Zurich North America (www.zurichna.com).
Index References to figures and illustrations are in italics. formulas within, 524–525 textual, 523–524 @Select function, 229–230 aliases, 171 @Variable function, 243 vs. contexts, 168 @Where function, 230, 243–244 detecting, 171–173 A inserting manually, Abs function, 577 174–175 access levels, 295–297 renaming, 173 granting access to and self-joins, 175–177 universes, 307–309 in SQL, 174–175 setting on a universe treated like tables, 99 object, 310 See also joins See also authorization; analysis, 14–15 security analytic applications, 16 Acta, 20 ANSI 92, 153 administrators, 47 setting universe Adobe PDF files, saving parameters for, 153–154 documentation as, 376 Application Foundation, 19 aggregate functions, 551–557 architects, 47 aggregate tables, 244–246 Asc function, 557 adding aggregate auditing awareness to measure prebuilt reports, 386–389 objects, 247–250 user activity, 384–389 creating aggregate fact Auditor, 19 tables, 246–247 authentication, 283, 288 identifying dimension adding users, 290–291 tables irrelevant to defining groups, 293–294 aggregate tables, 247 enterprise, 288–290 specifying which objects external authentication aren’t compatible with, with Windows NT, 250–252 292–293 testing and viewing SQL setting restrictions, statements, 252–255 288–290 aggregates Supervisors, 304–307 cumulative, 587–588 See also security projection, 204 authorization, 283 SQL, 203 access levels, 295–297 alerters, 521 checking rights, 302–304 Alerter Display dialog, 524 folders and categories, Alerter Editor, 525 297–301 creating, 522–523 granting access to universes, 307–309
Symbols
Supervisors, 304–307 understanding your company’s organization, 294–295 See also security Average function, 552
B backups, and universes, 105 base objects, and the @Select function, 229–230 benchmark reports, 380–384 benefits defined, 50 vs. features, 55 of products, 54 benefits of BI solutions, 31–32 BI. See business intelligence BIAR files, 355 multiple CMSs and, 355–360 bibliography, 637–638 blocks chart, 446–447 crosstab, 446, 447 inserting a new block, 447 table, 444–445 types, 443–447 Blue Cross Blue Shield of Kansas City, 29, 59 BOMain.key, 64 bottlenecks, performance, 381–384 breaks, 450–451 options, 451–452 brown-bag lunches, 59–60 Burt’s Bees, 55 Business Explorer, 332 business goals, 27–30 business intelligence analysis, 14–15 analytic applications, 16
639 Copyright © 2006 by The McGraw-Hill Companies. Click here for terms of use.
640
BusinessObjects XI: The Complete Reference
background of, 3–5 dashboards, 16–17 data integration, 10–13 data mining, 17–18 and data warehouses, 8–9 deciding where to put, 346 defined, 329–330 development of, 6–8 influence of the Internet on, 9–10 market segments, 10–18 in OLAP databases, 331–335 places for, 330–331 query and reporting, 13–14 in relational tables, 336–338 scorecards, 16–17 standardization, 30–31 in universes, 338–340 use of, 4 in user objects, 340–341 in user reports, 341–345 Business Intelligence Application Resource (BIAR) files. See BIAR files Business Intelligence Center of Excellence (BICE), 55 Business Objects future of, 21 history of, 19–20 products, 19–20 BusinessObjects Analytics, 19 BusinessObjects XI, expert, 46 BusinessObjects XI expert, architecture, 11 BusinessQuery for Excel, 19 BW Info Cubes, 332
C Cache Servers, 66 calculation contexts, and extended syntax, 582–586 calculations, 452–454 canceling queries, 424–425 cardinality, 149–150 CASE function, 263–266 categories, 297–301 in InfoView, 396 Ceil function, 577
Central Management Console (CMC), 66, 67, 284 accessing, 285 navigating, 286 Central Management Server (CMS), 64, 65 multiple CMSs and BRIAR files, 355–360 CFOs, 25 Char function, 557 character functions, 557–564 charts, 446–447 adding to a report, 525–526 formatting, 525–530 page layout, 530 properties, 526–529 chasm traps, and contexts, 166–168 Check User Rights feature, 302–303 See also authorization; groups checklists migration planning, 68–69 quality assurance, 377–380 Cingular Wireless, 59 classes, 99, 179 defined, 98 hidden, 190 naming conventions, 185–187 working with, 187–188 CMC. See Central Management Console (CMC) CMS. See Central Management Server (CMS) Codd, E.F., 15 ColumnNumber function, 571 comma-separated values, 431 Common Warehouse Metamodel (CWM), 367 communication specialists, 47 concatenated objects, 261 concatenation formulas, 587 Concatenation function, 558 condition objects, 234–238 with subqueries, 238 time conditions, 238–239 conditional operators, 548 Connection function, 569–570
Connection Server, 65 context operators, 549 Context panel, 441 contexts, 103, 155–156 vs. aliases, 168 calculation contexts, 582–586 and chasm traps, 166–168 defined, 99 how they are used, 161–162 input, 583 inserting new contexts, 156–159 and isolated joins, 160–161 modifying, 159–160 output, 583 processing on the RDBMS, 163–165 using context operators in input contexts, 585–586 using dimensions in input and output contexts, 583–585 using keywords in input and output contexts, 586 Cos function, 577–578 costs cost savings/revenue improvement, 33 data warehouse implementations, 25–26 COUNT function, 266–268 Count function, 552–553 crosstabs, 446, 447 displaying object names, 511 formatting, 510–512 merging column titles, 512 Crystal Business Views, compared to universes, 105–106 Crystal Decisions, 13–14, 19, 20 Crystal Enterprise, 19, 20 Crystal Reports, 10 user group, 54 CSV, 431 cumulative aggregates, 587–588
Index
DECODE function, 263 default hierarchies, 276 derived tables, 99, 256–258 derived universes, 347–349 importing kernel universes D into derived universes, Dashboard Manager, 17, 18, 20 352–353 user group, 54 See also linked universes dashboards, 16–17 Designer, 103–105 My InfoView, 412–415 adding summary data dictionaries, 116 information, 115–116 data experts, 46–47 cost estimates warning, 125 data integration, 10–13 database options, 138–139 Data Integrator, 12–13, 20 Editing toolbar, 110, 113–114 data literacy, 40 folders and domains, Data Manager, 479 109–110 data mining, 17–18 graphic options used in the data providers structure pane, 145 linking, 594–595 join graphics, 143–146 multiple, 594–598 launching, 107–108 synchronizing, 595–598, limiting execution time, 124 618–620 limiting size of long text types of, 615–617 objects, 125 data warehouses, 8–9 limiting size of result set, 124 compared to transactions links, 129 systems, 9 naming and describing the reasons for not building, universe, 114–115 25–26 opening a universe, 108–109 The Data Warehousing Institute. parameters, 130–131 See TDWI survey Quick Design Wizard, database administrators 139–141 (DBAs), 47 showing row count, 146 database credentials, 132–133 SQL queries, 125–129 DataProvider functions, 569–571 Standard toolbar, 110, DataProviderSQL function, 570 112–113 date and time functions, 564–568 strategies, 116–124 DayName function, 565 toolbars, 110–114 DayNumberOfMonth universe connections, function, 565 131–138 DayNumberOfWeek Universe Parameters dialog function, 565 box, 114–131 DayNumberOfYear function, 565 workspace, 110 DaysBetween function, 565–566 designers, multiple, 365–366 DBAs. See database Desktop Intelligence, 19, 20 administrators (DBAs) applying templates, 630 debugging performance, 381–384 combining personal data deciders, 43–44 files with corporate data, decision support systems 617–618 (DSSs), 4–5 compared to Web Intelligence, 613 CurrentDate function, 564 CurrentTime function, 564 CurrentUser function, 571 CWM, 367
creating variables in, 588–590 default footers, 628–629 default headers, 627–628 hiding tables, 625–626 hierarchical display of the list of values, 223–225 and HTML links, 260 online mode vs. offline mode, 612–614 publishing to the repository, 634–635 query on query, 620–623 reasons for using, 611–612 saving as templates, 629–630 standard report styles, 627, 630–631 syntax compared to Web Intelligence, 540–541 templates, 627 user reports, 341–345 user-defined groups, 632–634 user-defined hierarchies, 631–632 detail objects, 183 modifying details or attributes, 200 dimension objects, 181 modifying, 190–196 dimension tables, 99, 100 identifying dimension tables irrelevant to aggregate tables, 247 dimensions, 463 hierarchies, 273–274 discussions, initiating, 472–473 document functions, 568–569 documentation, on universes, 373–376 DocumentAuthor function, 568 DocumentDate function, 568 DocumentName function, 568–569 DocumentPartiallyRefreshed function, 569 documents canceling, 424–425
641
642
BusinessObjects XI: The Complete Reference
creating a document in the Java Report panel, 478–479 opening, 417–418 printing, 418 refreshing, 423–424, 494–495 saving, 429–431 scheduling, 431–439 searching, 419–420 structure, 420–421 view modes, 418 DocumentTime function, 569 DOLAP, 15 Dow Chemical, 29 DrillFilters function, 569 drilling data, 463–464 drill across, 469 drill by, 468–469 drill down, 467–468 drill options, 471–472 drill through to data, 470–472 drill up, 468 how data is aggregated, 465–466 snapshots, 469 synchronized drilling, 471 understanding the data, 464–465 DSSs. See decision support systems (DSSs) dynamic OLAP. See DOLAP
equi-joins, changing to outer joins, 150–151 ERPs. See enterprise resource planning systems (ERPs) EuroConvertFrom function, 578 EuroConvertTo function, 579 EuroFromRoundError function, 579 EuroToRoundError function, 579 Even function, 575 events, to trigger a refresh, 435–438 Everyone group, 297, 298 changing access for, 299–301 Excel, 332 executive information systems (EISs), 4, 5 Exp function, 579 external data, storing, 29
F
Fact function, 579–580 fact tables, 99 creating aggregate fact tables, 246–247 fan traps, and many-to-many joins, 168 features vs. benefits, 55 defined, 50 of products, 54 file-based repository, 63–64 E EISs. See executive information Fill function, 558 filters, 454–455 systems (EISs) measure filters, 456–457 e-mail, sending scheduled nested filters, 457–459 documents via e-mail, 433–435 removing, 455–456 Emergency Medical Associates report filters, 457, 458 (EMA), 29, 34 See also query filters enterprise customers, 21 finance, goals, 28 enterprise information FirstLogic, 20 management, 21 Floor function, 580 enterprise performance folders, 297–301 management, 21 in InfoView, 396 enterprise resource planning foreign keys, 197 systems (ERPs), 6–8 specifying, 198–199 compared to data FormatDate function, 558–559 warehouses, 9
FormatNumber function, 559–560 formatting alerters, 521–525 alternating row colors, 521 cells, 499–503 charts, 525–530 column headings, 513 column height, 514–515 company logos in report headers, 532–533 crosstabs, 510–512 data values, 515–517 Display properties, 518–519 Formatting toolbar, 497–499 in the Java Report panel, 504–512 long column names, 513–514 master/detail reports, 533–534 objects, 204–205 Page Layout properties, 519–521 tabular, 513–517 what and how to format, 499 wrapping text, 514–515 Formula Editor, 541–543, 543–545, 551 formula toolbar, 543 formulas concatenation, 587 creating, 541–545 cumulative aggregates, 587–588 If-Then-Else, 586–587 operators, 548–550 saving as variables, 545–548 types of, 540 Year-to-Date measures, 587 functions Abs, 577 aggregate, 551–557 Asc, 557 Average, 552 Ceil, 577
Index
Char, 557 character, 557–564 ColumnNumber, 571 comparison of in various versions of Web Intelligence, 535–539 Concatenation, 558 Connection, 569–570 Cos, 577–578 Count, 552–553 CurrentDate, 564 CurrentTime, 564 CurrentUser, 571 DataProvider, 569–571 DataProviderSQL, 570 date and time, 564–568 DayName, 565 DayNumberOfMonth, 565 DayNumberOfWeek, 565 DayNumberOfYear, 565 DaysBetween, 565–566 document, 568–569 DocumentAuthor, 568 DocumentDate, 568 DocumentName, 568–569 DocumentPartiallyRefreshed, 569 DocumentTime, 569 DrillFilters, 569 EuroConvertFrom, 578 EuroConvertTo, 579 EuroFromRoundError, 579 EuroToRoundError, 579 Even, 575 Exp, 579 Fact, 579–580 Fill, 558 Floor, 580 FormatDate, 558–559 FormatNumber, 559–560 GetContentLocale, 571–572 GetLocale, 572 HTMLEncode, 561 If, 572 InitCap, 561 IsDate, 575 IsError, 576 IsLogical, 576 IsNull, 576 IsNumber, 576
IsString, 576–577 IsTime, 577 LastDayofMonth, 566 LastDayofWeek, 566 LastExecutionDate, 570 LastExecutionTime, 570 LastPrintDate, 569 Left, 561 LeftPad, 561 LeftTrim, 561 Length, 561–562 LineNumber, 572 Ln, 580 Log, 580 logical, 575–577 Lower, 562 Match, 562 Max, 553 Median, 553 Min, 553 Mod, 580 Month, 566 MonthNumberOfYear, 566 MonthsBetween, 567 NameOf, 572 NoFilter, 573 NumberofDataProviders, 570 NumberofPages, 573 NumberofRows, 571 numeric, 577–582 Odd, 577 Pages, 574 Percentage, 553–554 Percentile, 554 Pos, 562 Power, 580 Previous, 574 Quarter, 567 Rank, 581 RelativeDate, 567 Replace, 562 ReportFilter, 569 Right, 563 RightPad, 563 RightTrim, 563 Round, 581 RowIndex, 574 RunningAverage, 554 RunningCount, 554 RunningMax, 555
RunningMin, 555 RunningProduct, 555 RunningSum, 556 Sign, 581 Sin, 581 Sqrt, 581–582 StdDev, 556 StdDevP, 556 SubStr, 563 Sum, 556–557 Tan, 582 ToDate, 567–568 ToNumber, 582 Trim, 563 Truncate, 582 UniqueNameOf, 574–575 UniverseName, 571 Upper, 564 URLEncode, 564 UserResponse, 571 using in formulas, 550 Var, 557 VarP, 557 Week, 568 WordCap, 564 Year, 568 function-specific operators, 550
G gatekeepers, 41–42 geographic hierarchies, 274 GetContentLocale function, 571–572 GetLocale function, 572 goals aligning universes with business goals, 95–96 business, 27–30 of deploying BusinessObjects, 23 IT, 24–26 groups, 297 checking rights, 302–304 defining, 293–294 designating a Supervisor for, 304–305 Everyone, 297, 298, 299–301 user-defined groups, 632–634 See also authorization
643
644
BusinessObjects XI: The Complete Reference
General preferences, 404–407 Header panel, 396, 398 logging into, 393–395 logging off, 439 My InfoView dashboard, 412–415 Navigation panel, 396–400 OLAP Intelligence options, 410 organizing documents, 402–403 passwords, 394–395 shortcuts, 403–404 user group, 54 Web Intelligence options, 408–410 Workspace panel, 396, 400 InfoView Portal, 19 InitCap function, 561 input contexts, 583 keywords, 586 using context operators in, 585–586 using dimensions in, 583–585 Input File Repository Server, 65 integrating metadata, 367–368 integrity, checking universe integrity, 369–373 I intelligence If function, 572 deciding where to put, 346 If-Then-Else statements, defined, 329–330 263–266, 586–587 in OLAP databases, Import Wizard, 67, 76, 79–85, 331–335 354–360 places for, 330–331 industry journals, 59 previous sources of, 4 influencers, 42–43 in relational tables, information consumers, 46 336–338 InfoView, 60, 397 in universes, 338–340 accessing, 393 in user objects, 340–341 accessing documents, in user reports, 341–345 400–401 authentication source, 394 See also business categories, 396 intelligence Crystal Report options, 411 Intelligent Question, 20 Desktop Intelligence user group, 54 options, 407 interactive objects, 239–243 folders, 396 reusing with @Variable, 243
H
HAVING clause, 599 hiding tables, 625–626 hierarchies, 273–274, 463 custom, 276–278 default, 276 geographic, 274 time, 274–276 user-defined hierarchies, 631–632 See also drilling data HOLAP, 15 Honeycomb, 55 Hope, Jeremy, 25 HTML Interactive Viewer, 441–443 comparison to formatting in Java Report panel, 505 Formatting toolbar, 497–499 HTML links, 258–260 HTML Report panel, 476–477, 478 Formula Editor, 543–545 HTMLEncode function, 561 human resources, goals, 28 hybrid OLAP. See HOLAP
reusing with @Where, 243–244 INTERSECT operator, 603–604 intranet, 60 Inventory Workbench, 55 IsDate function, 575 IsError function, 576 IsLogical function, 576 IsNull function, 576 IsNumber function, 576 IsString function, 576–577 IsTime function, 577 IT goals, 24–26
J Java Report panel, 476, 478 adding or removing reports, 506–507 comparison to formatting in HTML Interactive Viewer, 505 creating a new document with, 478–479 formatting crosstabs, 510–512 formatting in, 504–512 Formula Editor, 541–543 formula toolbar, 543 inserting new tables, 507–510 navigating properties within the Report Manager, 507 query panel, 479–482 Structure mode, 512–525 user settings, 534 Job Servers, 65 joins, 102 basic, 146–150 cardinalities, 149–150 chasm traps, 166–168 composite keys and complex joins, 168–170 contexts, 155–168 defined, 99 fan traps and many-tomany joins, 168 forcing, 176–177 graphics, 143–146
Index
loops, 154–155, 165–166 outer, 150–152 self-joins and aliases, 175–177 shortcut joins, 177 and strategies, 117 See also aliases
K kernels, 347 importing kernel universes into derived universes, 352–353 keys, 196–199 keywords, in input and output contexts, 586
L Lands’ End, 55 LastDayofMonth function, 566 LastDayofWeek function, 566 LastExecutionDate function, 570 LastExecutionTime function, 570 LastPrintDate function, 569 Left function, 561 LeftPad function, 561 LeftTrim function, 561 Length function, 561–562 Liautaud, Bernard, 19 licensing, 135 LineNumber function, 572 linked universes, 347–349 adding links, 350–352 how linking works, 350 object sort order, 353–354 removing links, 353 what gets linked, 349 linking data providers, 594–595 list of values, 207, 426–427 adding a description object to an ID object, 213–217 adding more information to the .lov query file, 215–216 associating, 214–215 cascading, 217–222 customization, 212–225 customized, 427–428 details, 212
hierarchical display in Desktop Intelligence, 223–225 hierarchical display in Web Intelligence, 222–223 how it works, 207–210 incorporating personal data files, 226–228 nonindexed fields, 212 purging data from, 216–217 reusable, 225–226 settings, 210–211 when to disable LOVs, 211–212 Live Office, 19, 29 user group, 54 Ln function, 580 locking, 365–366 Log function, 580 logical functions, 575–577 logical operators, 549 logon, restrictions, 290 logos, in report headers, 532–533 loops, 154–155, 165–166 LOVs. See list of values Lower function, 562
M ManagerO, 377 marketing, goals, 28 marketing mix place, 56, 57 price, 55–56 product, 53–55 promotion, 56–60 marketing plans customizing per segment, 61–62 elements of, 50 when to develop, 49–50 marketing specialists, 47 master/detail reports, 447–448 formatting, 533–534 Match function, 562 mathematical operators, 548 Max function, 553 measure conditions, 599 measure filters, 456–457 measure objects, 181–182
adding aggregate awareness, 247–250 aggregates, 203–204 inserting a measure, 201–204 measures of success, 31–35 Median function, 553 metadata integration, 367–368 Metadata Manager, 367 microcube architecture, 29 migration assessing technical architecture readiness, 74 attaining steady state, 78 backing up prior version’s reports, 75 benefits, 69 communication and implementation plan, 74 consolidation tasks, 77 copying or backing prior version’s repository, 75 developing an approach and a new architecture, 71–74 documentation, 70, 77 executive sponsorship, 69–70 freezing updates to old environment, 78 going live, 78 identifying pilot users and content, 74–75 implementation phase, 78 Import Wizard, 67, 76, 79–85 managing different administrators, 70 manual tasks, 77 planning, 69–75 planning checklist, 68–69 planning groups and folders, 75 ramping up and redesigning, 78–79 Report Conversion tool, 67, 85–89 report rationalization and conversion to Web Intelligence, 71 sample reports for benchmarking/testing, 74, 76
645
646
BusinessObjects XI: The Complete Reference
security, 71, 76 taking inventory of existing environment, 70 taking inventory of shared reports, 71 testing the new environment, 75–77 training, 78 training administrators, 70 training strategy, 74 Min function, 553 MINUS operator, 603–604 Mod function, 580 MOLAP, 15 monitoring user activity, 384–389 Month function, 566 MonthNumberOfYear function, 566 MonthsBetween function, 567 MS Analysis Services, 332 multidimensional analysis, defined, 273–274 multidimensional OLAP. See MOLAP multipass queries, 591–593 multiple data providers, 594–598
N NameOf function, 572 naming conventions, 185–187 Navigation Map, 419–420 nested conditions, 600–603 nested filters, 457–459 Net Present Value (NPV), 34 net restrictions, 326 newsletters, 59 NoFilter function, 573 normalized schemas, 101 NPV. See Net Present Value (NPV) NumberofDataProviders function, 570 NumberofPages function, 573 NumberofRows function, 571 numeric functions, 577–582
O OASIS, 55 object restrictions, 312–313 applying, 314–317 creating, 313–314 object-level security, 309–312 object.lov files, 207–209 See also list of values objects, 99, 179 @Select function, 229–230 concatenated objects, 261 condition objects, 234–239 cutting and pasting objects and object IDs, 187 defined, 98 deleting, 189–190 detail objects, 183 dimension objects, 181 formats, 204–205 hidden, 190 inserting a measure, 201–204 interactive objects, 239–244 keys, 196–199 measure objects, 181–182, 247–250 modifying a dimension, 190–196 modifying details or attributes, 200 naming conventions, 185–187 ordering, 183–185 with prompts, 239–244 renaming, 188–189 setting an object equal to another object, 609 and strategies, 117 time objects, 261–263 types, 180, 192–193 user-defined objects (UDOs), 624, 625 working with, 187–188 Odd function, 577 OLAP, 14–15 OLAP-aware queries, 495–496 See also DOLAP; HOLAP; MOLAP; ROLAP
OLAP databases as independent applications, 332–333 putting intelligence into, 331–335 OLAP survey, 31–32 OLAP universes, 278–281 Online Analytical Processing. See OLAP operands, 488 OR, 600–603 operators, 487 conditional, 548 context, 549 function-specific, 550 logical, 549 mathematical, 548 UNION, INTERSECT, and MINUS, 603–604 using in formulas, 548–550 Where, 549 optimized processes, 65–67 Oracle Hints, 243 outer joins, 150–152 See also joins output contexts, 583 keywords, 586 using dimensions in, 583–585 Output File Repository Server, 65 Owens and Minor, 33, 55, 56, 59
P page layout charts, 530 reports, 530–533 Pages function, 574 parameters, 98 restrictions, 317–318 passwords allowing Supervisors to set, 306–307 InfoView, 394–395 restrictions, 290 PDF files, saving documentation as, 376 Pendse, Nigel, 31 Percentage function, 553–554
Index
Percentile function, 554 performance bottlenecks, 381–384 Performance Management Applications, 20 Performance Manager, user group, 54 personal data files, and lists of values, 226–228 pilot users, 46 place, 56, 57 podcasts, 59 portal. See InfoView Pos function, 562 Power function, 580 prebuilt reports, auditing, 386–389 predefined conditions, 489 previewing net restrictions, 326 Previous function, 574 price, 55–56 primary keys, 197 specifying, 198–199 printing documents, 418 universe documentation, 373–375 PRM file, SQL parameters and, 231–233 ProClarity, 332 product, 53–55 program managers, 45 project managers, 45 project roles, 44–47 projection aggregates, 204 promotion, 56–57 brown-bag lunches, 59–60 industry journals, 59 internal user conferences, 60 intranet, 60 key messages, 58 media, 58–60 newsletters, 59 podcasts, 59 pseudo optional prompts, 242–243 road shows, 59 staff meetings, 60 training classes, 59 T-shirt days, 60
adding to a table or chart, 461 server-based, 461–463 Rapid Marts, 20 real-time access, 26 refreshing queries, 423–424, 425–427 customized lists of values, 427–428 multiple prompts, 428–429 Q on open, 494–495 quality assurance checklist, triggered by an event, 377–380 435–438 Quarter function, 567 Reinventing the CFO, 25 queries relational OLAP. See ROLAP building step by step, 482 relational tables, putting canceling, 424–425 intelligence into, 336–338 combined, 603–606 RelativeDate function, 567 formulating a business remapping tables, 323–324 question, 475–476 Replace function, 562 multipass, 591–593 report authors, 46 OLAP-aware, 495–496 Report Conversion tool, 67, 85–89 operands, 488 report filters, 457, 458 operators, 487 Report Servers, 65 query on query, 620–623 ReportFilter function, 569 refreshing, 423–424, 425–427, reporting, directly against a 494–495 transaction system, 25–26 setting an object equal to reports another object, 609 blocks, 422–423 subqueries, 606–609 bookmarks, 422 query and reporting, 13–14 cells, 423 query filters, 479, 484–485 company logos in report adding, 485–486 headers, 532–533 complex, 599–606 navigating to, 421 on dates, 488–489 page layout, 530–533 nested conditions, 600–603 sections, 422 OR operand, 600–603 variables, 423 predefined conditions, 489 repository, 29 See also filters file-based, 63–64 query panels, 476–482 publishing to, 634–635 Data Manager, 479 restriction priorities, 324–326 Query Properties, 492–494 result objects, 479, 482–483 Query-HTML panel, 476, scope of analysis, 483–484 477, 478 return on investment (ROI) Quick Design Wizard, 139–141 formula for calculating, 34 as a measure of success, R 34–35 RANK function, 269–270 revision numbers, 366 Rank function, 581 Right function, 563 ranking, 459–460 RightPad function, 563
videos, 59 when to promote, 57 prompts, 239–242, 490–491 creating, 492 multiple, 428–429 in objects vs. reports, 244 properties, 491–492 publishing to the repository, 634–635
647
648
BusinessObjects XI: The Complete Reference
net restrictions, 326 object restrictions, 312–317 object-level, 309–312 in prior versions, 286–288 restriction priorities, 324–326 row restrictions, 318–322 Supervisors, 304–307 table mappings, 322–324 terminology, 287 and universe connections, 134 universe parameter restrictions, 317–318 See also Central Management Console (CMC) security administrators, 45 segmentation of user base, 37 by amount of travel, 40–41 by computer literacy level, 37–38 customizing marketing per segment, 61–62 S by degree of analytic job sales, goals, 28 content, 39 saving documents, 429–430 by ERP or source system with comma-separated use, 39 values (CSV), 431 by implementation in Excel format, 431 phase, 41 Save To My Computer internal vs. external As, 430 users, 41 scheduling documents, by job function, 38–39 431–433 by job level, 38 sending scheduled by level of data literacy, 40 documents via e-mail, by level of spreadsheet 433–435 usage, 40 triggered by an event, primary vs. secondary 435–438 users, 38 viewing instances and when to analyze status, 438–439 segments, 44 Schwarz, John, 19 self-joins, and aliases, 175–177 scope of analysis, 483–484 server-based ranking, 461–463 scorecards, 16–17 See also ranking security, 284 sharing analyses, 472–473 authentication, 283, shortcut joins, 177 288–294 shortcuts, in InfoView, 403–404 authorization, 283, 294–304 Sign function, 581 centralized vs. Simon and Schuster, 29 decentralized, 304 Sin function, 581 rights checking, 302–304 granting access to universes, 307–309 See also authorization; groups RightTrim function, 563 Risk Intelligence, 55 road shows, 59 ROI. See return on investment (ROI) ROLAP, 15 roles, 44–47 Round function, 581 row count, 146 row restrictions, 318–322 RowIndex function, 574 RunningAverage function, 554 RunningCount function, 554 RunningMax function, 555 RunningMin function, 555 RunningProduct function, 555 RunningSum function, 556
situation analysis, 50–53 See also SWOT analyses SMB, 21 snapshots, 469 See also drilling data snowflake schemas, 99, 101 sorting data, 449–450 source information, 199 special fields, 531–532 sponsors, 45 sponsorship, lack of, 25 spreadsheet integration, 40 SQL concatenated objects, 261 If-Then-Else logic with CASE, 263–266 ratio to report, 270–271 time objects, 261–263 SQL 92, 153 SQL aggregates, 203 SQL Editor, 230, 231 SQL functions, 230–231 CASE, 263–266 COUNT, 266–268 DECODE, 263 help text for, 232–233 multiple arguments and prompt messages, 234 RANK, 269–270 SQL parameters, and the PRM file, 231–233 SQL statements, testing and viewing, 252–255 Sqrt function, 581–582 SRC Software, 20 staff meetings, 60 standardization, BI, 30–31 star schemas, 99, 101 StdDev function, 556 StdDevP function, 556 Stoller, Don, 33 strategies database options, 123 defined, 116 editing the external strategy file, 119–123 external, 118 and joins, 117 and objects, 117
Index
referencing the external strategy file, 118–119 Strategies tab, 116–118 and tables, 117 Structure mode, 512–525 subqueries, 606–609 See also queries; query filters SubStr function, 563 success, measuring, 31–35 Sum function, 556–557 Supervisor, 304 allowing Supervisors to add users, 305–307 designating, 304–305 supply chain, goals, 28 SWOT analyses, 51 for a mature but stalled deployment, 53 for a new implementation, 52 See also situation analysis synchronized drilling, 471 See also drilling data synchronizing data providers, 595–598, 618–620
T table blocks, 444–445 table mappings, 322–324 tables, 99–102 aliases treated like, 99 derived, 99, 256–258 dimension, 99, 100 fact tables, 99, 246–247 hiding, 625–626 relational, 336–338 and strategies, 117 tabular formatting, 513–517 Tan function, 582 TDWI survey, 31, 34 templates, 627 applying, 630 saving as, 629–630 terminology, 287 test folders, 360–362 documents in test/ production folders, 362–364 time functions, 564–568 time hierarchies, 274–276 time limit interruptions, 425
compared to Crystal Business Views, 105–106 contexts, 99, 103 defined, 93 derived, 347–349 development, test, and production universes, 354–364 documentation, 373–376 documenting changes to, 97–98 evolving, 96–98 and existing data warehouses, 95 granting access to, 307–309 integrity, 369–373 joins, 99, 102 U keeping it simple, 93–94 UDOs, 624, 625 linked, 347–352, 353 UNION operator, 603–604 and new data UniqueNameOf function, warehouses, 95 574–575 OLAP, 278–281 universe connections, 131–132 opening in Designer, 108–109 advanced connection parameter restrictions, parameters, 135–136 317–318 asynchronous connections, parameters, 98 136–137 permanently importing creating, 137–138 components, 352–353 custom connection putting intelligence into, parameters, 137 338–340 database credentials, revision numbers, 366 132–133 secure, 132 granting access to, shared, 132 308–309 storage during login parameters, development, 103 132–135 storage for deployment, personal, 132 103–105 shared login, 133–134 tables, 99–102 which connection to use, tech issues, 94–95 134–135 Upper function, 564 universe designers, 45–46 URLEncode function, 564 universe pane, 179–180 usage tracking, 135 UniverseName function, 571 use cases, 381 universes user conferences, 60 aligning with business goals, user groups, and BusinessObjects 95–96 product modules, 54 and backups, 105 user IDs based on transaction allowing Supervisors to systems, 96 create, 305–307 classes and objects, 98–99 restrictions, 290 time objects, 261–263 timing, and implementing BusinessObjects directly against the OLTP, 25 T-Mobile, 29 ToDate function, 567–568 ToNumber function, 582 trainers, 47 training approaches to, 60–61 classes, 59 transaction systems, compared to data warehouses, 9 Trim function, 563 Truncate function, 582 T-shirt days, 60
649
650
BusinessObjects XI: The Complete Reference
user objects, putting intelligence into, 340–341 user reports, putting intelligence into, 341–345 user-defined groups, 632–634 user-defined hierarchies, 631–632 user-defined objects (UDOs), 624, 625 UserResponse function, 571 users adding, 290–291 allowing Supervisors to add, 305–307 monitoring user activity, 384–389
V Var function, 557 variables converting existing formulas to, 546–547 creating, 545–546 creating in Desktop Intelligence, 588–590
types of formulas, 540 user group, 54 user reports, 341–345 what and how to format, 499 Week function, 568 Wells, Dave, 58 Where operator, 549 W wildcards, 487 Web Analysis, 332 Windows NT, external Web Intelligence, 19, 20 authentication with, 292–293 compared to Desktop WISDOM, 55, 56 Intelligence, 613 WordCap function, 564 comparison of functions in Wu, Jonathan, 35 various versions, 535–539 Y Formatting toolbar, 498 Year function, 568 hierarchical display of the Year-to-Date measures, 587 list of values, 222–223 Z special fields, 531–532 Zurich North America, 55 syntax compared to Desktop Intelligence, 540–541
deleting, 548 duplicating, 548 editing, 547 VarP function, 557 videos, 59 view modes, 418 views, vs. row restrictions, 322