
- Author / Uploaded
- Bruce L. Gardner
- Gordon C. Rausser
Handbook of Agricultural Economics. Volume 1A: Agricultural Production. Handbooks in Economics 18
INTRODUCTION TO THE SERIES The aim of the Handbooks in Economics series is to produce Handbooks for various branches o
2,330 552 12MB
Pages 789 Page size 446.25 x 675 pts Year 2009
Recommend Papers


File loading please wait...
Citation preview
INTRODUCTION
TO THE SERIES
The aim of the Handbooks in Economics series is to produce Handbooks for various branches of economics, each of which is a definitive source, reference, and teaching supplement for use by professional researchers and advanced graduate students. Each Handbook provides self-contained surveys of the current state of a branch of economics in the form of chapters prepared by leading specialists on various aspects of this branch of economics. These surveys summarize not only received results but also newer developments, from recent journal articles and discussion papers. Some original material is also included, but the main goal is to provide comprehensive and accessible surveys. The Handbooks are intended to provide not only useful reference volumes for professional collections but also possible supplementary readings for advanced courses for graduate students in economics. KENNETH J. ARROW and MICHAEL D. INTRILIGATOR
PUBLISHER' S NOTE For a complete overview of the Handbooks in Economics Series, please refer to the listing on the last two pages of this volume.
CONTENTS OF THE HANDBOOK
VOLUME 1A PART 1 - AGRICULTURAL
PRODUCTION
Chapter 1 Production and Supply YAIR MUNDLAK
Chapter 2 Uncertainty, Risk Aversion, and Risk Management for Agricultural Producers GIANCARLO MOSCHINI and DAVID A. HENNESSY
Chapter 3 Expectations, Information and Dynamics MARC NERLOVE and DAVID A. BESSLER
Chapter 4 The Agricultural Innovation Process: Research and Technology Adoption in a Changing Agricultural Sector DAVID SUNDING and DAVID ZILBERMAN
Chapter 5 Structural Change in Agricultural Production: Economics, Technology and Policy JEAN-PAUL CHAVAS
Chapter 6 Land Institutions and Land Markets KLAUS DEININGER and GERSHON FEDER
Chapter 7 Human Capital: Education and Agriculture WALLACE E. HUFFMAN
Chapter 8 Women's Roles in the Agricultural Household: Bargaining and Human Capital Investments T. PAUL SCHULTZ
Chapter 9 Human Capital: Migration and Rural Population Change J. EDWARD TAYLOR and PHILIP L. MARTIN
Chapter 10 Agricultural Finance: Credit, Credit Constraints, and Consequences PETER J. BARRY and LINDON J. ROBISON vii
viii
Chapter 11 Economic Impacts of Agricultural Research and Extension ROBERT E. EVENSON Chapter 12 The Agricultural Producer: Theory and Statistical Measurement RICHARD E. JUST and RULON D. POPE
V O L U M E 1B PART 2 - M A R K E T I N G , D I S T R I B U T I O N A N D C O N S U M E R S
Chapter 13 Commodity Futures and Options JEFFREY C. WILLIAMS Chapter 14 Storage and Price Stabilization BRIAN WRIGHT Chapter 15 Food Processing and Disacibution: An Industrial Organization Approach RICHARD J. SEXTON and NATHALIE LAVOIE Chapter 16 Marketing Margins: Empirical Analysis MICHAEL K. WOHLGENANT Chapter 17 Spatial Price Analysis PAUL L. FACKLER and BARRY K. GOODWIN Chapter 18 Duality for the Household: Theory and Applications JEFFREY T. LaFRANCE Chapter 19 Economic Analysis of Food Safety JOHN M. ANTLE Chapter 20 Marketing and Distribution: Theory and Statistical Measurement JAMES VERCAMMEN and ANDREW SCHMITZ Chapter 21 Production and Marketing RACHAEL E. GOODHUE and GORDON C. RAUSSER
Contents of the Handbook
INTRODUCTION
The subject matter of agricultural economics has both broadened and deepened in recent years, and the chapters of this Handbook present the most exciting and innovative work being done today. The field originated early in the twentieth century with a focus on farm management and commodity markets, but has since moved far into analysis of issues in food, resources, international trade, and linkages between agriculture and the rest of the economy. In the process agricultural economists have been pioneering users of developments in economic theory and econometrics. Moreover, in the process of intense focus on problems of economic science that are central to agriculture - market expectations, behavior under uncertainty, multimarket relationships for both products and factors, the economics of research and technology adoption, and public goods and property issues associated with issues like nonpoint pollution and innovations in biotechnology - agricultural economists have developed methods of empirical investigation that have been taken up in other fields. The chapters are organized into five parts, contained in two volumes. Volume 1 contains Part 1, "Agricultural Production", and Part 2, "Marketing, Distribution and Consumers". These two parts include much of the traditional scope of agricultural economics, emphasizing advances in both theory and empirical application of recent years. Volume 2 consists of three parts: "Agriculture, Natural Resources and the Environment", "Agriculture in the Macroeconomy", and "Agricultural and Food Policy". Although agricultural economists have always paid attention to these topics, research devoted to them has increased substantially in scope as well as depth in recent years. A large-scale effort to review and assess the state of knowledge in agricultural economics was previously undertaken by the American Agricultural Economics Association (AAEA), with publication in four volumes from 1977 to 1992.1 Those earlier survey volumes have strikingly different subject-matter content from that of the present Handbook, especially considering that they described the same field only 20 years ago. The AAEA volumes have extensive coverage of farm management issues, costs of production in agriculture, and estimates of efficiency of marketing firms. In our judgment little in any fundamental way has been added to our knowledge in these areas, and applications have become routine rather than imaginative research. The largest AAEA volume was devoted entirely to agriculture in economic development. This remains a
1 A Survey of Economics Literature, Lee Martin, ed., Minneapolis: University of Minnesota Press. Volume 1, Traditional Field of Agricultural Economics(1977); Volume2, QuantitativeMethods in Agricultural Economics (1977); Volume 3, Economics of Welfare, Rural Development,and Natural Resources (1981); Volume4, Agriculture in EconomicDevelopment(1992).
ix
x
Introduction
most important topic, but we cover it in only one complete chapter and parts of several others. This reflects in part the integration of work on developing countries with mainstream applied work. For example, our chapters on production economics, expectations, and risk management also encompass applications to agriculture in developing economies. That integration points to another gradual but notable change in agricultural economists' research. The AAEA surveys had most of the chapters of one volume devoted to quantitative methods. We do not have any separate methodological chapters. In contrast, we have several chapters with substantial development of economic theory. This reflects an evolution in the research priorities of leading agricultural economists who, following the earlier work of Nerlove on supply and Griliches on technological change, are working at the theoretical frontiers and simultaneously undertaking empirical work - not just purveying new theories to their more "applied" colleagues. As its title indicates, the AAEA volumes were surveys of literature, and aimed at completeness of coverage within their subject matter. We asked our authors to be selective, to focus on what they saw as the main contributions to the area they covered, and to assess the state of knowledge and what remains to be learned. This approach has left some gaps in our coverage, and has given us some chapters that are perhaps more idiosyncratic than is usual for a survey chapter. In order to pull things together at a higher level of aggregation, we commissioned five "synthesis" chapters, one for each of the five parts of the Handbook. And, to provide our own even broader overview, the editors have written closing syntheses of each volume. Because these syntheses provide capsule summaries of each Handbook chapter, we will not present further description of content here. Although advances in research in agricultural economics are increasingly being made in many countries, our authors and coverage of applied topics is heavily U.S.-weighted (only six authors work outside of the U.S.: two in Europe, two in Australia, one in Canada, and one in Israel). Of those in the U.S., however, six are economists at the World Bank, an international rather than American institution. Probably in another twenty years or so one will have to become more international to capture the most interesting and exciting developments in the field, but that day has not arrived yet. Among the many debts we have accrued in the preparation of this Handbook, the most important was Rachael Goodhue. She not only assessed the substance of many chapters, but she persuaded many reviewers and authors alike to complete their assigned responsibilities. Other critical contributors include the dedicated staff who provided support at the University of California, Berkeley, and at the University of Maryland. At Maryland, Liesl Koch served as copy editor and guided the authors' final revisions and preparation of the manuscript with sure judgment and a finn but diplomatic hand, a job best likened to driving a herd of cats. Coordination of correspondence with authors and reviewers was organized and carried out at Berkeley with exemplary efficiency and organizational skill by Jef Samp, Jessica Berkson, and Jennifer Michael, under the direction of Nancy Lewis.
Introduction
xi
We also want to recognize the comments and suggestions received from 45 reviewers of chapter drafts: Julian Alston, Jock Anderson, Richard Barichello, Eran Beinenbaum, Michael Boehlje, Dan Bromley, Steve Buccola, Allan Buckwell, David Bullock, Michael Caputo, Jean-Paul Chavas, John Connor, Klaus Deiniuger, Jeffrey Doffman, Marcel Fafchamps, Gershon Feder, Joe Glauber, Dan Gilligan, Rachael Goodhue, Tom Grennes, Zvi Griliches, Geoff Heal, Eithan Hochman, Matt Holt, Wallace Huffman, D. Gale Johnson, Zvi Lerman, Erik Lichtenberg, Ethan Ligon, Alan Love, Jill McCluskey, Mario Miranda, Arie Oskam, Dick Perrin, Mark Rosegrant, Vern Ruttan, Ed Schuh, Kathleen Segerson, Larry Sjaastad, Spiro Stefanou, Jo Swinnen, Frans van der Zee, Finis Welch, Abner Womack, and Jacob Yaron. BRUCE GARDNER GORDON RAUSSER
Chapter 1
PRODUCTION
AND SUPPLY
YAIR MUNDLAK
Faculty of Agriculture, The Hebrew University of Jerusalem, Rehovot, Israel
Contents
Abstract 1. Primal estimates or the Cobb-Douglas culture 1.1. The setting of the agenda 1.2. A simple production model 1.3. Productivity 1.4. The productivity of capital 1.5. Productivity and heterogeneous technology 1.6. Heterogeneous technology 1.7. Cross-country studies 1.8. The rate of technical change 1.9. Primal estimates - summary
2. The duality culture 2.1. Studies based on cost functions 2.2. What is the message? 2.3. Studies based on profit functions 2.4. Dual estimates - summary
3. Multiproduct production 4. Nonparametric methods 4.1. Description 4.2. Discussion
5. Supply analysis 5.1. Background 5.2. Static analysis
6. Dynamics 6.1. The firm's problem 6.2. Discussion 6.3. The role of prices and technology 6.4. Disinvestment 6.5. Empirical investment analysis 6.6. Exogenous dynamics
Handbook of Agricultural Economics, Volume 1, Edited by B. Gardner and G. Rausser © 2001 Elsevier Science B.V. All rights reserved
4 5 5 9
12 16 16 18 20 26 27 28 32 35 36 39 40 43 43 45 47 47 49 51 51 53 53 55 56 57
Y Mundlak
6.7. Endogenousdynamics- the primal approach 6.8. Endogenousdynamics-the dual approach 6.9. Empiricalinvestmentanalysis in agriculture 6.10. Dynamicfactor demandusing duality 6.11. Discussion 7. The scope for policy evaluation 7.1. Summaryand conclusions Acknowledgement References
58 59 61 63 68 71 73 77 77
Abstract The work of more than 50 years aimed at gaining empirical insight into the production structure of agriculture and the related modes of farmers' behavior is reviewed, and orders of magnitude of the various parameters of interest are quoted. The review follows the lines of the evolution of the pertinent research, and it builds on it in forming a general framework for empirical work. This approach broadens the scope of producers' decisions to include the choice of the implemented technology and it also overcomes statistical problems that have accompanied the relevant research for a long time. JEL classification: Q11
Ch. 1: Productionand Supply
5
Technology along with the competitive conditions constitute the core of the supply side of the economy. There is hardly a subject in economics that can be discussed with production sitting in the balcony rather than playing center stage. To mention the main favorable subjects in agricultural economics research: product supply, factor demand, technical change, income distribution, the relationships between factor prices and product prices, the competitive position of agriculture, returns to scale, the size distribution of firms, and capital accumulation. The nature of the relationships and the conclusions derived in any particular analysis depend on the order of magnitude of the parameters in question. Hence, whether we want it or not, the empirical analysis of technology and its changes is of cardinal importance, and measurement problems are pertinent even if on the surface it seems that the subject matter is not 'technical'. In this review, we deal with the various aspects of the analysis. As will become clear, much of the discussion in the literature is methodology driven, not always accompanied by substantive applications. Inasmuch as methodological innovations are desirable, the question is how do they help us to think of, or deal with, specific issues of interest. This is a question that the reader should try to answer for himself, depending on his particular interest. To assist in this endeavor, we summarize here the empirical findings that bear on the main parameters of interest and address some important methodological issues essential to the interpretation of empirical studies and to future research. In many cases, the empirical results display a wide range and thus highlight the need for an appropriate framework for their evaluation. The choice of subjects and the coverage in the discussion are carried out with the purpose of constructing a uniform framework to meet the purpose. This is built on the cumulative experience and contributions provided by numerous studies and on the evolution of the thinking that is so valuable in the reading and the interpretation of the data. To emphasize this aspect, the subjects are introduced largely in an Order that highlights this evolution. There are two fairly distinct periods in the study of agricultural production functions: before and after duality. The changing of the guard was in the early 1970s, although a few studies employing direct estimation continue to appear after 1970. The appearance of duality changed not only the method of estimation but also the questions asked to the extent that there is little continuity in the subjects of interest. This can be accounted for by the fact that much of the work is methodology-driven rather than being an indication that the old questions had been adequately answered or of any explicit agenda.
1. Primal estimates or the Cobb-Douglas culture 1.1. The setting of the agenda
It seems that the empirical work on agricultural production functions originated in a methodological paper by Tintner (1944) and an application by Tintner and Brownlee (1944), which appeared as a short paper in the Notes section of the Journal of Farm
6
E Mundlak
E c o n o m i c s and was followed by a full size paper by Heady (1946). This work was
influenced by the work of Cobb and Douglas (1928). 1 It thus took about fifteen years to adopt the work of Cobb and Douglas in agricultural economics application. These studies used data from a random sample of Iowa farms for 1939. The data were classified by area of the state, type, and also size of farm. The inputs included were land, labor, equipment, livestock and feed, and miscellaneous operating expense, a classification that is still applicable today. Interestingly, this early work anticipated some of the more difficult subjects in the empirical work of production functions. Management was recognized as an input, but "[t]he productive agent management has been excluded since there is no satisfactory index of inputs for this factor" [Tintner and Brownlee (1944, p. 566)]. Allusions were also made to the importance of input quality. 2 Heady (1946) expressed similar concerns about the quality issue and the omission of management. 3 Also, based on the criticism of the Cobb--Douglas work that appeared at that time by Reder (1943 ), Bronfenbrenner (1944), and Marschak and Andrews (1944), Heady (1946) noted that "It]he functions which have been derived ... are of the interfirm rather than intrafarm variety ... it can he expected that a multitude of functions exists ... because of the varying combinations of techniques employed and commodities produced" (p. 999). This is a recognition of the problems caused by aggregation over techniques. Similarly, Smith (1945) observed that firms in cross section may employ different techniques, particularly due to fixed plants inherited from the past, and the long-run production functions so derived may represent "mongrels" or hybrids. Aside from the question of input quality, Bronfenbrenner (i 944) raised the point that capital and labor are not on the same footing because labor is a flow ("quantity used"), whereas capital is a stock (representing the "available quantity"). This can be interpreted as an early recognition of the conceptual problem of the evaluation of the productivity of durable inputs. These studies were concerned with the contribution of inputs to output variations and with a comparison of the factor productivity on different farm types and the relationship to their returns. The estimated production elasticities reported by Tintner and Brownlee (1944) for the sample as a whole are: land, 0.34; labor, 0.24; and other assets and variable inputs, 0.41. The sum is 0.99. Heady used a larger sample and a somewhat different classification of inputs to obtain for the sample as a whole: land, 0.23; labor, 0.03; and other assets and variable inputs, 0.59. The sum is 0.85. 1 A regression equation linear in the logarithms "[is] similar to the production function employedby Paul Douglas in his empirical studies" [Tintnerand Brownlee (1944, p. 567)]. On the history of the Cobb-Douglas production function, see [Douglas(1976)]. 2 "Usingthe number of acres in the farms as a measure of inputs of land ignores variations in the quality of land. Measuring inputs of labor in terms of months of labor also ignores variations in the quality and intensity of labor, particularly that of operator and his family" [Tintner and Brownlee (1944, p. 566)]. 3 At the time the issue of management bias was unrecognized, therefore both papers speculated that had management been included, the sum of the elasticities, as a measure of returns to scale, would have increased [Tintuer and Brownlee (1944, p. 569), Heady (1946, p. 995)]. However,Heady also indicates that the sum of the elasticities might have decreased due to the introduction of management (Ibid,, p. 997).
Ch. 1: Production and Supply
7
Several points are of interest. First, these studies were prompted by a methodological innovation introduced by Cobb and Douglas (1928). Yet, their orientation is applicative in nature, and they address substantive issues related to the efficient use of inputs. Second, sampling from the same data source yields different elasticities. The sum of the elasticities of labor and land vary between 0.58 and 0.25 in the two studies respectively. This difference suggests sensitivity of the estimates to output composition and perhaps differences in the physical environment. Third, the sum of the elasticities is smaller than 1. The approach formulated by the foregoing studies served as a framework for the production function estimation for more than two decades, where attention was focused on the following issues: the contribution of the various factors to the explanation of output variations in the cross section or over time, the production elasticities and their significance, the robustness of the estimates, the role of economies of scale, as judged by the sum of the elasticities, the importance of the quality of inputs, the treatment of management and its relations to the properties of the estimates, the functional forms, and the role of technical change. The data base of these studies varied from observations on individual farms to cross-country comparisons. The question of efficient use of inputs is the objective of many studies. 4 Lack of robustness of empirical results was raised by Hildebrand (1960) who found that annual cross-section regressions are not robust and any hypothesis can be supported by some results. Lack of robustness is also evident in some other studies that present more than one set of results. Heady and Dillon (1961, Chapter 17) review and summarize 32 studies in various countries based on farm data. The mean elasticities and their coefficient of variation (in parentheses) are: land 0.38 (0.58), labor 0.21 (0.80), and "other services" 0.39 (0.59). In all these studies the sum of all the elasticities is near 1. The magnitude of the coefficient of variation indicates a wide spread in the results among the studies. They compare their results with those obtained in the pioneering cross-country study by Bhattacharjee (1955) and with assumptions made in the literature. 5 All of this indicates an effort to get a definitive substantive solution. But as this target was realized to be elusive, they concluded that "[s]till, the variations shown among the elasticities of Table 17.14 bear witness to the dangers associated with the use of any such global production function" [Heady and Dillon (1961, p. 633)]. 6 The discussion is then shifted to the examination of the efficiency of the resource use. For instance, their Table 17.17 presents a ratio of the marginal productivity of labor to its opportunity cost with values varying between 2.84 observed in Taiwan to negative values obtained in dairy farming in Sweden. The median value of this ratio is 0.67. They present similar calculations for land
See, for instance, Hopper (1965), Chennareddy (1967), Sahota (1968), and Herdt (1971) for India; Yotopoulos(1967) for Greece;Huang(1971) for Malaya; and Headley(1968)for the US. 5 Bhattacharjee(1955, regression4) reports elasticities of 0.36 and 0.3 for land and labor respectively. 6 Clark(1973) assemblesmanyresults of factorshares in an informalframeworkbut with goodinternational coverage. It is very clear that the estimates depend on the economicenvironmentwhich is a majortheme of our discussion.
4
8
Y. Mundlak
and capital services, but these are more problematic for conceptual reasons which need not be discussed at this point. To get a view of the diversity of the results, the reader is advised to check some of the country studies based on the primal approach. 7 In 1944 Marschak and Andrews pointed out that the inputs are endogenous, and therefore Ordinary Least Squares (OLS) estimates of the production function are biased. Their paper extended the scope of the analysis by introducing issues related to the statistical properties of the estimates. Their work and Haavelmo's (1947) work on the consumption function were early examples of the problems of simultaneity in economic analysis and thus revived the question that had been asked by Working (1927) about the meaning of statistical demand equations. That opened up a route of work centered on methodological issues with a life of its own. 8 The simultaneity problem in the estimation of production functions was overcome by the factor share estimator proposed by Klein (1953) and applied by Wolfson (1958). This estimator is based on the assumption that firms always employ all their inputs so as to satisfy the first order conditions for profit maximization given the current ex p o s t prices. As such, the factor share estimator is subject to a major conceptual difficulty in that it cannot answer the original question of Cobb and Douglas about the empirical relevance of the competitive conditions because they are imposed in the derivation of the estimator. 9 Although this is seldom explicitly recognized, or acknowledged, all the estimators that use the first order conditions for profit maximization - and to be sure, these include the estimators based on duality as well as on the axioms of revealed preferences - use the very same property and thus are subject to the same limitation. A different line of attack on the simultaneity problem was taken by Mundlak (1961) and Hoch (1962) through the use of covariance analysis, l° Applying this method to a sample of family farms in Israel gave lower estimates for the elasticities compared
7 For instance,in additionto the studies mentionedin footnote 5, US: Tintnerand Brownlee(1944), Heady (1946), Hildebrand (1960), Griliches (1963a, 1963b, 1964), Kislev (1966), Tweeten and Quance (1969), Kislev and Peterson (1996); India: Lau and Yotopoulos(1972); Israel: Mundlak(1961), Sadan (1968); Mexico: Ulveling and Fletcher (1970); Colombia: Colyer and Jimenez (1971); Taiwan: Yotopoulos, Lau, and Lin (1976), Shih, Hushak, and Rask (1977), Wu (1977); Thailand:Mittelhammer, Young,Tasanasanta,and Donnelly(1980). 8 The early work on productionfunctions,up to the early 1960s, is surveyedby Walters (1963). 9 I found the followingstatementby Clark (1973, fn 8, p. 21) to be interesting:"Douglas told me that when the functionwas first prepared in the 1920s, he was expecting it to show that wages then actuallyreceived by labourwere considerablybelow its true marginalproduct; and was surprisedto find that they were in fact extremely close to the levelpredicted by the function". 10 Hoch (1958) examineda solutionto the simultaneityproblem based on identificationthi'oughthe second moments of the equations disturbances.There is no reference in the literature to an empirical application of this method, perhaps for a good reason because, as indicated by Mundlak and Hoch (1965), it is very sensitive to the specificationand in the case of a likely specificationerror can have an unboundedbias. In another paper, Hoch (1955) suggestedthe use of covarianceanalysis.However,the method was not discussed in connectionwith the simultaneityproblem. This is probablythe reason that covariance analysiswas not mentioned in [Hoch (1958)], which deals head-on with that problem. It is only in [Hoeh (1962)] that the covariance analysisis seen as a solutionto the simultaneityproblem.
Ch. 1: Productionand Supply
9
to OLS without allowance for firm effect, and their sum declined from roughly 1 to roughly 0.8. Mundlak (1961) interpreted the difference between 1 and the sum of the elasticities as the factor share of management.I] The method was also used to estimate the managerial capacity and its empirical distribution in [Mundlak (1964a)]. Another substantive result of that study is an elasticity of land near zero. The farms in the sample are very small, and on the surface one would have expected a higher elasticity for land. However, a low elasticity for land is indicative of low profitability of agriculture. This interpretation is supported by the fact that a negligible elasticity for land in Israel was also obtained for a sample of large farms (kibbutzim) in [Sadan (1968)], so the result is unrelated to farm size. The observations made so far are: O. 1 The estimates are not robust. 0 . 2 Often, results show a gap between marginal productivity and real factor prices. 0 . 3 Specifically, there is a difference between estimates based on inter and intrafarm observations. 0 . 4 Firms use different techniques. 0 . 5 Input quality is not addressed. 0 . 6 A lack of clarity on whether to use stock or flow variables. 0 . 7 Inputs are endogenous, and therefore OLS estimates are inconsistent. 0 . 8 It is possible to overcome the problem of inconsistency. 0 . 9 A need to further explore the role and scope of factor-share estimates.
1.2. A simple production model The initial discussion can be conducted in terms of a single-input C o b b - D o u g l a s production function
Y = A X E e m°+u°,
(1)
where m0 is the firm effect, or management, a firm-specific factor known to the firm but not to the econometrician (private information), and u0 is a random term whose value is not known at the time the production decisions are made. The conditional expectation of output, given the input, of firm i is ]2 ye __ E(Ylxi) ~ AX~i e m°i.
(2)
11 Other sources of farm-specific effects are differences in land quality, micro-climate, and so on. However, the emphasis has been placed on management. The firm effect is observed not only in production functions estimated from farm data; it is also a common phenomenon in cross-section analysis of manufacturing data. Thus, it seems that differences due to farming environment are not the main reason for the firm effects. 12 Note that E(e uo) ~ (1 + o'020/2);crg0 = E(u2). This term is ignored in (2).
1o
Y. Mundlak
At this stage we assume that the price is known, and the firm chooses the input so as to maximize the expected profit: maxzre(X[w,P,i) xi
= pye
(3)
_ WXi,
where P and W are the product and input prices respectively. The first order condition is met up to the stochastic terms m 1 and u 1 fi A X Z _ 1 = __W eml+ul ,
(4)
P where m I is known to the firm but not to the econometrician, and u 1 is a transitory component. The term ml reflects the firm's expectation formation and its utility function. In what follows, we will deal with real prices, so that W is the wage in output units, and P is the product price in input units. We write Equations (2) and (4) in logarithms, with the variables measured as deviations from their overall mean, and introduce time notations:
(5) (6)
Yit -- Xitfl = moi + uoit, Yit -- xit -~ w i t -+- m l i -~ Ulit -[~ uoit.
When prices are exogenous the reduced form for x (note that p = - w ) is xit=--c(Pit-t-Ulit+mli--rrloi);
c=(1--fl)
-1.
(7)
The four error components are assumed to be IID with the following first two moments: u j i t ~" (0, a j j ) ;
m j i ~ ( # j , vjj);
j = O, 1,
(8)
where/z0 = 0 and/,t 1 is unrestricted. The expected value of all cross products of the error components is zero. 13 Several of the observations made above are related to the endogeneity of the input. Equation (7) shows that the input is a function of the firm effect, m o i , which is also part of the production function shock, and therefore the input is not exogenous. The bias caused by this dependence contributes to the lack of robustness. Specifically, it contributes to the differences between intra and interfirm estimates (0.3). Also, when biased coefficients are used to test the efficiency of resource use, an erroneous conclusion of an inefficient use of resources (0.2) might be reached even when the firms use resources efficiently, or conversely.
13 Shocks that affect all firms generate time effects that can be treated in the same way as the firm effect. The extension to include time effects is straightforwardand need not be reviewed here (see [Mundlak (1963a)]).
Ch. 1:
Production and Supply
11
Several approaches are offered to overcome the problem of input endogeneity (0.7). When the sample consists of panel data, covariance analysis transforms the variables to deviations from the firm mean, and thereby the firm effect is eliminated from Equation (7). Let the sample average over the time observations be xi ; then Equation (7) is transformed to xit
--
Xi.
=
- - c ( p i t -- Pi. + Ulit
--
Uli.),
(9)
and it is seen that the firm effect has disappeared. The estimator is referred to as a "within" estimator (because it is based on within-firm variations). An alternative approach is to use the price as an instrumental variable for estimating Equation (5). This is basically the dual approach to estimation, to be discussed below. This estimator is likely to be less efficient than the covariance estimator because it does not use all the pertinent information [Mundlak (1996a)]. This can be seen intuitively from Equation (7). The variability of the input in the sample is generated by four components: P i t , u lit, m l i, a n d m o i . The last term causes the bias and should be eliminated, whereas the other three terms provide the information for the estimation. Hence, the most efficient procedure would be to use the first three components as instrumental variables. However, this cannot be done directly because, of the three variables, only p is observed. The within estimator uses the within-firm variations of p and u I as instruments, whereas the dual estimator uses as an instrumental variable the total variations of p but does not utilize the information in u I. The point is that any variability of input, regardless of whether or not it is consistent with the first order condition for profit maximization, generates points on the production function and therefore helps to trace it, or more technically, helps to identify the production function. The use of price as an instrument is subject to some limitations. If the sample consists of competitive firms, the between variability of the prices should be nil. If the sample consists of market (rather than micro) data, then the prices are not necessarily exogenous and therefore cannot be used as instrumental variables. In any case, it is possible to combine the two estimators by using the within-input variable and the price as two instrumental variables. Other possible modifications are suggested in [Mundlak (1996a)]. However, all these have not been tried out. The empirical experience is limited to the 'within' and the dual estimators. Some of the results with respect to the 'within' estimator have been mentioned above, whereas the empirical experience with the dual estimator will be discussed below. The factor-share estimator imposes the first order conditions for profit maximization, in which case the factor share is equal to the production elasticity,/3, up to a stochastic term. Using Equation (6) it is easy to see that this estimator is inconsistent. An important issue in the empirical investigation is whether the function displays constant returns to scale (CRT). If it does, in the case of the single-input function,/3 is equal to 1, and there is nothing to estimate. Thus the problem is more pertinent to the more realistic case with more than one input. To see this, assume now that there are k inputs. In this case, the model consists of Equation (5) where x and/3 will be
12
Y. Mundlak
k-vectors and k-equations of the form of (6) [Cavallo (1976)]. Note that the difference of the first-order conditions for any two inputs, say 1 and 2, is free of m0 and of u0 X2--Xl ~ W 2 - //31 q--U2--Ul q - m 2 - - m l .
(10)
Therefore, x 2 Xl can serve as an instrumental variable. Note that this variable contains all the pertinent information related to the two inputs. There are k - 1 such instruments, and there is a need for one more instrument to complete the estimation of the system. The assumption of CRT is a good candidate. In this case, a Cobb-Douglas function where the variables are divided by one of the inputs is free of simultaneous-equations bias. -
-
1.3. Productivity
To understand some of the subsequent literature we turn to another direction of inquiry, that of measuring factor productivity, that was taking place at the same time. The most influential work in agriculture was that of T.W. Schultz (1953). He noted that in the period 1910-1950 agricultural production rose by about 75 percent due to a change in inputs and in technology. The change in inputs was instigated by price change, with labor becoming more expensive and therefore replaced by machines. ~4 The importance of inputs is measured by their factor shares: "Land and labor a r e . . , very important in farming, with labor representing 46 percent and agricultural land 24 percent of all inputs used in agriculture in 1910-1914" (p. 100). He then goes on to discuss the aggregation of inputs and to derive a measure of the overall increase in productivity by comparing the relative changes in output and input. He notices that the results are sensitive to the price weights and the period of analysis. The rise in the annual average productivity for the period as a whole with end of period prices is 1.35 percent, and with beginning of period prices is 0.8 percent. Where does the technical change come from? Schultz (1953, p. 110) considered three hypotheses: (1) Discoveries of new techniques are by-products of scientific curiosity and as such are unpredictable. (2) The level of scientific activity reflects cultural and institutional values rather than the value of its fruits, and thus, the development of new techniques is not induced by market conditions. (3) Science is supported by society because of its potential material contribution. There is room for all three, but the gold medal is given to the last one. "Therefore, a new technique is simply a particular kind of input and the economies underlying the
14 "Althoughnew production techniques have been many and important, substitution amonginputs is clearly evident and it is consistent with changes that have occurred in the relative prices of inputs ... labor has been withdrawn while other, cheaper inputs have been added" [Schultz (1953, p. 103)]. "United States agriculture has become increasingly dependent on inputs which are acquired from the nonfarm sector" (Ibid., p. 104).
Ch. 1: Production and Supply
13
supply and use are in principle the same as that of any other type of input. We do not wish to imply that every human activity entering into the development of new techniques can be explained wholly by considerations of cost and revenue; our belief simply is that a large part of the modem process of technological research from "pure" science to successful practice can be explained by economic analysis" [Schultz (1953, p. 110111)]. This is the notion of induced innovation. However, "[w]e need also to explain the rate at which farmers adopt new techniques. Clearly, the mere availability of such techniques is no assurance that they will be applied in farming. The process by which farmers take on new techniques, as one would expect, is strongly motivated by economic considerations and yet very little is known about this process" (Ibid., p. 114). Although uncertainty about the new technique is important, Schultz views the new technique as a new input and suggests that the standard economic analysis be applied in the analysis of its adoption. He also recognizes the importance of credit rationing for agricultural markets. This view of technological change is related to the notion of implementation of technology discussed below. This discussion by Schultz amplifies themes already mentioned above and puts on the agenda new ones, particularly the use of factor shares to measure the relative importance of inputs, the need to differentiate between the change in productivity due to a change in inputs and the change in technology, that the change in inputs takes place in response to changes in factor prices, and that the changes in the quality of inputs has to be taken into account in measuring factor prices. To sum up Schultz's additional observations, O. 10 Part of the change in technology is unpredictable. O. 11 Not all of what is known (in terms of technology) is actually implemented. These are all key themes for understanding the subsequent work. To assist the discussion on the measurement of productivity, we write the production function as Y ( t ) = F [ A I ( t ) X 1 (t) . . . . . A k ( t ) X k ( t ) , t],
(11)
where the A's are factor-augmenting functions or, not independently, quality indexes. Differentiate the function logarithmically, using a generic notation, din x / d t ----~, Y'(t) = [O)l (t) (A l (t ) + Xl(t)) + . . . + Cok(t)(Ak(t)+ Xk(t))] + r(t) = [aggregate input] + r (t),
(12)
where the o)'s are weights and r is the relative change in the total factor productivity or the 'residual'. In estimation, the A's should be included as variables in the analysis to avoid specification error. All productivity measures are based on a comparison of changes in aggregate output with changes in aggregate input. The change in the aggregate input should measure changes in quantity that take place under constant technology. That is, the quality variables should be uncorrelated with the residual r (t). If they are correlated, the empirical production function is a locus of points that are generated by more than one function. To illustrate, the work of children in ditch digging is not as productive as that of adults.
14
Y. Mundlak
Therefore, adjusting the labor input by assigning different coefficients by age or gender will give a more meaningful measure of the labor input. Another example is the measure of fertilizers by their nutrient content. But most of the quality adjustments are of a different nature. A good example is the adjustment of the labor input for education where a measure of schooling multiplies the physical labor input to yield quality-adjusted labor input, measured by the total years of schooling. What is the meaning of this adjustment? If the task is digging ditches, education, at best, should not make a difference. But if there are alternatives to digging by hand, education can make a difference in the profitability of implementing these alternatives. Generalizing, an increase in the level of education, other things equal, is expected to increase the use of more advanced techniques. Thus, in this case technology is not held constant; education is a carrier of a technical change and should be treated as such. We return to this subject when we discuss the results of cross-country estimates of the production function. One implication of this distinction is that the measure of returns to scale should not include the effect of 'quality' variables that represent technology. There is no general agreement on this approach, and for alternatives see, for instance, Griliches and Jorgenson (1966). The aggregation weights can be based on market values leading to factor shares, as done by Ruttan (1956) and Solow (1957), or by production elasticities derived from empirical production functions. Note that in the case of a Cobb-Douglas production function these elasticities are constant. Otherwise, they vary over the sample as do the factor shares, and the results vary accordingly. Much of the work on measures of productivity change uses elasticities derived from empirical production functions. Griliches (1963a) deals directly with the effect of input quality on the measurement of productivity and, not independently, on the empirical production function. He argued for the use of the empirical production function to provide the weights for the aggregation of inputs. To this end, he fitted a Cobb-Douglas function to data for the 68 USDA regions in the US in 1949. The emphasis is on the role of education and economies of scale in accounting for productivity changes. He obtained a sum of elasticities of 1.36 from a regression without education and 1.35 with education included. Thus, the education was not the source for the sum of elasticities to exceed 1, which was taken as evidence of economies of scale. This result was incorporated in the analysis of sources of productivity growth, with the assertion that "... changes in output are attributable to changes in the quantities and qualities of inputs, and to economies of scale, rather than to 'technical change'" (Ibid., p. 332; italics by YM). "This procedure led to an almost complete accounting for the sources of output growth in the United States agriculture during 1940-60 leaving no 'unexplained' residual to be identified with unidentified 'Technical changes'" (Ibid., p. 333). The essence of that discussion is the belief that if the analysis is carried out with care, there should be no unexplained residual left. 15 15 This viewwas alsorepeated in [Gfiliches(1964)]wherethe empirical analysiswas extendedto cover 1954 and 1959. "[I]t is possible to accountfor all of the observedgrowthin agricultural output without invoking the unexplained conceptof (residual) technical change"(p. 970).
Ch. 1:
Production and Supply
15
There was some discomfort with the estimates, but nevertheless, those were preferred to factor shares because, relying on Schultz, the agricultural sector was perceived to be in a continuous disequilibrium.16 As the empirical results show, education is important, the elasticities differ from factor shares, and the sum of elasticities was larger than 1. Therefore, "[t]hese findings, particularly the last two, if accepted, will account for a substantial fraction of the conventionally measured productivity increases" (Ibid., p. 336). In passing, one can question the meaning and the usefulness of the concept of equilibrium used to describe agriculture if it is thought to be in a continuous disequilibrium. Basically, it reflects an application of the concept of static equilibrium to a dynamic process. The two are not the same. We shall return to this below. Aside from the question of the residual, can the above results be taken as indicative of economies of scale? There are two issues to be considered. First, internal economies of scale is a concept related to the cost structure of a firm and cannot be measured from regional aggregates. There are many farms of different size, and hence there is nothing in the structure of agriculture that suggests economies of scale. The optimal size depends on the technology used and the level of management of the firm. Changes in technology affect the optimal size, but this change in size is the result of the technical change. Second, there is a statistical aspect. Note that the regressions that produce a sum of elasticities larger than 1 are strictly cross-section, and hence they are subject to a bias caused by the correlation between the unobserved regional productivity level and the inputs, similar to the management bias in the analysis based on firm data. This view was taken by Kislev (1966) who analyzed data of 3,000 US districts for 1949 and 1959. To account for the unobserved regional productivity he introduced regional dummies (68 regions), and as a result the sum of elasticities declined from 1.167 to 1.05. Regional dummies do not capture the management effect, so a management bias is still present in these estimates. Very likely this is the reason that the sum of elasticities is still slightly above 1. Kislev and Peterson (1996) reexamine the evidence on economies of scale with reference to empirical results of cross-state estimates of Cobb-Douglas functions for the U S 17 The sum of elasticities for each of the years 1978, 1982, and 1987 is 1.3. They do not take it as evidence of increasing returns to scale but rather as an indication of management bias. We return to this subject in the discussion of crosscountry studies. Griliches (1964) also introduces a measure for research and extension as a shifter of the production function, a practice that has been followed in other studies such as the studies based on cross-country data.
16 In the spirit of positive economics, "[t]he most important test of the estimated production functions is not how well it fits the data it was derived from but rather whether and how well it can 'predict' and interpret subsequent behavior" [Crriliches (1963a, p. 339)]. 17 The respective results for cross-state regressions for 1978, 1982, and 1987 are: land 0.1, 0.11, 0.13; labor 0.27, 0.27, 0.22; machinery 0.23, 0.27, 0.15; fertilizers and chemicals 0.27, 0.21, 0.27; and other 0.43, 0.43, 0.52.
16
Y Mundlak
1.4. The productivity of capital Durable inputs are entered into the production function and in productivity analysis as stocks. This procedure is sometimes questioned (0.6), and it is suggested that the stock variable should be replaced by a flow that represents the service provided by the stock. This suggestion is based on the assumption that there is a unique variable that represents the service that can be retrieved from the analysis of annual data. Unfortunately, this is not the case. By its very nature, a durable input is purchased if the discounted expected returns from this input over its lifetime cover its cost. Thus, the service from this input is the returns over its lifetime, and this is not easily transferable to a service in a given calendar period, say a year. To sharpen the point, note that the service of a combine in the winter, when there is no harvest, is zero. However, the service for the year is positive. In some years the service is greater than in other years, depending on the area harvested and the yield, and these are affected by stochastic variables. Ex post, the value of these variables is not the same as the expected values. How are the actual values calculated? In a production function analysis, they are determined from the coefficients of the empirical equation. For instance, the coefficient of capital in a Cobb-Douglas function estimates the 'average' elasticity of capital for the sample. This can be used then to compute the marginal productivity of capital for each sample point. In some years, it may be lower than the rental cost, but this does not mean that there was too much capital in that year. The apparent overcapacity is there to provide the service in times of higher demand.
1.5. Productivity and heterogeneous technology The foregoing discussion provides sufficient empirical evidence to evaluate the most cardinal question related to production: what is the rate, and also the nature, of technical change? Aspects of this question were addressed in one form or another in almost every empirical study of time-series data. Equation (12) characterizes much of the literature which conveys the idea that there is a unique answer to this question, and that if we work hard enough, we will find it or come close to it. Unfortunately, the matter is not that simple. The available technology is defined as the set of all available techniques, and technical change is a change in this set. An appearance of a new technique implies a change in the available technology. In this sense, the available technology changes continuously; any new scientific publication may represent a change. However, this definition is too broad, and as such its usefulness is limited to serving as a reference point but has no operational value. The available technology contains a subset of techniques which are not implemented and thus are not observed, directly or indirectly. Therefore, there is no metric to measure the stock of the available technology or its change. Any empirical inference about technical change is based on observations and as such, by definition, is restricted to the implemented, rather than the available, technology. This is the domain of the empirical analysis.
Ch. 1: Productionand Supply
17
OUTPUT/LABOR
;E
o
~,
~
k2
CAPITAL-LABOR RATIO
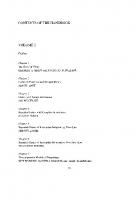
Figure 1. Resourceconstraint and the choice of technique.
The distinction between the available and implemented technology is not trivial if there is more than one available technique. In this case, the choice of the implemented techniques can affect the calculation of the change in the total factor productivity (TFP). To illustrate the issue, Figure 1 presents two production functions describing, say, traditional ( f l ) and modern (f2) techniques. The horizontal axis measures the input ratio, say capital-labor ratio, and correspondingly, the vertical axis measures the average labor productivity. Initially, only the traditional technique is available, and output is at point A with input ratio k0. The response to the appearance of the modern technique may take various forms depending on the constraints to its implementation and the market conditions. If the sector is a price taker, production changes from point A to point M with input ratio of k2. The total change in output, YM/YA, is decomposed to the input effect, Y8/YA, and the relative change in the TFP, YM/liB. The point YB is obtained by extending the line tangent to the production function at point A to point B with capital-labor ratio k2. If the supply of capital is initially perfectly inelastic, the input ratio remains at k0, and resources are allocated to the two techniques to produce the output given by point N. This movement generates a relative change in TFP of YN/YA. As more capital becomes available, the movement will be along the tangent line from N to M. This movement from point N on is explained exclusively by the input change and thus shows no change in the TFP. Consequently, the resulting TFP is different from that obtained in the case of perfectly elastic factor supply. The discussion abstracts from the question of time needed to travel on each path. Actual calculations are done for data collected for calendar time, say a year. The results will differ with the changes in the pace of the yearly movement. However, when the annual results are integrated, the final outcome will depend on the path followed by the economy. Obviously, the path taken under a resource constraint will give a smaller value to the TFR In this sense, the difference in empirical calculation of the TFP is path-dependent. The reason for the difference between the two results to the same change in the available technology is
18
Y. Mundlak
related to the change in the factor prices, or marginal productivity. The appearance of a new technique which is both capital-intensive and more productive increases the demand for capital. When the capital supply is not perfectly elastic, its price (or its rental rate) will increase so as to internalize all or part, depending on the supply elasticity, of the technical change. Specifically, when capital is initially fixed, the subsequent movement from N to M is fully accounted for by the change in capital availability. Thus, in the first case the contribution of the input is obtained by using the same marginal productivity in the base and new technology, whereas in the second, when the two techniques coexist, the marginal productivity of the scarce resource increases and that of the other resource declines. The resulting change of weights absorbs some of the technical change and assigns it to the inputs. This is a remarkable result. The technical change might be of considerable magnitude and still may escape the measurement. This is the case where the bias of the technical change is in the direction of a scarce input. This applies not only to physical capital but also to human capital, and specifically to the level of education. It is in this sense that education is a carrier of technology. The literature discusses the slowdown in productivity changes in the US economy during the 1970s. Such a phenomenon is consistent with the process analyzed above where there is a change in technology but it is not captured by the calculation of productivity. The discussion is also related to adjustments in quality done in the calculation of changes in the TFR The importance of the quality is an outcome of the technical change, and if it is considered as a contribution of the inputs, it takes away from the TFR Thus attempts to eliminate the residual technical change by such adjustments grossly underestimate the importance of technical change (see for instance [Griliches and Jorgenson (1966)]. The implication of heterogeneous technology for empirical analysis was formulated in [Mundlak (1988, 1993)]. It is outlined in the following section. The approach was applied empirically to time series studies ([Mundlak et al. (1989)], for Argentina; [Coeymarts and Mundlak (1993)], for Chile; and [Lachaal and Womack (1998)], for Canada). We will now use this framework to interpret the empirical analysis of cross-country data.
1.6. Heterogeneous technology Let x be the vector of inputs and Fh (x) be the production function associated with the hth technique, where Fh is concave and twice differentiable, and define the available technology, T, as the collection of all possible techniques, T = {Fh (x); h = 1 . . . . . H}. Firms choose the implemented techniques subject to their constraints and the environment within which they operate. We distinguish between constrained (k) and unconstrained (v) inputs, x = (v, k), and assume, without a loss of generality, that the constrained inputs have no alternative cost. The optimization problem calls for a choice of the level of inputs to be assigned to technique h so as to maximize profits. To simplify the presentation, we deal with a comparative statics framework and therefore omit a
Ch. 1: Productionand Supply
19
time index for the variables. The Lagrangian equation for this problem is
L ~ - ~ p h F h ( V h ' k h ) - - Z WhV h - - ) ~ ( ~ h
(13)
subject to Fh(.) ~ T; vh >>-0; kh >>-O, where Ph is the price of the product produced by technique h, w is the price vector of the unconstrained inputs, and k0 is the available stock of the constrained inputs. The solution is characterized by the Kuhn-Tucker necessary conditions. Let s = (k, p, w, T) be the vector of state variables of this problem and write the solution as: v h (s), k h (s), X*(s). The optimal inputs v~, k~ determine the intensity at which the hth technique is implemented, where zero intensity means no implementation. The optimal output of technique h is y/~ = Fh(v[~, k~), and the implemented technology (IT) is defined by
IT(s) = {Fh (Vh, kh); Fh (V~, k~) • O, Fh E T}. The essence of the analysis is that the implemented technology is endogenous and determined jointly with the level of the unconstrained inputs conditional on the state variables. This result cannot be overemphasized, and it is essential for the interpretation of all the empirical results, regardless of specification. Of particular importance is the interpretation of the aggregate production function which expresses the aggregate of outputs, produced by a set of micro production functions, as a function of aggregate inputs. This function is not uniquely defined because the set of micro functions actually implemented, and over which the aggregation is performed, depends on the state variables and thus is endogenous. A change in the state variables causes a change in the implemented technology and in the use of inputs. It is in this sense that the function is endogenous and as such not identified. It can be identified if there are deviations from the first-order conditions. Given such deviations, we get an empirical function as F(x, s). This function has a second degree approximation which looks like a Cobb-Douglas function, but where the elasticities are functions of the state variables and possibly of the inputs: In Y = F(s) + B(s, x ) l n x + u,
(14)
where y is the value added per worker, B(s, x) and F(s) are the slope and intercept of the function respectively, and u is a stochastic term. This expression is given below a more descriptive structure which leads to an approach in its estimation which requires the knowledge of factor shares. The factor shares needed for this approach were not available in the cross-country application reviewed below, and therefore we do not go into it. Variations in the state variables affect F(s) and B(s, x) directly as well as indirectly through their effect on inputs:
Olny/Osh = OF(.)/Osh + lnx[OB(.)/Osh] q- B(.)[O lnx/Osh].
(15)
The last term shows the output response to a change in inputs under constant technology. The innovation in this formulation lies in the response of the implemented technology to
20
Y Mundlak
the state variables as shown by the first two terms on the right-hand side. The elasticities have a time index, which is suppressed here, indicating that they vary over the sample points. Because the state variables have a large spread across countries, the coefficients of the Cobb-Douglas function are expected to change accordingly. This is the reason for the lack of robustness in the results. When the available technology consists of more than one technique, a change in the state variables may cause a change in the composition of techniques in addition to a change of inputs used in a given technique. In this case, the empirical function is a mixture of functions and as such may violate the concavity property of a production function. Consequently, the evaluation of empirical results should deal with the role of the state variables in production in addition to that of the inputs (or their prices in the case of dual functions). Some state variables are included in many of the studies without a reference to an explicit theory. The state variables can be classified in the following groups: constraints, incentives, available technology, physical environment, and the political environment. There is no clear-cut separability between inputs and state variables. For instance, when capital is a constraint, its coefficient in the production function will reflect not only its productivity in a given technique but also its contribution to output through the change in the composition of the implemented techniques. A similar argument applies to the role of prices in the empirical dual functions. It is conjectured that future progress in the empirical analysis of production will have to deal more explicitly with the role of the state variables within a coherent framework. In this review, we concentrate on the role of inputs and limit our discussion of the state variables to serve this end. As such, it is incomplete but still serves a starting point to stir thinking on the subject. 1.7. Cross-country studies
The considerable spread between countries in agricultural productivity, in resource use, and in the economic and physical environment provides an important source of information for testing our understanding of the factors that determine productivity. The crosscountry analysis of Bhattacharjee (1955) had no follow-up until the revival by Hayami (1969, 1970) and Hayami and Ruttan (1970). This revival added important variables that were missing in the original paper, namely measures of some capital components (livestock and machines) and of education. The underlying assumption of these studies is that all countries use the same production function. But this assumption lacks empirical support. To get an idea of the prevailing heterogeneity, we can compare the elasticities obtained in the earlier crosscountry studies (Table 1) with those obtained from country studies listed in footnote 7. For an order of magnitude, we refer to the values Hayami and Ruttan used in their exercise for sources of growth differences between countries: labor 0.4, land 0.1, livestock 0.25, fertilizers 0.15, machinery 0.1, education 0.4, and research and extension 0.15. As to the sum of elasticities, in their analysis for 1960, the estimates were in the range of 0.95-0.98. The exercise attributes about two thirds of the output differences among
Ch. 1:
21
Production and Supply
Table 1 Estimated productionelasticities- cross country Study
Period
Sample
Labor
Land
All
Comments
Bhattacharjee (1955)
1948-1950
22 countries
.30
.36
1.00
Hayami (1969)
1960
38 countries
.45a
.20a
1.00a
Elasticitiesused for productivitymeasures.
Hayami & Ruttan (1970)
1955, 1960, 1965
38 countries
.40b
.l0b
1.00b
Elasticitiesused for productivitymeasures.
Nguyen (1979)
1970 1975
Mundlak & Hellinghansen(1982) Antle (1983)
1960-1980
40 countries 35 countries 58 countriesc
.38 .37 .46
.02 -.03 .16
0.99 0.92 1.00
Regressionincludes education. Uses principal componentsmethod.
1965
66 countries
.33
.17
0.92
Includesinfrastructure and education.
Kawagoe, Hayami, & Ruttan (1985)
1960, 1970, 1980
43 countries
.45d
.10d
1.00d
Elasticitiesused for productivitymeasures.
a Range of coefficients:Labor .43-.53, Land. 18-.25, Sum 0.964).97. b Range of coefficients:Labor .34-.49, Land .06-. 12, Sum 0.94-0.98. c Data is pooled for time period. d Range of coefficients:Labor .41-.55, Land .01-.10, Sum 1.01-1.10.
countries to input differences and one third to differences in human capital. Subsequent studies updated and extended the analysis. Nguyen (1979) updated Hayami and Ruttan results by computing regressions for 1970 and 1975. The results are similar to those obtained by Hayami and Ruttan with two exceptions: the elasticity of machines increased with time, 18 and the elasticity of fertilizers declined and approached zero in 1975. He finds that when education is measured as a sum of primary and secondary education, it is not significant, but secondary education alone is significant. He takes the view that the secondary education has a causal effect on productivity. Alternatively, we can interpret this result as indicative that education is endogenous, and higher productivity increases the demand for education. The adjustment to a changing economic environment is at the margin, and this places the emphasis on secondary education. Kawagoe and Hayami (1983) and Kawagoe, Hayami, and Ruttan (1985) further update the analysis to include 1980. Like Nguyen they test for a change of coefficients over time and state that the production elasticities of conventional and nonconventional inputs remained largely the same, although some pronounced changes occurred between 1960 and 1980: the elasticity of labor declined from 0.53 to 0.41, machinery increased from 0.04 to 0.12, fertilizer increased from 0.13 to 0.25, and land increased from 0.04
18 Similarresults were obtainedby Shumway,Talpaz, and Beattie (1979) for the US.
22
Y. Mundlak
to 0.08. Thus, there is no evidence of land-saving technical change. It is hard to think of fertilizer share as being as high as 0.25, which is also in direct contrast to the results obtained by Nguyen, in which the fertilizer elasticities were approaching zero. Another deviation from the earlier results of Hayami and Ruttan is a sum of elasticities for developing countries of about 1.3, which they take as evidence of increasing returns to scale. This magnitude affects the growth-accounting exercise because, as indicated by Equation (12), an increase in the input weights used for calculating TFP increases the contribution of the aggregate input and reduces the TFR This explains their conclusion that the cross-country differences in output are mainly due to differences in inputs with a very small role for the residual, under 7 percent and as low as - 5 . 5 percent. This conclusion on negligible change in the TFP is similar to that reached by Griliches (1964). As we argue below, they both are the outcome of biased coefficients which exaggerate the relative importance of the inputs. This interpretation is supported by the results reported by Kislev and Peterson (1996) who computed the Hayami-Ruttan regressions with country dummies, and the sum of elasticities declined from 1.32 to 1.077, with the latter not significantly different from 1. A search for variables that represent the shift in the productivity level in the context of cross-country studies led Evenson and Kislev (1975) to emphasize research, and Antle (1983) to emphasize infrastructure. The problem with this group of variables is that some of them are unobservable, others are measured in some countries and not in others, and finally, because of multicollinearity, regressions do not support all of the variables that are actually used in the analysis. 19 An implicit questioning of the assumption of uniform technology is detected in the work of Hayami and Ruttan when they divide the countries into two groups, developed and developing. This would imply that the technology changes with the level of development. However, this classification is not sufficiently informative because neither group is homogeneous. To introduce the impact of the level of development, it is more informative to include an income variable in the regression. This procedure opens up the door for extending the analysis to allow for heterogeneous technology. Mundlak and Hellinghausen (1982) remove the assumption that all countries e m p l o y the same production function. Instead, it is assumed that all countries have a c c e s s to the s a m e t e c h n o l o g y and they differ in the implementation of the technology, in line with O. 11. The variables postulated to affect the choice of technology, referred to as state variables, were resource endowment and the physical environment. The resource constraint consists of physical and human capital. As no information was available on the individual components of this constraint, it is represented in the study by the per capita total output in the country. The results show a great spread in the estimates across countries and
19 As Evenson and Kislev (1975) noted, "... with the inclusion of research variable, the fertilizer variable declines in size and significance, the same being true about the schoolingcoefficient .... These two variables, together with the technical educationvariable, served in the original Hayamiand Ruttan analysis as proxies for human capital and research. These proxies are effectivelyreplaced by genuine research variable ..." (p. 180). A somewhat similar result was obtained by Antle (1983) with an infrastructure variable.
Ch. 1: Production and Supply
23
over time which is accounted for, in part, by differences in the physical and economic environment. All these results provide clear evidence for the lack of robustness of the empirical results, which is consistent with O. 1. One possible way to stabilize the results is to choose a more flexible functional form than the Cobb-Douglas. The major changes that were introduced were the constant elasticity of substitution (CES) function by Arrow et al. (1961) and the translog function by Christensen, Jorgenson, and Lau (1973). The CES function generalized the Cobb-Douglas function by allowing a constant elasticity of substitution to differ from 1. The translog function is an example of a flexible function, a function that allows a second degree approximation to a production function. The few experiments with the CES function in agricultural economics did not prove it to be significantly different from Cobb-Douglas, and therefore it was not widely applied. 2° The situation is different with quadratic functions that have been widely used since the early 1970s, largely in connection with the dual approach, as reviewed below. From the vantage of the present discussion, we note that the main feature of a quadratic production function is to make the marginal productivities, or the production elasticities, depend on the input combination for which these coefficients are calculated. Thus, we can still postulate that all producers (or countries) use the same production function and their production elasticities vary with their choice of inputs. Alternatively, it is possible that the producers do not use the same production function and the choice of the function is an economic decision. The variability in the state variables that exist in cross-country data offers an opportunity to gain an insight to the determinants of resource productivity. For instance, the available technology, common to all countries, varies over time. On the other hand, capital constraints and the physical environment are country specific. There are three processes which can be studied by decomposing the country-panel data to three orthogonal components to yield the regression 21 Yit -- Y.. =
(xit
--
eit,
Yi.
--
X.t
+ X..)w(it)
+ (X.t -- x . . ) b ( t )
q-
(Xi.
--
x..)b(i)
(16)
20 Hayami (1970) tried several modifications to the cross-country analysis. He found that a Cobb-Douglas function is not rejected when the maintained hypothesis is a CES function and that Nerlove-type distributed lags as well as serial correlation correction as suggested by Griliches gave "implausible results". Heady and Dillon (1961 ) discuss various functional forms used in agricultural research, including the quadratic function. Fuss, McFadden, and Mundlak (1978) discuss functional forms used in economic analysis. For an interpretation of the literature on the elasticities of substitution and their relationship to functional forms, see Mundlak (1968). 21 Regressions that use time and country dummies provide estimates of w(it), those that use only country dummies provide estimates of matrix-weighted averages of w (it) and b(t), those that use only time dummies provide estimates of matrix-weighted averages of w (it) and b(i), whereas regressions without time or country dummies provide estimates of matrix-weighted averages of all three coefficients in Equation (16). It is in this sense that the three sets of coefficients in Equation (16) constitute a canonical set.
Y. Mundlak
24 Table 2 Cross-countrypanel Within time and country Variable
Estimate
t-score
0.37 0.47 0.08 0.08
6.90 3.78
Between time Estimate
t-score
Between country Estimate
t-score
Inputs; Capital Land Labor Fertilizer
1.03
6.01 -0.16 0.33
0.34 -0.03 0.26 0.43
13.13 -2.82 13.67 21.91
1.53
-0.16 0.14
0.09 0.83 0.52
0.55 3.80 3.36
-0.28 -0.32 -0.21
-0.06 -0.07 -0.33
0.02 0.06 0.31
0.52 4.19 2.97
0.04 -0.03 -0.00
1.78 -0.97 -0.75
0.02 -0.07 0.04
0.09 -0.26 0.71
0.01 -0.08 0.07
1.95 -2.82 4.25
0.16 0.44
2.68 7.96
Technology: Schooling Peak yield Development
Prices: Relative prices Price variability Inflation
Environmental: Potential dry matter Water availability
Note: R-squarefor 777 obs. = .9696, 1970-1990, 37 Countries.Source:Mundlak,Larson, and Butzer (1999).
where y is log output, x is log input (or a vector of inputs), a dot in the subscript indicates an average over the missing index, w ( i t ) , b(t), and b(i) are the regression coefficients of the within-country-time(or, simply, within), between-time, and betweencountry variables respectively. The between-time process captures the impact of changes over time in the state variables common to all countries such as changes in the available technology (technical change). The between-country process captures the impact of the country-specific variables that take place when the available technology is held constant, but other state variables differ across countries and contribute to the differences in the implemented technology. Finally, the within-country-timeprocess represents the effect of changes in the outputs, inputs, and state variables when the available technology and the countryspecific environment are held constant and thus comes closest to a production function representing what we refer to as the core technology. This approach was used by Mundlak, Larson, and Butzer (1999) in the analysis of a sample of 37 countries for the period 1970-1990. The study differs from other studies in that it uses a new series of agricultural capital and in the state variables that were included. This choice of variables limited the sample to countries which had all the required information. We will concentrate here on the coefficients of the conventional inputs. The results are summarized in Table 2, which presents the estimated elasticities for the three regressions where the dependent variable is the log of agricultural GDR
Ch. 1:
Production and Supply
25
A striking result is the relative importance of capital. The capital elasticity is 0.37 for the core technology and 0.34 in the between-country regression. This result is quite robust to various modifications of the model and to the disaggregation of capital. On the other hand, the capital elasticity in the between-time regression is 1.03. This represents the response common to all countries in the sample. It indicates that, on average for the sample, an increase in capital was accompanied with a proportional increase in output. This strong response is consistent with the view that physical capital has been a constraint to agricultural growth. This empirical proposition is well illustrated by McGuirk and Mundlak (1991) in the context of the Green Revolution. The between-time regression shows that the shift to more productive techniques is associated with a decline in labor. The labor coefficient in the core technology is also relatively low, whereas that of the between-country regression is more in line with the other cross-country studies. The low labor elasticity obtained for the core technology and the between-time regressions is an indication of the labor-saving technical change in agriculture, which is consistent with the slight decline of labor over time. This is not news, but it is emphasized here because it comes out of an integral view of the process which separates between the core technology and the changes that took place over time and between countries. These results highlight the importance of capital in agricultural production, an attribute critical in the understanding of agricultural development and its dependence on the economic environment. This indicates that agricultural technology is cost-capital intensive compared to nonagriculture. 22 This last conclusion is further reinforced by the magnitude of the land elasticity in the core technology and is at variance with the view that land is not an important factor of production in modern agriculture. This view is based on an incorrect reading of the data where no distinction is made between changes in the technology and the movement along a given production function. The sum of capital and land elasticities is around 0.8 in various formulations, making it clear that agriculture should be more sensitive than nonagriculture to changes in the cost of capital, and less to changes in labor [Mundlak et al. (1989)]. This value of the sum is a bit high compared to the literature. It is possible that a different choice of countries and time periods would lead to somewhat different results. However, a sum of 0.8 for land and capital elasticities leaves room for the conclusion on the importance of capital to remain intact. The introduction of state variables to account for technology, prices, and physical environment results in a production function that displays constant returns to scale and thus avoids the pitfalls of previous studies and the misguided conclusions that followed. Using the within elasticities from Table 2 and the median growth rates for the sample, we see that aggregate input and total factor productivity residual technical change each accounts for about one half of the total output growth of 3.82 percent per year. This evaluation of the contribution of aggregate input is substantially smaller than the rate
22 We say that a technologyis cost-capitalintensivewith respect to a referencetechnologyif its factor share of capital is largerthan that of the referencetechnology.
26
Y Mundlak
reported in the cross-country studies referred to above. These studies use the betweencountry estimates where the weight of fertilizers is high and that of land is low. The median growth rate of land in the sample was 0.12 percent and that of fertilizers was 3.04. The difference in the elasticities of these two variables accounts for much of the difference in the growth accounting. In addition, the studies that report increasing returns to scale overstate the role of inputs and understate the role of technical change. 1.8. The rate of technical change As indicated above, all measures of technical change refer to changes in the implemented technology and thus report not only on the advances in knowledge but also on its implementation. Direct measures deal mainly with changes in the TFP and not with its bias. The latter is the subject of the studies based on duality to be discussed below. We summarize some results to give orders of magnitude to the changes in the TFP and its importance. Ball (1985) calculates total factor productivity growth using constructed TornqvistTheil indexes of outputs and inputs for US agriculture for the period 1948-1979 based on data adjusted for quality variations. The inputs are labor, capital, and intermediate inputs, such as energy, agricultural chemicals, feed and seed, and miscellaneous. The result is average annual growth of productivity of 1.75 percent as compared with 1.7 percent obtained from USDA data. Capalbo and Vo (1988) review the evidence on agricultural productivity, and their result for 1950-1982 is TFP of 1.57 as compared to 1.95 as obtained by the USDA for the same period. 23 Ball et al. (1997) present the production accounts for US agriculture for the period 1948-1994 and report growth rates for the period and subperiods, based on Fisher indexes. The average growth rates for the period as a whole are 1.88, - 0 . 0 7 , and 1.94 percent for production (including intermediate products), aggregate input, and TFP, respectively. 24 Note that, because of the decline in the aggregate input, the growth in the TFP is larger than that in production. This result is extremely different from the studies based on cross-state data for the US, which attribute most of the change in output to inputs rather than to productivity. However, it is similar to the 1.9 percent growth result obtained by Mundlak, Larson, and Butzer (1999) for 37 countries for the period 1970-1990 discussed above. 23 The cost shares were: Year L a b o r Equipment & livestock ] 960 0.24 0.25 1980 0.11 0.21
Land & structures 0.16 0.41
Chemicals E n e r g y 0.04 0.06
0.04 0.04
Other 0.26 0.17
The average annual growthrates were: output 1.76, labor -1.32, family labor -3.09, equipment 2.04, animal capital 0.38, structures and land 0.1, fertilizer 5.01, pesticides 6.07, energy 1.58, other materials 1.2, and all inputs 0.17. 24 The change in the TFP during 1948-1979 is approximately 1.47 percent - a figure derived from Ball et al.'s (1997) results - which is lower than the figure reported in [Ball (1985)]. The difference is due to the changes in the measurement of the variables.
Ch. 1: Production and Supply
27
Jorgenson and Gollop (1992) compare the postwar productivity performance of US agriculture with sectors in the private nonfarm economy using the total price function. Productivity growth explains 82 percent of economic growth in agriculture, but only 13 percent in the private nonfarm economy. The average annual growth rate of TFP growth in agriculture during 1947-1985 was 1.58 percent, nearly four times larger than that of the rest of the economy. Rosegrant and Evenson (1992) examine total factor productivity growth and its sources in the crops sector in India, using district panel data for the period 1956-1987. They first compute TFP and second explain its variations in terms of variables representing investments in research, extension, human capital, and infrastructure. TFP in the Indian crops sector grew during the period 1957-1985 at an average annual rate of one percent, and this accounted for about one third of total output growth in that sector. The growth rate for the same period was 0.78 in Bangladesh and 1.07 in Pakistan. Research, extension, domestic and foreign inventions, and adoption of modem varieties show statistically significant, positive impacts on TFP. The effect of the proportion of area irrigated on TFP is slightly negative, indicating that irrigation has no additional effects on productivity except through its contribution to total input levels. In any case, this procedure is only adequate if the coefficients estimated in the first stage are independent of the variables that explain the changes in the TFR This is a strong assumption that needs empirical support, and it is inconsistent with the result reported in [McGuirk and Mundlak (1991)]. The new productive varieties are more intensive in irrigation and fertilizers, which have been scarce resources. 1.9. P r i m a l e s t i m a t e s - s u m m a r y
The centerpiece in primal estimation is the Cobb-Douglas function. This approach does not impose competitive conditions but instead submits them to empirical testing. Such testing often shows a difference between the factor shares and the estimated production elasticities. This is not an absolute rejection of the prevalence of the competitive conditions but rather a conditional result, based on the model used and the statistical procedure. Still it is indicative that wide gaps may exist. Tables 1 and 2 present selected summary results of the studies reviewed as well as others with a similar message. It is noted that the elasticity of labor never exceeds 0.5, and in most cases it varies in the range of 0.25 to 0.45. This value is well below the elasticity of labor in nonagriculture. 25 If we consider all nonlabor income as capital income, the result supports the position that agriculture is cost-capital-intensive and therefore is less susceptible to increases in the wage rate than nonagriculture. Also, the labor elasticity declines with time, indicating that the technical change was labor-saving.
25 In most studies on agriculture, output is measured as production, which includes raw materials, whereas production analysis in nonagriculture is conducted in terms of value added. Thus an exact comparison calls for applying the same output concept in both sectors. This was done in [Mundlak et al. (1989)] for Argentina, where it was found that the factor share of labor in agriculture is indeed lower than that in nonagriculture.
28
Y. Mundlak
In country studies, the elasticity of land varies between zero in some cases to about one third. We interpret this elasticity to be a measure of the competitive position of agriculture. From the point of view of farm income it is meaningful to look at the sum of labor and land elasticities, and this sum is fluctuating around 0.5. The sum of elasticities of farm inputs (that is, inputs decided on by the farmer, in contrast to public inputs) is used as a measure of economies of scale. In some studies based on cross-sectional data this sum is larger than 1; this was taken by the authors as evidence of increasing returns to scale. We attribute this result to statistical bias. One justification for estimating production functions is to provide weights for the computation of technical change. However, this approach has not provided any substantive advantage as compared to the use of factor shares, even though they may not be the same as the production elasticities. The reason is that mistakes in specification and interpretation of statistical studies are often greater than the discrepancies between the factor shares and the true production elasticities. An example is the error involved in the finding of increasing returns to scale and its incorporation in the computation of total factor productivity that leads to the elimination of the residual in a comparison of growth over time or productivity differences across countries. It is tempting to speculate that such a procedure was motivated by the belief that all growth can be accounted for and therefore there should be no residual. As we take an opposite view, we do not feel that the loss of explanation involved in the reduction of the sum of elasticities to 1 causes any loss in insight; on the contrary, it directs our attention to search for an understanding of the process. An important feature common to many of the studies is lack of robustness of the estimates and their dependence on the variables used and the sample coverage. This finding contributed to a search in three directions: 1. Overcoming the simultaneousequations bias caused by the endogeneity of the inputs. As we shall see in the next section, dual estimates that were supposed to solve this problem do not produce more robust results. 2. Algebraic form of the production function. Indeed, the Cobb-Douglas function is restrictive, but natural generalizations enlarged, rather than shrank, the range of results. 3. Allowing for the endogeneity of the implemented technology. This approach utilizes the variability to improve our insight of the observed productivity differences over time and across countries.
2. The duality culture Quadratic production functions, by their nature, contain many variables that are correlated, and therefore the estimated parameters suffer from low precision (big confidence regions) to the extent that they often do not make sense. To overcome this problem, the common procedure is to estimate the production function parameters by fitting the factor shares, with or without the constraint of the production function itself. The implicit idea is that the variations observed in the factor shares in the sample can be attributed to differences in input ratios, or said differently, to different locations on the production
Ch. 1: Production and Supply
29
function. Judging by the trend in the literature, the estimates of such functions, the most popular being the translog function, were not satisfying, and therefore a rescue was sought in the form of profit or cost functions. By this shift, the factor shares become functions of prices rather than of quantities. This shift is somewhat arbitrary in that it is not backed by any justification. We should note that the basic idea of duality is that each point on the production function corresponds uniquely to a vector of price ratios. The converse does not hold in general unless a strong assumption on the nature of the production function is imposed. Once this is imposed, then variations in prices cause, and therefore reflect, variations in quantities. This exhausts their information about technology. Hence, if regressing the shares on quantities was not satisfactory, why should prices do a better job? A plausible possibility is that the price variations cause not only movements along a given production function but also movements across production functions. This possibility is not part of the literature, but it is part of the more general framework of our discussion. Under duality, the technology is summarized by profit, cost, or revenue functions, referred to as dual functions. The profit function is expressed in terms of factor and product prices, the cost function is expressed in terms of the factor prices and output, and the revenue function is expressed in terms of the product prices and inputs. In time-series analysis, each of these functions includes a measure of changes in technology, usually time trend. Also, the profit or cost functions are allowed to include some fixed inputs and thus are qualified as restricted or short run. Similarly, the revenue or profit functions can be restricted by the inclusion of a constraint on output (that is, a production quota). Duality theory became a standard subject in economic analysis in the late 1960s. 26 It was adopted for empirical applications with some great hopes, but as with many innovations, the test of time has been less generous. There were several reasons for such hopes. For competitive firms, prices, unlike quantities, are exogenous and therefore when used as explanatory variables do not cause simultaneous-equations bias that is part of life in the primal estimation. This property is indeed valid but with a limited liability. First, it is not automatically applicable to data at the market or industry level. Second, it is unnecessary to estimate a dual function in order to utilize the exogeneity of prices, when this is indeed the case. More profoundly, the econometric literature was initially motivated by the ease that duality offers to characterize the production structure. 27 Interestingly, this view paves
26 See [McFadden (1978, p. 5) and Jorgenson (1986)] for a brief review of the history of duality. 27 "An alternative approach to production theory is to start directly from observed economic data-suppfies, demands, prices, costs, and profits. The advantage of such an attack is that the theory can be formulated in terms of causal economic relationships that are presumed [italics by YM] to hold, without intervening consmactive steps required on the traditional theory. Because this approach is not bound by computational tractability in the step from production technology to economic observations, the prospect is opened for more satisfactory models of complex production problems" [Fuss and McFadden (1978, p. vii)]. Similarly "[d]emand and supply can be generated as explicit functions of relative prices without imposing the arbitrary constraints on production patterns required in the traditional methodology" [Jorgenson (1986, p. 1843)].
30
Y. Mundlak
the way to avoid duality rather than to use it. Heuristically speaking, duality means that by following some rules (optimization), one can move from a production function to dual functions (or behavioral functions, namely product supply and factor demand) and return to the original function. 28 Thus knowing the production function, it is possible to move to the behavioral functions and vice versa. This is a simple journey under selfduality when both the technology and the dual functions have closed-form expressions. Examples are the Cobb-Douglas or the CES functions. The problem arises when selfduality does not exist, as is the case with the more complicated functional forms such as the quadratic functions. However, the move to duality in this case shifts the weight from one foot to the other in that it makes the derivation of the behavioral functions direct, but ignores the fact that questions asked about the production function itself require the exact indirect computations that were to be avoided by moving to the dual functions. 29 For instance, given the profit, or cost, function, what is the marginal productivity of an input, and how is it affected by the input ratios? The answer to the first question is simple because by construction the competitive conditions are imposed, and therefore the marginal productivity is equal to the real factor price. The dependence of the marginal productivity on the other inputs is a question that has only a complicated answer, except when the function is self-dual. The empirical (econometric) literature on duality does not ask these questions. Thus it appears that duality is just a name, and the property is not fully exploited in the sense that the estimated behavioral functions are not used to answer questions related to relationships between inputs and outputs. However, the progress made in the ease of obtaining numerical solutions makes it possible to move from one system to the other; therefore this should cease to be an important consideration. The choice of whether to estimate a primal or a dual function should then be made on the basis of other criteria, such as statistical precision, and as argued in [Mundlak (1996a)] the dual approach to the study of the production structure is generally inferior to the direct approach. In this section we review a sample of the empirical work related to agriculture. 3° The combination of duality and the use of quadratic functions has extended the analysis to cover topics related to the properties of the production structure and comparative statics that, with some exceptions, 3J had not been part of the agenda of most studies at the time and thereby extended the area of inquiry. Of particular interest is the attempt to fit production systems that are consistent with the assumptions of comparative statics.
For a formal discussion, see [Diewert (1974)]. 29 It is therefore not surprising that a recent survey of duality contributions in production economicschooses to devote "[p]rimaryattention ... to alternative ways of measuring output supply and input demand functions rather than identifying the production function" [Shumway(1995, p. 179)]. The fact is that there is little to survey on the other subjects. 30 Shumway (1995) provides references to additional works. The survey by Jorgenson (1986) covers applications in other sectors. 31 For instance, Mundlak (1964b) uses the second order conditions of optimization to rule out the CobbDouglas function as a legitimate multi-product function. 28
Ch. 1: Production and Supply
31
But this is done at the cost of ignoring the subjects covered in the eleven observations made above (with the exception of 0.7 and 0.8). To fully describe all the properties of comparative statics, the single-output function with m inputs, or the corresponding dual function, should have at least (m + 1)(m + 2)/2 parameters [Hanoch (1975)]. A quadratic function that maintains the symmetry conditions has exactly this many parameters, and as such it is considered flexible in the sense that it can provide a second order approximation to the unknown true production function. 32 But since inputs tend to move together, it is statistically difficult to estimate the function directly with precision, and therefore the procedure has been to fit factor shares to the data. It is in this respect that such procedures are basically an extension of the factor share estimator. For the dual functions to describe a production system consistent with comparative statics, they have to maintain some properties that can be tested empirically. The less trivial ones are monotonicity and convexity (or concavity, as the case may be). When the estimation is of factor demand or product supply, the monotonicity imposes signs on the first derivatives of the dual functions, whereas convexity imposes conditions on the second derivatives of the dual functions, or more to the point on the sign of the Hessian matrix. If these conditions are not met, the system is inconsistent with profit maximization. Besides these regularity properties, the dual form is used to test various hypotheses about the production structure such as separability, homotheticity, and the form of technical change. A major shortcoming of the approach is the difficulty in achieving the regularity conditions in empirical analysis, s3 Although duality is a micro theory, man,r of the studies use macro data. The studies vary in functional forms used, in the type o1 function used in the estimation, and in the questions asked. We will try to give the flavor of these studies by sampling some that are most oriented to our needs.
32 The parameters in question are first and second order derivatives. Their value is likely to depend on the input and output combination and thus differ with the observations. Consequently, in the event of wide variations in the sample, an approximation by a fixed coefficient function may be erroneous. 33 In a survey of studies of US agricultural productivity, based mostly on duality, it was observed that "... empirical results and theoretical consistency are sensitive to model specification . . . . Many researchers found the translog to be ill-behaved over portions of the data set, that is, monotonicity and curvature properties hold only locally [Caves and Christensen (1980)]. This was also evident in many of the models presented in this chapter. . . . not all the econometric models satisfied locally the monotonicity conditions and the curvature conditions" [Capalbo (1988, p. 184)]. And in another review: "The review exposed some of the limitations of existing research. For example, it is not clear what should be done with empirical models that violate theoretical properties" [Capalbo and Vo (1988, p. 124)]. More recently, "... as most students of the existing empirical literature on agricultural supply response systems know, failure to satisfy convexity in estimated profit functions is not unique to this study" [Chambers and Pope (1994, p. 110)]. For additional supportive evidence, see also [Fox and Kivanda (1994) and Shumway (1995)]. This result had been anticipated: "Some expansions, such as the translog function ... can never except in trivial cases satisfy monotonicity or convexity conditions over the entire positive orthant" [Fuss et al. (1978, p. 234)]. This reservation is related to the functional form. However, this is not all: the major difficulty comes from the fact that the implemented technology is not constant over the sample.
Y.Mundlak
32
Early application of duality to the study of agricultural production was made by Lau and Yotopoulos (1972) and Yotopoulos, Lau, and Lin (1976). They used a CobbDouglas profit function. As Cobb-Douglas is a self-dual function, it was a straightforward matter to obtain from the profit function estimates of the production function elasticities and to compare them with direct estimates of the same parameters. This comparison reveals some substantive differences. Unfortunately, such a numerical comparison of the dual and the primal estimates had no follow-up and has practically vanished from empirical analysis.
2.1. Studies based on cost functions Define the restricted cost function
C(w, k, y, t) = m~n[wv; y = F(v, k, t)],
(17)
where v is a vector of unrestricted (variable) inputs with prices denoted by w, k is a vector of constrained inputs which are assumed to have no alternative cost, y is a vector of outputs, and t is a technology index. By the envelope theorem (Shephard's Lemma)
OlnC(w, k, y, t) =-Sj(w,k,y,t). 0 In Wj
(18)
Various restrictions are imposed in empirical analysis; many of the studies assume that all inputs are unrestricted, in which case k is not part of the argument. In what follows, to simplify the notation we will use this assumption unless indicated otherwise. The empirical results depend on the structure imposed on the function. Several properties are of interest: Homotheticity:
C(w,y,t)=g~(y)C(w,t);
Hence, S j ( w , y , t ) = S j ( w , t ) .
(19)
Hence, S j ( w , y , t ) = S j ( w , y ) .
(20)
Neutral technical change:
C(w,y,t)=A(t)C(w,y); Homotheticity and neutrality:
Sj(w, y, t) = Sj(w).
(21)
The cost function is expressed as a quadratic function in the variables or as a monotonic transformation of the variables, most commonly logarithmic, yielding the translog function. The share equations are then linear in the same variables. Unless indicated otherwise, the technology is represented by a time trend. The empirical analysis deals
Ch. 1:
Production and Supply
33
with the estimation of the factor share equation under one of the above restrictions, often not tested empirically. There is no single central issue in these studies: different studies emphasize different topics. The most important ones are related to the behavior of factor shares with respect to changes in factor prices, the trend in the shares (time as an index of technology), and the effect of output when homotheticity is not assumed. Some studies emphasize methodological aspects by testing the properties of the function needed to describe a production system consistent with comparative statics. Binswanger (1974) estimates a translog homothetic cost function from a cross-state data set for the US for the period 1949-1964. Agriculture is assumed to be a pricetaker in all inputs, including land. He compares factor demand elasticities (evaluated at the mean) with those derived under the constraint of Cobb-Douglas. Except for land, the elasticities are near 1. They are close to the Cobb-Douglas-based elasticities for machinery and fertilizer but much lower for land ( - 0 . 3 4 as compared to -0.85). This result can be attributed to the fact that the model assumes a perfectly elastic supply of land, but this is not the case in reality, and the estimates reflect the data that were generated by a fairly inelastic land supply. The cross-price derivatives of the cost function provide a measure of substitution. It is found that "[t]he best substitutes are land for fertilizer... It was a surprise.., to find that machinery is a better substitute for land than for labor" [Binswanger (1974, p. 384)]. To explain the result, note that in general shocks, and specifically technical shocks, are both land-expanding and land-augmenting [Mundlak (1997)]. Technical change in agriculture caused a decline in the product price and thereby suppressed its expansion effect, so that under the new technology less land was needed to produce the demanded output. The new techniques were more fertilizer-intensive and machine-intensive, resulting in the positive association between machines and fertilizers and the negative association of these two variables with land demand. The technical change is labor-saving and machine-using; the labor share declined at the average annual rate of 5.5 percent, and that of machines increased at the rate of 2.5 percent. Regional dummies were significantly different from zero. The inclusion of regional dummies qualifies the estimates as within-region estimates. The fact that they are significantly different from zero indicates differences in regional productivity and that the explanatory variables need not be exogenous. Ray (1982) uses a translog cost function with two outputs, livestock and crops, in estimating the technology of US agriculture in 1939-1977. He imposes Hicks-neutral technical change and finds decreasing returns to scale for aggregate output, indicating that technology is nonhomothetic. The reason for the decreasing returns can be attributed to the fact that not all the inputs are included in the analysis, and thus, the estimates are of a short-run cost function. The average annual rate of the technical change is 1.8 percent. The own demand elasticities are less than 1. The substitution of hired labor for machines is much smaller than that between labor and fertilizers. Also, Ray finds substitution between labor and fertilizer, in contrast to Binswanger (1974), who claims complementarity.
34
Y. Mundlak
Kako (1978) uses a translog cost function to study rice production in Japan in 19531970. Constant returns to scale is imposed, and technical change is measured by time trend with different slopes for three subperiods. The average percentage change in factor use during the period was: labor 2.6, machinery 3.9, fertilizers 4.4; the rice area did not change. Output grew at the rate of 2.7 percent. The input changes are decomposed to output effect, substitution (or price) effect, and technical change. The technical change was dominating for labor, whereas the output effect dominated the changes in fertilizers and machinery. Thus technical change was largely labor saving but had little effect on the other inputs. What picture does this finding portray of rice production? If the rice area did not change, it is not clear what changes in output could prompt an increase in machines. Perhaps part of the answer is related to the calculation of technical change. It is reported that 56 percent of the increase in output is attributed to technical change; thus, indirectly the use of machines is affected by technical change. We can think about these changes in terms of changes in the composition of techniques which became laborsaving and machine- and fertilizer-using. Finally, the fact that land did not change during the period is consistent with the view that land supply is far from being perfectly elastic as implicitly assumed in the formulation. As such, the results are likely to be distorted. Kuroda (1987) estimates a translog cost function using national averages data for Japan for the period 1952-1982 and concludes that "... the production process of postwar Japanese agriculture was characterized neither by Hicks neutrality nor homotheticity. Biases ... reduced labor relative to other factor inputs ..." (p. 335). Lopez (1980) used a generalized Leontief cost function to study the structure of production of Canadian agriculture in 1946-1977. The paper emphasizes two subjects, tests for integrability and for homotheticity. A necessary condition for integrability is symmetry of the price coefficients in the derived demand equations. Integrability is not rejected, and it is concluded that there is a production function that can represent Canadian agriculture. The idea is that the cost function can be derived from this production function. This is the idea of duality, but things are not that simple. Below we question the validity of the assumption that market prices used in an analysis of macro data are exogenous and maintain the requirements underlying the derivation of a cost function. If the assumption is violated, the estimated coefficients of the cost function would be biased. Given that the integrability conditions are met, the fitted function may be integrated to an aggregate technology, but this is not the relevant one for Canadian agriculture. 34 By way of analogy, a negatively slopped line fitted to price-quantity data need not represent a demand, or supply, function, and it may be a combination of supply and demand functions. The factor demand equations include output and time trend. The output coefficients are significantly different from zero, indicating nonhomotheticity. The time coefficients were not significantly different from zero except for labor. This indicates neutral technical change with respect to all inputs except for labor. However, when homotheticity was
34 On this issue see [Mundlakand Volcani(1973)].
Ch. 1: Productionand Supply
35
imposed, the time coefficients became significantly different from zero, and the signs were consistent with factor-augmenting technical change. This is another illustration of the tradeoff between the inclusion of output and time trend in the equations. We discuss this finding below, The own-factor-demand elasticities are less than 1, cross-elasticities are all positive. Labor is a substitute for all inputs except for land. Clark and Youngblood (1992) estimate a translog cost function for central Canadian agriculture (Ontario and Quebec) for 1935-1985 using a time-series approach instead of including a time trend as a technical change measure. They concur with Lopez (1980) that technical change is neutral but output is an important variable in the shares of land and fertilizers. 2.2. What is the message? 35
Factor shares in agriculture have undergone changes over time; particularly, the share of labor declined, that of machinery and purchased inputs increased. How much of these changes can be attributed to economic factors? The studies reviewed above indicate that some of these changes were associated with changes in factor prices. Still, the major part of the changes is attributed to changes in output or reflects the time trend. There is a tradeoff between the role of homotheticity and neutrality of the technical change. W h e n output was included in the equation, it tended to replace the role of the time variable. 36 This result is consistent with the fact that the new techniques are more productive and use different factor ratios than the old techniques. Two conceptual limitations to the empirical analysis of cost functions may distort the results. First, the cost function is derived for a price-taker agent and as such does not apply to macro data where prices are determined by market supply and demand. The factor demand is derived from the cost function, and therefore it is affected by shocks affecting the cost function. These shocks are thereby translated to the factor prices. In short, factor prices need not be exogenous. This limitation applies to all studies that use market data - rather than firm data - including studies based on profit functions. This is not a trivial point because agriculture cannot be assumed to be a price-taker in the rural labor and capital markets, and definitely not in the land market. Second, a cost function is derived conditional on output, and this is interpreted erroneously in empirical analysis to mean that output is exogenous. In general, there is no
35 Issues related to the choice of functional form are discussedby Chalfant (1984). He argues that the translog and the Generalized Leontief cost functions are less appropriate for modeling agricultural production since they do not result in negative own-demand elasticities of substitution for all inputs. However, the estimates resulting from the use of the Fourier flexible form also failed to satisfy the negative own elasticities for all of the factors (p. 119). Lopez (1985a) discusses similar issues for profit functions. 36 This is also consistent with the conclusion of a survey by Capalbo (1988, pp. 184-185): "Nonhomothetic functions performed better than models that maintained neutral technical change or constant returns to scale, or both". Wide variations were obtained in the level and bias of technical change, although all the reported results indicate that the technical change was labor-saving and chemical and equipment-using, whereas the results with respect to land are ambiguous.
36
Y.Mundlak
reason to believe that the marginal cost, and therefore output, is independent of shocks to the cost function. 37 This problem is not shared by profit functions. 2.3. Studies based on profit functions The profit function provides a compact form to summarize a multiproduct technology and an efficient way to introduce the properties imposed by theory on this system. This possibility is utilized in the empirical analysis, and thus there is no direct comparison with results obtained from the cost function with a single aggregate output. Also, the profit function facilitates the examination of whether the technology is that of joint production [Chambers and Just (1989)1. The restricted profit function of an individual producer is defined by (22)
~ ( p , w, k, T) = m a x ( p y - w v : y , x c T ) , y,v
where y is a vector of outputs; x is a vector of J inputs decomposed to variable, v, and fixed, k, components: x = (v, k) with dimensions (,Iv, Jk), Jv + Jk = J; T is the available technology set; p is the vector of product prices; and w is the vector of factor prices. It can be decomposed to conform to the decomposition of x. However, where ambiguity does not exist, such a decomposition is not made explicit. By the envelope theorem (Hotelling's Lemma) the product supply and factor demand functions are written: 07r Yi (p, to, k, T) -- Opi'
vj (p, w, k, T) =
0re o'~wj"
(23)
The equations in (23) can be expressed also as shares. Like the cost function, the profit function is expressed as a quadratic function of a monotonic transformation of the variables. Then, Equations (23) become linear in the same variables. Lopez (1984) estimates a Generalized Leontief profit function for Canadian agriculture, using 1971 cross-section data. The Hessian matrix (the matrix of the second partial derivatives of Yi and v j) evaluated at the sample points has mostly the wrong sign, indicating that the profit function is not everywhere convex. The elasticities are generally low, particularly for supply (0.01 for crops and 0.472 for animal products). There is a gap between the variables used in the analysis and those assumed in the theoretical model. The paper suggests that there is sufficient variability across regions for a meaningful analysis, but this variability is in part spurious, reflecting quality variations; thus it is likely that the results reflect data problems. Antle (1984) uses a single product translog profit function to estimate input demand and output supply functions for US agriculture for 1910-1978. Technical change is 37 An exception in nonagriculture is the interesting study by Nerlove (1963) of the power-generatingplants where the output is demand-drivenand as such is exogenous.
Ch. 1: Production and Supply
37
represented by time trend and time dummies for subperiods. 38 The findings lead to the acceptance of symmetry, convexity, and structural change in the postwar period and to the rejection of homotheticity, parameter stability, and neutral technical change. Also, he finds differences in the direction of the technology bias between the pre and postwar periods. 39 Scale effects are very important post-war and are not important pre-war. "It shows that changes in factor use were more a function of technical change and a scale change in the postwar period than in the prewar period. Thus, input use in the postwar period was apparently less price responsive over time than in the pre-war period" [Antle (1984, p. 418)]. This conclusion is consistent with the world of heterogeneous technology as discussed above. The low price elasticities are claimed to be consistent with those reported by Shumway (1983) and Weaver (1983) and as such are considered to be acceptable. This result is also consistent with many other studies of supply response reporting low supply elasticity. In our discussion of the subject at a later stage, the low elasticity is attributed to inelastic factor supply. Antle (1984) also suggests that his results are in line with induced innovations. 4° However, his argumentation indicates that the pace of the technical change was related to the implementation rather than to the pace of changes in the available technology itself. Shumway and Alexander (1988) fit a system of five outputs and four inputs to US regional data for the period 1951-1982. They had to impose price linear-homogeneity, symmetry, and convexity. 41 It is indicated that the great variability of the results "... clearly document the importance of considering regional differences in predicting the distributional effects of potential changes in economic conditions ..." (p. 160). Technical change was not Hicks-neutral. The own-price-demand elasticities varied from 0 to -1.42, and output elasticities varied from 0.01 to 1.22, with great variations across regions. Shumway, Saez, and Gottret (1988) estimated a quadratic profit function with five output groups and four input groups for the US for the period 1951-1982. Land and family labor are fixed; time trend represents technology. As in the previous study, symmetry, linear homogeneity, and convexity in prices had to be imposed. Estimates were obtained for regional data under the assumption that regional prices are exogenous, and for national data where the variable-factor prices were endogenized. The regional estimates are aggregated and compared with the national estimates. The output-supply and
38 "Without time dummy variables, very small D-W statistics were obtained, suggesting misspecification" [Antle (1984, p. 417)]. 39 "The prewar is biased toward labor and mechanical technology and against land, whereas the postwar technology is biased againstlabor and towardmachineryand chemicals" [Antle (1984, p. 420)]. 40 "Actual on-farmtechnology, therefore, lagged behind agricultural research, and estimates of the prewar technology should not be expectedto show much evidence of technical change bias toward mechanical or chemical technology" [Antle (1984, p. 420)]. 41 "Convexityof the profit function was not maintained in the model exploration phase" [Shumway and Alexander (1988, p. 155)].
38
Y. Mundlak
input-demand elasticities are low and become even lower when upward-slopping supply curves for the variable inputs were introduced. The low response is attributed to fixity of land and family labor. Additional support for the proposition that techniques, outputs, and inputs are determined jointly is obtained from the fact that important properties of a production function are not maintained under aggregation over techniques: "A larger number of US parameters are significant when derived from the regional estimates (53 percent) than when directly estimated (42 percent)" [Shumway et al. (1988, p. 334)]. 42 More important, "[s]ymmetry of price parameters in the system of Equations (1) and (2) was not preserved in the national aggregation" (p. 334, footnote 2). The findings also support the proposition that shocks affect land expansion and land augmentation in the same direction: "All five outputs increase as the quantity of real estates services increase . . . . All variable inputs are complements to real estates. Half are complements to family labor, and a third are complements to other variable inputs" (p. 334). Huffman and Evenson (1989) fit a normalized quadratic restricted profit function with six outputs and three variable inputs to data for US cash grain farms during 1949-1974. They expand on previous duality-based studies by allowing the shares to depend on agricultural research, extension, and farmers' schooling in addition to time. The partial effect of research is in the direction of fertilizer-using and labor- and machine-saving. As research was machine-saving, the observed increased use of machines is attributed to declining prices. There is asymmetry in the explanation of the increased use of machines and the decline in the use of labor. This can be resolved by assuming that the change has been facilitated by a decline in the cost of machines and that the new machines require less labor than the old machines. This explanation is consistent with the heterogeneous technology framework. The effect of extension was small. The shadow value of private crop research is near zero, but it is high for public research. The own-price elasticities at the sample means are: fertilizer -1.2, fuel -0.72, machinery -0.61, labor -0.51, soybean 1.3, wheat 0.97, and feed grains 0.016. Bouchet, Orden, and Norton (1989) fit a normalized quadratic profit function to data for French agriculture in 1959-1984. This was a period of strong growth, mainly in cereals, a decline in labor, and an increase in labor cost. The analysis differentiates between short- and long-run response. The supply is price responsive, but the elasticities are below 1. "However, the response to price changes are estimated to be inelastic even in the long run when usage of quasi-fixed capital and family labor have fully adjusted to optimal levels" (p. 292). The estimates of the long-run response are obtained under the implicit assumption of perfectly elastic supply of quasi-fixed inputs. When in reality the supply functions were not perfectly elastic, the estimated responses are biased downward. 42 The standard errors for the aggregated coefficients were obtained under the assumption of independence of the regional estimates and as such are an approximation. National shocks affect all regions, and therefore their coefficients are jointly affected and thereby correlated. This may be the reason for the difference in significance levels.
Ch. l:
Production and Supply
39
The findings show that both family labor and capital have a strong positive effect on the supply of cereals, milk, and animal products. This result raises two puzzles. First, cereals is not a labor-intensive product, and therefore it is not obvious why it should have a strong positive response to changes in family labor. Second, one would expect an opposite effect of labor and capital. This similarity of effects can be explained by a strong expansion effect that dominates the substitution effect. The expansion effect is prompted by the technical change that accounts for the observed growth. Putting it all together, the observed changes can be accounted for in terms of changes in the composition of techniques. Ball et al. (1993a) use restricted and unrestricted profit functions to evaluate the consequences of the Common Agricultural Policy (CAP). The main empirical result is that the response elasticities are low but in line with values that appear in the literature using other functional forms and less demanding models. Land and labor are taken as fixed in the evaluation, and this is the reason for obtaining low response elasticities. 2.4. D u a l e s t i m a t e s - s u m m a r y
In summarizing the foregoing findings it has to be kept in mind that the reviewed studies are mostly for the US, Canada, and Japan, so the numerical values may not be fully representative. However, the main developments in the agriculture of these countries are shared by other countries. The post-war period is characterized by a strong technical change in agriculture, both in the level and in the direction of factor use. Yields increased together with improved varieties and the use of chemicals, while labor was replaced by machines. Thus, the results have broad implications, and they facilitate the drawing of important methodological conclusions. What distinguishes the dual approach from the primal is the appearance of prices in the empirical equation. Hence, in evaluating the performance of this approach we address the following questions: • What has been the contribution of prices to the empirical equation? • What additional information is obtained from the dual equations, and how can they be interpreted? • Are the underlying assumptions of duality met? • What are the statistical benefits of this approach? • Where do we go from here? The dual estimates are obtained by regressing factor shares on prices, time trend, and sometimes output. When the change in the use of inputs is decomposed to price, trend (a proxy for technology), and output effects, it is found that trend and output capture most of the changes, whereas the role of prices is the least important. Thus the contribution of prices to the explanation of inputs or output variations is rather limited. The price elasticities of factor demand and product supply are usually obtained under the assumption that producers are price-takers in the product and factor markets. On the whole, the own-price elasticities are less than 1. There is no uniformity in the signs of the cross elasticities, but in general, most inputs appear to be substitutes. The strength of the own and cross elasticities reflects in part the fact that in reality factors' supply is not
40
Y Mundlak
perfectly elastic as the models assume, and therefore the results need not represent the demand-driven substitution as it is thought. This is the case with respect to elasticities related to labor, land, and capital. We further elaborate on this subject below. With respect to other findings, interestingly, on the whole the studies based on duality do not show increasing returns to scale. Technical change, obtained by including a time trend in regressions of factor shares, is largely labor-saving, capital-using, and fertilizerusing, with the results on land being somewhat ambiguous. This is reflective of the data, which means that whatever was the effect of prices, it was not sufficient to change conclusions that could be drawn from the raw data. This does not give a strong mark to the analysis in that the results are obvious without it. Duality between technology and prices holds under well-defined conditions that can be tested empirically. In most studies these underlying conditions are not fully met; particularly the concavity of the cost function or the convexity of the profit function is violated. Therefore, the estimated technology is inconsistent with the basic premises of the model. In a way, this is the most disappointing result because duality theory is a very powerful theory, and the question is why it does not come through in the empirical analysis. There may be more than one reason, but probably the most important one is related to the changes in technology. One of the expected virtues of duality has been related to its solution of the simultaneous-equations bias realized in some primal estimators. However, as indicated above, in general dual estimators are inferior to primal estimators on the grounds of statistical efficiency. Where do we go from here? We return to this question at the end of the paper.
3. Multiproduct production Most of the primal studies of production use a measure of a single output, value output, even though output consists of more than one product. The outcome is a truncated picture of the technology and limits its usefulness. Estimates based on input data aggregated over products are not sufficiently informative in that they do not provide a simple way to address questions of interest such as: What is the factor productivity in the production of a particular product? Does such productivity depend on the level of output of the other products, and if it does, is it because of overall input constraint or because of technological interdependence? Also, without a complete presentation of the multiproduct production function, it is impossible to derive the supply of the individual products. It is not due to unawareness of the importance of the complete presentation but rather due to lack of data and complexity of specification and estimation. The situation has improved considerably with the appearance of the dual approach. As the foregoing review indicates, many of the empirical studies based on the profit function facilitate the derivation of the behavioral functions, specifically product supply, without having to resort to the primal function. The data problem is a reflection of the fact that industry statistics for agriculture do not report the inputs by products, except for land and some product-specific inputs such
Ch. 1: Productionand Supply
41
as livestock. This is a convention, and by itself it reveals nothing about the nature of the production process. In principle, micro data collected from farm surveys can alleviate the problem. This is at least the case with respect to inputs which are easy to allocate to the various products, such as feeds or fertilizers, but the allocation of the use of fixed inputs requires more effort, and therefore such data are relatively scarce and do not surface with high frequency in reported studies to clarify some of the underlying issues discussed in this section. Most farms produce more than one product, and this raises the question of the reason for the diversification. Possible reasons are: (1) Interdependence in production where the marginal productivity of a factor of production in the production of one product depends on the level of production of another product, for example, wool and mutton, or milk and beef on dairy farms. (2) Better utilization of some fixed inputs, or alternatively due to production quotas on some outputs, which frees resources to produce other products [Moschini (1988)1. (3) Savings due to vertical integration, where the farm produces intermediate inputs which are consumed on the farm, such as corn and hogs, or hay and livestock. Such integration saves marketing charges in the broad sense (transportation, trade margins, spoilage, etc.). (4) Risk management. To sort out the reasons for the diversification of production we need to go beyond the output-aggregate production function. To put some structure to the discussion, let T ( y , x) denote the production set which contains all the feasible combinations of the vectors of outputs (y) and inputs (x). This set is contained in the nonnegative orthant, it is closed, convex, contains free disposals, and the origin. Its efficiency frontier, t(y, x) = 0, is unique. Studies with aggregate value output take the form py = f ( x ) , where py is the inner product of p and y. This is a special case of the more general presentation obtained by imposing separability on t(y, x): t(y, x) = Y ( y ) - X ( x ) = 0 [Mundlak (1964b)]. Hall (1973) shows that this imposition is equivalent to a multiplicative decomposition of the cost function, C(w, y) = H ( y ) c ( w ) . The general presentation of output by Y ( y ) has two advantages over the more restricted single aggregate output presentation: First, the function with aggregate value output is not a single-valued function and its parameters depend on the output composition along the expansion path [Mundlak (1963b)], whereas Y ( y ) can be formulated to overcome this shortcoming. Second, it allows for interdependence in production. An application of this approach to the output aggregation of Israeli agriculture using a multi-stage CES function was made by Mundlak and Razin (1971). The limitation of this type of separability is that it is applicable only when the technology is interdependent, and the derived ratio of output prices is independent of the ratio of factor prices [Hall (1973)]. The latter, to be sure, applies also to the aggregate single-product production function. Most agricultural production is thought to be carried out by independent techniques for individual products. In this case, the profit or the cost functions will be additive
Y.Mundlak
42
and the supply of product j will be independent of the price of product h [Hall (1973), Lau (1978)]. We can write these functions as follows: C(w, y) = ~ j Cj (to, y j), where C(w, y) is the minimum cost of producing the output vector y at factor prices w, and similarly, Cj (w, y j) is the minimum cost of producing output yj. A similar result applies for the profit function: re(p, w) = ~ j 7rj (p j, w). This additivity constitutes only a sufficient condition for independent production. As Shumway, Pope and Nash (1984) indicated, common constraints imposed on production may produce nonzero cross price coefficients in supply. To show this, we note that the problem under consideration is a special case of the heterogeneous technology discussed above, where the techniques are identified with the products and as such are explicit. Repeating that discussion with more details, the maximization problem is:
J
J
J
subject to Fj(.) c T; vj ~>0; kj >~0. Let Fxj be the vector of marginal productivity of x in the production of product j. The Kuhn-Tucker necessary conditions for a solution are (pj F~j - w)v~ = O,
pjFvj - w ~ O,
( P j Fki -- Z ) k j = 0,
p j F k j - ) ~ /piy for all y 6 Y. If this holds for all the observed netputs, then it is said that the production set Y p-rationalizes the data. Then piyi >/piyj for all i, j = 1 . . . . . n, where n is the sample size. Varian (1984) shows that this condition guarantees the existence of a closed, convex, negative monotonic production set and referred to it as the Weak Axiom of Profit Maximization (WAPM). B ar-Shira and Finkelshtain (1999) further extend the analysis. The underlying assumption is empirical in nature, and its validity can be tested by comparing all possible inner products between the observed netputs and prices [Fawson and Shumway (1988)]. If a netput is chosen, it should be optimal under the price regime prevailing at the time. A situation which is inconsistent with the hypothesis is when a netput is chosen even though it seems to be inferior to another netput under its own price regime: pJyJ < pjyi and piyj < piyi. This raises the question of why yJ was chosen in the first place when it was inferior to yi under pJ. The negative answer is that there was a violation of profit maximization. The positive one is technical change, so that when yJ was chosen, yi was not feasible. As technology progresses with time, we expect more recent observations to represent more productive technologies than did earlier observations. Consequently, in time series analysis, when t > 0, we expect pOyt _ pOyO > 0, or equivalently, Lq = pOf/pOyO > 1 where Lq is the Laspeyres quantity index. If this is not the case, then the conclusion is that this binary comparison is inconsistent with profit maximization. Fawson and Shumway (1988) apply the test to regional data of US agriculture and find that the majority (typically, 80-90 percent) of the observations would be inconsistent with profit maximization if technical change were not allowed for. Featherstone, Moghnieh, and Goodwin (1995) apply the test to micro data of Kansas farms. The conditions of profit maximization, or of cost minimization, were violated by a large proportion of the observations. The number of violations declined when technical change was allowed for, but was still sizable. When a particular netput is more profitable than another one under the two pertinent price regimes, it is concluded that it comes from a more productive technology. Based on this concept, Bar-Shira and Finkelshtain (1999) rank the technologies and apply their framework to data on US agriculture. They show that the ranking of the technologies does not always follow the chronological order, namely in some years the rank is lower than that of previous years. As no one suggests that there has been a regression in the technology of US agriculture, this finding can either be attributed to a violation of profit maximization or it may arise from more fundamental difficulties in identifying the technology through prices, an issue on which we elaborate in the discussion below. Bar-Shira and Finkelshtain quantify the technical change by computing the revenue per dollar expenses at constant prices. This is an index of change in the output-input ratio, and it is reminiscent of the early work on productivity at NBER and Schultz's (1953) discussion of productivity in agriculture. This then brings us back to square one. Finally, they examine whether the technical change is biased. Chavas and Cox (1988, 1994) go further in discussing procedures for inferring the nature of the technical change by ex-
Ch. 1: Production and Supply
45
amining what changes in the components of the netputs should be made in order to induce equality of the profits of the two netputs evaluated in terms of the base prices, or simply to bring the Lq to 1. The procedure is discussed and modified by Chalfant and Zhang (1997). The literature deals with some more specific topics, such as separability of the technology and returns to scale. Finally, the tests discussed above are deterministic in the sense that they classify the data by those observations that are consistent with the hypothesis and those that are not. This does not take into account the possibility of errors in the data. Statistical tests have been suggested to deal with such errors. We do not cover these topics here, and we now move on to an evaluation of the method and its application. 4.2. Discussion Under the conditions of WAPM, there exists a production set with the underlying properties needed for the production theory. Therefore, the central issue of the nonparametric analysis is to check for the empirical validity of WAPM. Note that this involves asking the same important question that was initially raised by Cobb and Douglas (1928) on the empirical validity of the competitive conditions and which received attention in the early work on the primal production function. However, as the empirical studies show, the conditions of WAPM are typically not met unless technical change is allowed for; but, to allow for technical change, the assumption that all the observations are optimal is used. At this point the common domain with the work on the primal function vanishes, and the approach becomes more similar to that of the dual function, where the optimality is imposed and not tested. This is to say that the technology is identified by the prices. Allowing for technical change amounts to making productivity statements based on output and input indexes. It is well known that such measures are subject to the indexnumber bias caused by the inability to make full allowance for the substitution triggered by changes in relative prices. Thus, the method shares the problems as well as the merits of productivity measures through the use of index numbers. It is important to note that such measures cannot differentiate between neutral and differential technical change. To show this in a simple setting, assume a cost function C ( w, A, y) = C ( Wl / A1 . . . . . tom/Am, y) where the A's are the factor-augmenting functions. Without a loss in generality, we will examine the case of a linear homogeneous production function. Also, assume A} 7> 1 for all j and t. Let A] = mini {A~} for all t, recall (19) and (20), and rewrite C(w, A, y) = y a l c ( a w ) ; al = 1/A1, aj = A l I A j, j > 1. Thus, al can be thought of as the Hicks-Neutral coefficient. Evaluate the technical change as follows, for t > 0: C ( w O, A O, yO)/yO
a 0 c(aOw O)
C ( w t, A t, y t ) / y t
a~ c(atw t) "
We write more compactly C ( w t, A t, yt) = C(t), c(a t, w t) =--c(t).
46
Y Mundlak
We now evaluate this ratio for neutral and for differential technical change. We do it under constant prices, w e = w ° = w, and for a given output, yt = yO, so that the technical change is evaluated by the savings in inputs needed to produce a given output. The inputs considered come from the input requirement set: x t E V ( y , t). Hicks Neutral Technical Change (HNTC): Let 1 = A ° < A], a jt = l f o r a l l j > l a n d all t, hence V (y, O) c_ V (y, t), C ( t ) = w x t, w x t < w x °. Imposing these conditions, we get c(t) = c ( w ) , and C(O) wx ° C ( t ) - w x t - - A ~ > I"
Thus the rate of factor saving is equal to the rate of the HNTC. Factor Augmenting Technical Change (FATC): Let A] = 1 for all t, a jt 1 and all t, with the inequality in effect for at least one j, hence y0 < yt and V ( y , O) c_ V ( y , t). Impose yt = yO and aj0 = 1, then, w x t < w x °, and the effect of the technical change under these conditions is C(O) C(t)
wx ° wx t
c(w) m > l . c(atw)
This measure is similar to that of HNTC, but it is due to FATC; it is therefore referred to as the Neutral Equivalent of Differential Technical Change (NEDTC) [Mundlak and Razin (1969)]. The conclusion is that the ratio w x ° / w x t is affected by neutral as well as by differential technical change, and therefore we cannot differentiate between them. The problems in the application of the nonparametric method are similar to those faced in the applications of duality. The theory is a micro theory, and therefore its application to macro data can distort the results. Prices are not exogenous, the supply of inputs is not perfectly elastic, and in the short run, which may last for some time, there are constraints to the convergence to long-run equilibrium. We return to this topic in the discussion on dynamics below. This raises the question of how to price durable inputs in the analysis, underlining the problem that arises from the fact that the econometrician does not necessarily know the prices, or price expectations, observed by the firm and thus may use the wrong prices. All these may lead to behavior which can be incorrectly interpreted as deviations from profit maximization. To see that this can create a problem, we note that Bar-Shira and Finkelshtain (1999, Figure 8) present a graph of the profits (the product of the netput and its price) in US agriculture for the period 1945-1994. It appears that from 1958 on, with the exceptions of three years, agriculture was operating at a loss, and at times, at a big loss. During this period, output continued to increase. Thus, this suggests that somehow these prices are not the relevant prices. All these problems occur within the traditional framework of homogeneous technology. If we allow for heterogeneous technology, additional considerations come up. First note that, by definition, the observed netputs represent the implemented technology, and as such the corresponding production sets are conditional on the state variables. As we
Ch. 1: Productionand Supply
47
move from one year to the next (or across farms for that matter), the state variables may change and with them, the implied production sets. Thus, it is possible to get a regression in productivity because of the change in the underlying economic environment, as indeed it is presented in Bar-Shira and Finkelshtain (1999, Figure 9).
5. Supply analysis 43 5.1. Background
Analytically, the supply function of the competitive firm is the partial derivative of the profit function with respect to the product price. As we have seen above, it is one of the functions estimated in using duality to characterize the production structure. However, it has been considered as an entity by itself. The reason can be attributed to substance and history. The interest in supply analysis in agriculture had begun long before the work on the production function in agriculture and was completely disconnected from it. From its very beginning, supply response analysis was very much concerned with policy issues rather than with the application or development of formal econometric analysis. This is revealed by the tires of some of the early work: "The Farmers' Response to Price" [Bean (1929)], "The Nature of Statistical Supply Curves" [Cassels (1933)], "The Maintenance of Agricultural Production During Depression: The Explanations Reviewed" [Galbraith and Black (1938)], "Can Price Allocate Resources in American Agriculture?" [Brewster and Parsons (1946)]. Some of this discussion was motivated by the fact that agricultural production did not contract during the Great Depression of the thirties when prices of agricultural products declined substantially. The explanation for this was provided by D. Gale Johnson (1950), who indicated that not only product prices decreased in the depression, but factor prices decreased as well. This brings in the cyclical behavior of agriculture. The central theme, the role of prices in determining output, has not changed much since. However, there are additional aspects high on the public agenda which are related to the ability to increase food supply to meet the growing demand. While the role of prices is related to the behavior under given supply conditions, the growth aspect is related to the shift in these conditions. This is a neat classification, which unfortunately does not apply to the data. Observations are determined by all the forces that affect supply, and it is therefore for the empirical analysis to sort out the role of the various factors. Empirical supply functions regress output on prices and other variables with the purpose of extracting the output response to price. Most of the studies used aggregate timeseries data, but there were some exceptions [Mundlak (1964a)]. On the whole, these studies were formulated within a static framework. As price signals do not come out
43 In part, the discussionis based on [Mundlak(1996b)].
48
Y. Mundlak
strong and loud in such studies, salvage is sought in using an appropriate price expectation and in a search for variables other than prices to be included in the equation. The shift of attention to dynamic considerations gained impetus with the introduction of distributed lags to the supply analysis by Nerlove (1956, 1958). Two basic ideas are behind the formulation: adaptive expectations and partial adjustment. They both have a common outcome, a gradual adjustment in response. This is applied to expectation formation whenever a gap exists between the expected and the actual values. Similarly, it is applied to the closure of the gap between the actual output and the long-run desired output. The basic empirical equation that emerges has the form of Yt = b p t + c y t - i + ut,
(24)
where b and b / ( 1 - c) are the coefficients of short- and long-run supply response respectively. This formulation gave a neat and simple format for supply analysis and was therefore widely adapted. A summary of many studies using this framework is provided by Askari and Cummings (1976). This efficient form for connecting the price response and the length of run has not provided the needed insight into the structure of agricultural production, nor of the origin and the nature of its dynamics [Mundlak (1966, 1967)]. In what follows we concentrate on approaches that attempt to overcome this limitation. As a background, we summarize the main empirical findings of supply analysis reported in the literature: O.12. The short-run aggregate agricultural supply elasticity, when estimated directly, falls in the range of 0.1-0.3. O. 13. The estimated elasticities decrease with the level of aggregation. Higher values are obtained for the elasticities of individual products than for the aggregate output. O. 14. Indirect estimation of the supply elasticity, obtained through the estimation of factor demand, resulted in larger values than those obtained by direct estimation. O. 15. In the empirical analysis it was observed that adding a lagged output to a supply equation which relates output to price increases the quality of the fit and often eliminates the existing serial correlation. When measures of capital, or of fixed inputs, are added to the equation, the statistical relevance of the lagged dependent variable is reduced or vanishes. A similar result is obtained when a trend variable is added. O. 16. When the sample was divided to subperiods according to the direction of the price changes, it was found that (a) The supply elasticity was higher for a period of increasing prices. (b) When capital is included in the supply function, its coefficient was positive for periods of increasing prices and zero for periods of decreasing prices. (c) When a distributed lag was used, the rate of adjustment was higher for a period of increasing prices.
49
Ch. 1: Production and Supply
O.17. The dependence of the value of the supply elasticity on the length of run reflects a constrained optimization. The severity of the constraints vanishes with time. This view leads to a formulation of a well-defined structure. The work with duality reviewed above supplements the observations O. 12 and O. 13 and shows in general higher elasticities for factor demand than for the product supply which is the foundation for O. 14. 5.2. Static analysis
The starting point of the analysis is the behavioral functions in Equation (23) above. The strength of the response of output and inputs to changes in prices depends on the relative importance of the restricted inputs. The unrestricted case when all inputs are variables is referred to as the long run and is represented by the following behavioral functions: y*(p, w, T),
v*(p, w, T),
k*(p, w, T).
(25)
Empirical analyses are based on dated data where some of the inputs are restricted. In this case, the response is given by Equations (23), and as such, the empirical analysis of (23) produces a restricted or short-run response. The relationship between the restricted supply and the unrestricted supply is given by the identity y(p, w, k*, T) = y*(p, w, T).
(26)
By differentiation, gii" ~ 6ii" -~- Z j3* ijgij , J
(27)
where 6ii = O l n y i / O l n p i , ~iiu and elir are the unrestricted (long-run) and restricted (short-run) elasticities, respectively, /3~ = 0 ln yi/O ln k~ is the production elasticity of k j, the jth component of k, in the production of the ith product, and eji = O l n k ~ / O l n p i is the demand elasticity of kj with respect to Pi. Thus, the long-~'un elasticity is the sum of the short-run elasticities and of the indirect price effect which measures the price effect on the investment in the restricted factors. The relationships in (27) are obtained under the identity in (26), and as such they are restricted to the long-run equilibrium. The demand for capital and the incorporation of nonequilibrium values in the analysis are discussed below. It is obvious that the estimation of Equations (27) requires an elaborate statistical analysis, and we have already seen that it is difficult to get robust results. There is however a simple way to approximate meaningfully the supply elasticity. As shown in [Mundlak (1996b)], given the competitive conditions for the unrestricted inputs, the supply elasticity for a price-taker agent is approximately --
~ v Sv 1 - ~ v Sv'
(28)
Y Mundlak
50
where Sv is the factor share of the vth variable input. The sum is taken over all the unrestricted inputs; it is an estimate of the scale elasticity of the 'short-run' production function, namely, the part of the function that expresses the output as a function of the unrestricted inputs conditional on the restricted ones. The scale elasticity need not be constant everywhere, as the approximation is defined locally, and thus it depends on the classification of inputs to v and k. What is important for the present discussion is that it can be evaluated in general as the sum of the factor shares of the variable inputs. This framework facilitates the derivation of orders of magnitude of the short-run supply elasticity by using empirical evidence on the elasticities of the agricultural production functions. This can be done at various levels of aggregation. To illustrate, consider the aggregate supply under the simplifying assumption that locally, the factor supply functions facing the industry are perfectly elastic and that there is no redistribution of the restricted factors among the firms in response to price variations in the short run. We assume that land, capital, and often labor are fixed in the short run. These inputs account for approximately 0.8 to 0.9 of total output, implying that the supply elasticity is between 0.11 and 0.25. The lower value is in line with the empirical results as summarized above. The division between variable and restricted inputs is to some extent arbitrary. Such a dichotomy implies a zero supply elasticity for the restricted inputs and infinite elasticity for the variable inputs. This dichotomy is often assumed in many of the empirical analyses using derivatives of the profit function. It may hold true for the individual firm but not for the industry as a whole. Taking these considerations into account, the analysis is generalized by introducing the factor supply functions. The smaller the factor supply elasticities, the smaller the product supply elasticity [Brandow (1962), and Floyd (1965)]. Extended analytic results are given in [Mundlak (1996b)]. For instance, for a production function homogeneous of degree/x ~< 1 in the unrestricted inputs, the supply elasticity is
e= l~[(1-- lz) ~- Z(olv/Sv)] -1,
(29)
where s~ 7~ 0 is the supply elasticity of the vth input, and av is the factor share in the total cost of the variable inputs. Equation (29) generalizes Equation (28) in that when the factor supply functions are perfectly elastic for all factors, that is, sv = cx~, the two equations become identical. For a linear homogeneous production function,/x = 1, and Equation (29) reduces to e = (y~ olv/sv) - i which is a finite number. Thus, a constant returns to scale aggregate production function is compatible with a finite supply function because the sector is not a price-taker in some inputs. This expression of the supply elasticity in terms of the factor shares provides the insight for the inverse relationship between the length of run and the size of the supply elasticity. The shorter the run, the more restrictions there are on factor adjustment, and therefore, the smaller the supply elasticity. Restrictions on the overall factor supply, such as farmland, do not apply to the allocation of the factor to alternative crops. For
Ch. 1: Productionand Supply
51
this reason, the lower the level of aggregation of the analysis, the larger the supply elasticity (O. 13). Turning to the relationship between factor demand and the supply elasticities (O. 14), we note that the price effect on input demand contains substitution and expansion effects. Of these, only the expansion effect contributes to the supply because the substitution effect of all the inputs cancels out. Technically, this is the meaning of the singularity of the Slutsky, or Hessian, matrix. This explains the findings in [Griliches (1959)] and subsequent work where the indirect supply elasticity obtained by using the factor demand elasticities gave larger values than those obtained by direct estimation of the supply function; simply, the substitution effect was not eliminated. The same holds for the estimation of the behavioral functions using the duality framework.
6. Dynamics Equations in (23) and (25) constitute a recursive system where the long-run values of k are expressed by (25), whereas the short-run values of v and y are determined by (23) conditional on k and prices. It does not specify the time pattern of the changes in k. The analysis is now extended to deal with this subject. The extension is triggered by the fact that k affects output and cost in more than one period.
6.1. The firm's problem It is postulated that the competitive firm chooses inputs that affect the flow of present and future profits with the objective of maximizing its expected present value. We consider here a simple case where a single output, y, is produced with a durable input, capital, k, and a nondurable, or variable, input, v, that can be hired at the ongoing wage rate, w(t), using a concave and twice differentiable production function, y = F(k, v, r), where r represents technology. The various variables are functions of time, and the income flow at time t is Rt = F(kt, vt, rt) c ( l t ) - w t v t - qtlt. Income and factor prices are measured in units of output, q and w are the real price of the investment good (I) and of the variable input, respectively, and c(I) is the real cost of adjustment [Lucas (1967), Gould (1968), Treadway (1969)]. The underlying idea behind the adjustment cost is that the marginal cost of investment increases as a function of the investment rate, and hence if the firm acts too fast this cost will be excessively high. The function is convex in I (or in the ratio I/k). Let r be the interest rate, fl = (1 + r) -1 is the discount factor; the optimization problem calls for selecting the time path of inputs {v j, k j} that maximizes the expected value of the firm at the base period, 0, -
ma~v
It5
j÷l, j [
E0
Lj=0
~J[Fj(kj, v j , r j ) - w j v j - q j I j - c ( l j )
,]]
(30)
52
Y Mundlak
subject to Ij = kj+l - (1 - ~)kj, the initial value k0, and terminal conditions, where kj is the capital stock at the beginning of period j , and ~ is the depreciation rate. The expectation, Eo, is taken over the future prices and the technology whose distribution is assumed known. 44 To obtain the first order conditions we first differentiate (30) with respect to the nondurable inputs, v j, to obtain: E[0~@j')
wj] = 0 .
(31)
By assumption, the input Vj at any time j has no effect on the revenue in subsequent periods, and therefore its level is determined by equating the expected value of the marginal productivity to that of its real price in each period, as shown by Equation (31). Consequently, the optimization problem can be solved in steps. First, determine for each period the optimal level vj as a function of prices and k j, and substitute the result in the production function to obtain the function, F(kj, s j), where sj =-- (r j, w j, q j, r, 3, c) is the vector of the exogenous variables. The second stage consists of solving
/
max_E0 E f i J [ F j ( k j , s j ) kj+l
[
- c ( l i) - q j I j ]
(32)
j=O
subject to Ij = kj+l - (1 - 8)kj. Label the rate of capital appreciation c) -- it/q and Oj ~ qj[r + ~ - (1 - 8)Oj], which is the rental cost of capital, or briefly the rental rate, evaluated at time j. It is the product of the initial price of the capital good, q, and the annual "charges" consisting of the discount and depreciation rates, adjusted for the expected capital gain, q. Similarly, CI ~ C l (j)[r + 8 - (1 - ~)cj] gives the change in the adjustment cost due to a change of the timing of a unit of investment, on the optimal path, from one year to the next. Differentiate (32) with respect to kj+l and rearrange the result to obtain, for the case when an internal solution exists,
Eo{fiFk(j + 1 ) -
[~l(j)
+ ~j]} = 0 ,
(33)
where we use the notation F(kj, s j) ---- F ( j ) and similarly for other functions, and the subscripts k and I indicate the direction of the partial derivatives of the functions in question. Under static expectations, where the present prices are expected to remain constant indefinitely, E(O) = E (~) = 0, and (33) becomes {fi Fk (j + 1) -- (r -t-3)[ci (j) + qj ] } = 0. In the absence of adjustment cost, this condition reduces to the equality of the marginal productivity of capital and the rental rate [Jorgenson (1967)]. This condition applies to every point on the optimal path. The addition of the adjustment cost affects 44 The terminal condition is limj~e~ E o { f l i [ F k ( j ) -- c i ( j ) -- q j ] k j } = O.
Ch. 1: Productionand Supply
53
the rental rate, and thus it affects not only the pace of investment but also the optimal level of capital. The solution can be expressed in terms of the shadow price of capital defined as the present value of the marginal productivity of capital, net of the adjustment cost, in present and future production: St =- ~ = o h J F ~ ( t + j), where h = (1 - 6)fl < 1. The system can be solved to yield
Et{St-(q¢+c,(t))}=O.
(34)
This condition states that investment is carried out to the point where the shadow price of capital generated by the investment is equal to the cost of investment including the cost of adjustment. The marginal productivity depends on the technology and the inputs at the various points in time, and therefore its evaluation requires an assumption that the investment under consideration is the only investment to be made. If other investments are contemplated, the marginal productivity would have to be evaluated conditional on such investments.
6.2. Discussion The condition in (3 l) is extremely important for empirical analysis in that it implies that along the optimal path, the use of the inputs which have no effect on the revenue or the cost in subsequent periods is determined by equating the marginal productivities to their real prices in each period. This leads to a recursive system [Mundlak (1967)]. First, we determine for each period the optimal levels of the variable inputs as functions of the exogenous variables, including prices and k(t). Second, we solve for k(t) on the optimal time path: k* [E(q, q, 8, r, c, w, p, T)],
(35)
where we insert p, the product price, explicitly. All the variables in (35) are functions of time. The introduction of the intertemporal optimization results in replacing k*(.) in (25) with (35), thereby adding exogenous variables as well as uncertainty with respect to the future time path of the exogenous variables. However, the recursive structure remains the same.
6.3. The role of prices and technology The solution is quite sensitive to changes in the exogenous variables. To gain some insight into the meaning of the solution, we use a Cobb-Douglas production function, y = Avak b. The first order condition in (31) provides a solution v = (a/w)y for the nondurable input. This solution is substituted in the production function to yield, with some simplification,
Y
=
(Aaa)l/(l-a)vo-a/(l-a)k b/(1-a).
(36)
Y Mundlak
54
The marginal productivity of capital conditional on w is 45
OYokw-- l b a
1/(1-a)w-a/(1-a)k(b+a-l)/(l-a)
(37)
This derivative is equated to the rental price of capital to provide a solution for k*, when such a solution exists. Equation (36) is the short-run supply function conditional on k. Output declines with w, but as w is the ratio of nominal wage to output price, p, output increases with p. To simplify the discussion without a loss in generality, we continue by ignoring the adjustment cost. The condition in Equation (33) simplifies to
(38)
E0{~F~(j + 1) - 0j} = 0.
The long-run values (starred) are obtained by using Equations (36) and (38) to yield
k* = (b/gl)y*,
y* = (Aaabb)ew-ae~l -be,
E = 1/(1 - a - b).
(39)
Prices affect the desired capital directly through the rental rate and indirectly through the effect on the optimal output. It is important to differentiate between the direct and the indirect price effect. A change in the wage rate has only an indirect effect on capital with an elasticity E~/w = - a e . The elasticities of the real rental rate, Ek/(t, are -- 1, - b e , and (a - 1)e for the direct, indirect, and total effect respectively. Similarly, the elasticities of capital with respect to a change in the product price are 1, (a + b)e, and e for the direct, indirect, and total effect respectively. Note that the indirect effect (a + b)e is considerably stronger than the direct effect. It is useful to illustrate the order of magnitude of the elasticities in question for arbitrary values of the parameters (Table 3). The elasticity of labor is maintained at 0.3 for the three cases, whereas the elasticity of capital varies from 0.6, a highly capital-intensive process, to 0.1. Note that 0.1 is approximately the estimated elasticity of machinery in many studies, whereas a value of 0.3 represents a broader capital aggregate, including structures. The difference 1 - a - b is the share of fixed factors which vary across cases. In the first case it would be management, whereas in the last case it might also include land. The values in this table provide an insight into the interpretation of the empirical results. To simplify the discussion, we have abstracted from taxes. To add taxes, they have to be inserted in the income expression in (1), and the prices in the foregoing results would have to be adjusted for taxes [Jorgenson (1963)]. The empirical evaluation of the effect of taxes is done in two steps: first, evaluate the effect of the tax on the time path of the rental rate; and second, determine the response of investment to price. It is the latter that is the focus of the empirical analysis. 45 This derivative is evaluated for v kept at its short-run optimal level, which is different from the derivative ~Y Iv = b Y. conditional on v derived from the production function: g~
Ch. 1:
Production and Supply
55 Table 3 Capital-demand elasticities
a=O.3, b=O.6, e = lO
a = 0 . 3 , b = 0 . 3 , E = 2.5
a = 0 . 3 , b = 0.1, e = 1.67
Prices
D
I
T
D
T
D
1
T
W
0 -1 1 0
-3 -6 9 10
-3 -7 10 10
0 -1 1 0
-0.75 -1.75 2.5 2.5
0 -1 1 0
-0.5 -0.17 0.67 1.67
-0.5 -1.17 1.67 1.67
P NTC
1 -0.75 -0.75 1.5 2.5
Legend: D = Direct, 1 = Indirect, T = Total, W = w a g e rate, P = product price, ~ = rental rate, N T C = Neutral technical change.
Neutral technical change is perceived as a change in the multiplicative coefficient (A) of the production function. It affects output and thereby the desired capital level without affecting the capital-output ratio. The demand elasticity with respect to neutral technical change is equal to e. Capital-using technical change, captured here as an increase in b, generates an increase in capital demand and in the capital-output ratio. The overall effect of such a technical change on output depends on what happens to the degree of the function. When the degree is held constant, an increase in b implies a decline of a, and therefore, without imposing a more detailed structure, the net effect on output is ambiguous. To summarize, the expected magnitude of the estimated demand elasticities depends strongly on what variables are held constant in the sample, and therefore we can expect a considerable variability in the empirical results. 6.4. Disinvestment
In general, empirical analysis treats positive and negative accumulation symmetrically even though the costs involved are completely different. The cost of acquisition of a new tractor is different from the selling price of a used one. Implications of this additional detail are discussed by Glenn Johnson (1958), Edwards (1959), Johnson and Quance (1972, pp. 185-195), and more recently by Chavas (1994) mad Hamermesh and Pfann (1996). To place this detail in perspective, we note that on the whole, agricultural investment is positive for most of the time, and therefore the subject of disinvestment is of secondary importance and does not affect our views on the development of agriculture. Its empirical importance is largely limited to the analysis of cyclical behavior and the analysis based on micro data which include firms with zero or negative investment. There are several important reasons for the difference between the acquisition and the selling price. First, the service life of the new capital good is longer than that of the used one, and therefore it is more valuable. Conceptually, this aspect can be incorporated into the analysis by disaggregating the capital goods by age and vintage and pricing the different goods accordingly. The optimization problem of the price-taker farmer would
56
Y..Mundlak
then include acquisition prices by age and vintage instead of one price. If an old machine is sold, someone is buying it because it meets his needs. This indicates that there is a market for all types of machines which are actually traded. The extension of the analysis to include this kind of heterogeneity should give qualitatively different results from the one obtained when the farmer is restricted from purchasing the used equipment (who will then buy it?), as the standard model assumes. The interesting question is what the qualitative effect is. Second, part of the gap between the price of new and used equipment can be attributed to marketing charges and asymmetric information of the pertinent agents. Third, there is the cyclical element. There is a tendency to sell unutilized capacity in bad times when the excess demand for capital goods is declining and with it the price of the used equipment. The cyclical price behavior is likely to differ according to the origin of the capital goods. Used machines are supplied by farmers, and for our purpose they are expected to behave as do capital goods of agricultural origin. Their price is determined endogenously within agriculture and reflects the expected stream of the marginal productivity of capital over its remaining lifetime. To trace the consequences of this extension, it is necessary to work out the market equilibrium for used equipment. This wilt result in a market clearing price, and used equipment will be employed according to conditions analogous to Equation (34). New machines are of nonagricultural origin, and their supply price reflects the conditions in nonagriculture. Therefore the price may be less sensitive to the cyclical conditions in agriculture as compared to used machines. To sum up, the introduction of a second-hand market adds details to the analysis but not a new theory. The asymmetry between investment and disinvestment is more pronounced in models with internal adjustment costs. Obviously, a demolition of a building or a slaughter of a cow does not stretch out over time. The symmetry assumption simplifies the formulation, but it is unrealistic. Its restrictive nature goes undetected because much of the empirical work is based on aggregate data. However, there are some exceptions such as Chang and Stefanou (1988) and Lansink and Stefanou (1997). 6.5. Empirical investment analysis In general, time series of aggregate investment show a positive serial correlation. The determination of the source for this dynamic relation is a key question in investment research. There are two basic approaches. Initially, the dynamics was superimposed on the model, and we therefore refer to it as exogenous dynamics. Alternatively, the dynamics can be developed from the theory, such as in the case of models based on adjustment cost, and it is therefore referred to as endogenous dynamics. Aside from the pattern of the dynamics, the empirical analysis should reveal the response of k* to changes in its determinants, where k* is unobserved and therefore is replaced by the actual capital stock, or changes in it. The actual capital stock by itself is not a well-defined variable, but in this discussion we will ignore the issues involved in the construction of the capital stock.
Ch. 1: Production and Supply
57
6.6. E x o g e n o u s d y n a m i c s
For a variety of reasons, there is a time difference between the date of a firm's decision on a new investment and its completion. The implication is that a decision taken by the firm in a given year may affect investment in future years, or alternatively, the investment in a given year reflects past decisions and, more so, past signals. Such a time distribution of the response was a major justification for the distributed lags analysis, referred to as the flexible accelerator models, introduced by Chenery (1952) and Koyck (1954). In such models, the actual capital stock differs from the desired stock. Koyck's formulation uses geometric weights to express the current capital stock as a weighted average of past values of desired capital. This process can be presented by an adjustment equation (40) where/z, 0 ~< # ~< 1, is the coefficient of adjustment. Nadiri and Rosen (1969) extended this model to more than one quasi-fixed factor. The desired capital is unobserved. In the case of a Cobb-Douglas production function, the desired capital stock is proportional to the long-run output, and the latter can replace the first. Introducing this substitution into Equation (40) and simplifying, we can write the following investment function, where It is the net investment in year t, it = IZYo + I z y y t -- Izkt-1 + error.
(41)
However, the replacement of k* by y* is of little help because the latter is also unobservable. In practice, actual output is used instead in empirical analysis [Jorgenson (1963)]. In so doing, the difference between the short- and the long-run supply is overlooked. The elasticities for long-run response express the response with respect to lasting price and technology changes. Transitory price changes are likely to affect output according to the short-run supply function, but as such should not affect the capital demand. Consequently, the variable used in the analysis measures with error the relevant variable and thereby introduces a downward bias in the estimation [Mundlak (1966)].46 The problem can be overcome by aggregating the variables over time and thereby reducing to a large extent the effect of the transitory variations [Mundlak (1964a, Chapter 6)]. The underlying assumption in Equation (40) is that the adjustment of the actual stock to changes in the desired stock is gradual, but this is not always the case. Often, there are distinct scale economies in the size of the investment, where the unit cost declines with the size of the project, and the optimal size of the investment unit exceeds the demand or requires more resources than are currently available. Consequently, the firm may delay the investment until it is justified to construct a larger project at a lower unit cost (Ibid.).
46 For more detailed discussion of this subject, see [Mundlak(1964a)].
58
Y. M u n d l a k
The phenomenon of lumpy investment at intervals longer than a year is inconsistent with the adjustment cost assumption. However, this is not detected in empirical analysis which uses macro data obtained as aggregates over firms and as such conceal it. Again, with micro data the problem can be overcome by aggregating the variables over time and thereby reducing the importance of the exact timing of the investment (Ibid.). This problem has resurfaced in the context of analysis based on adjustment costs, and we return to it below.
6. 7. Endogenous dynamics - the primal approach There has been a great deal of empirical work based on the Euler equation on nonagricultural data. The equation involves unobservable variables, and to overcome this limitation, alternative approaches have been taken; these are reviewed by Chirinko (1993) and Galeotti (1996). To illustrate the basic issues at stake, we present an empirical version of Equation (33), with the assumption that c(.) = (c/2)I 2 so that c(.) does not depend on the capital stock. Let z be the expected gap between the marginal productivity of capital and the rental rate, zt+j ~ Et{flFk(t ÷ j ÷ 1) - qt+j}. Rearranging Equation (33) subject to the assumption on the adjustment cost, it follows that 1
Et(It+j) - h Et(/t+j+l) = - zt+j. c
(42)
An expected decline in the rental rate or an expected increase in the productivity of capital causes an increase in z, and hence the difference between current investment and expected next-year investment increases. This means that at the margin, current investment increases in order to take advantage of the current opportunities. For the purpose of estimation, Fk is spelled out explicitly in terms of its arguments, and thus the parameters of the production function enter the equation. Similarly, in some applications, the cost of adjustment is formulated so as to depend on some variables, including output. When the marginal productivity of capital and the adjustment costs are written explicitly in terms of their determinants, the empirical equation contains output and prices. The empirical equation is then used to estimate the parameters of the production function, of the adjustment-cost function, and of h. Unlike in the exogenous dynamic models, it is assumed here that the observed capital stock is always equal to the optimal one. There are several problems in using this equation for empirical analysis. First, in this formulation the adjustment-cost parameters are, by assumption, the only source for the dynamics. When in reality the time pattern of investment is affected by other causes, their influence will be captured by the cost of adjustment parameters, and the empirical analysis will give a distorted picture of the dynamics. Second, the Euler equation, (42), provides arbitrage conditions between adjacent periods which have to be met on the optimal path. When the observations are located off the path, this condition is inconsistent with the data. If the model is stable, deviations from the optimal path generate a
Ch. 1:
Productionand Supply
59
correction toward the path. This correction is not described by the model, but it is empirically important and as such it affects the estimates. This may be the reason for the fact that empirical estimates obtained from the Euler equations do not produce robust results. Third, the Euler equation is not an efficient way to estimate the parameters of the production function. As argued earlier, it is more efficient to estimate the production function directly. Fourth, recall that h = (1 - 3)/(1 ÷ r), so that h is not a stable parameter and should be treated as a variable. When h is treated like a constant, variations in h are captured by the equation error, and as such the error is not independent of the investment term on the right-hand side of the equation. This causes a bias in the estimate.
6.8. Endogenous dynamics- the dual approach The dual approach, as developed by McLaren and Cooper (1980) and Epstein (1981), has provided an elegant framework to deal simultaneously with several issues of dynamic adjustment in a practical fashion. It has been applied in agricultural economics research, reviewed below, and it is therefore summarized here. Following the literature, the presentation is in terms of continuous time, and the cost of adjustment appears as an argument in the production function. A crucial element in this framework is the assumption of static price expectation whereby the present prices and technology are assumed to remain constant indefinitely. Modifications of this assumption are discussed below. The production function, F(k, I), is expressed in terms of the quasi-fixed factors, k, and the investment, 1.47 The variables are vectors of comparable dimensions. A partial list of the regularity conditions on the production function includes: Fk(.) > 0, FI(.) < 0, and F(.) is strongly concave in I. The optimization calls for:
J(s) = max/']°c e-rt[ F(k' I) - ~'k + Jk,(I - 6k)] dt I Jo
(43)
subject to k(0) = k0, and the terminal conditions. J(s) is the value function, a prime means transpose, 0 is the vector of rental rates, s = (k, ~, r, 3) is the vector of exogenous variables, ark is the vector of multipliers of the constraint/~ = I - 6k, and as such it represents the shadow price of capital. Note that (43) is expressed in terms of the rental rate, unlike the argument of (30), which is expressed in terms of the price of the capital good. Also, under static expectations, ~ does not contain the capital-appreciation term. This difference in formulation can be of significance in the case of nonstatic expectations. In what follows, unless indicated otherwise, r and ~ are assumed to be constant. All the variables are functions of time and, unless needed, the time notation is avoided.
47 Initially, all inputs can be considered to be quasi-fixed, and it is up to the analysis to determine if a particular input is variable. Alternatively, the production function can be the concentrated function in the quasi-fixed variables.
60
Y. Mundlak
Because the prices and the technology are assumed constant, only their current values matter. This is the major analytic payoff of the assumption of static expectations. Consequently, the problem becomes similar to that of the duality used in the static analysis. The difference between the two models is in the nature of the solution; in the dynamic case, it consists of the time path of the control variables. Under the regularity conditions on F, the value function J satisfies the HamiltonJacobi Bellman equation [Kamien and Schwartz (1991, p. 261)]: r J (s) = relax{F(k, I) - q'k + Jk(s)' ( l - 3k)}.
(44)
A partial list of the regularity conditions on the value function includes: (8 + r) Jk + q -Jkkfc > 0 (equivalent to Fk > 0), Jk > 0 (positive shadow price of capital; follows from the adjustment cost assumption of FI < 0), and a necessary condition that J is convex in prices (because J is a maximum problem). The behavioral functions are derived by differentiating J (.) with respect to the exogenous variables to yield a generalized Hotelling's Lemma. Specifically, a differentiation with respect to ~ and rearrangement yields: (45) where we write J ( k , s) to remind us that k is an argument of J. Thus, the following holds on the optimal path: r J (s) =-- F ( k , it* + 3k) - q ' k + J~(s)[c*.
(46)
The steady state value of k is obtained by setting/~* = 0 and solving: k* + rJ~(k*, s) = 0.
(47)
Given the regularity conditions on J(.), a duality between F(-) and J(-) is established. Let F*(k, I) = m i n { r J ( k , ~) + ~'k - Jk(k, ~ ) ' ( I - 8k)}. q
(48)
Heuristically, the duality prevails if J derived from (43) is used in (48) to derive F*(-), and F*(.) ----F(.). Inversely, if F derived from (48), by using J that maintains the regular conditions on J, is used in (43) to derive J*, then J = J*. This is the meaning of the duality, but as in the static case, this relation is seldom exploited in empirical work. However, there is a revealed difference in aspiration between the static and dynamic analyses. As discussed above, the empirical duality analysis sprung up as an alternative to the primal approach for estimating production functions. The dynamic analysis is focused on the derivation of the demand for the quasi-fixed factors of production. As
Ch. 1: Production and Supply
61
such, the interest is in the empirical performance of (44) and (47) and the conditions underlying their derivation. The empirical implementation requires algebraic formulation of the value function. The quadratic function, in the pertinent variables (or a monotone transformation thereof, such as logarithms or power functions), has been widely used because of its convenience:
j(s)=ao+(dkaq)(;)q_~(k,gl,)(Akk
A~k
Ako)(;) Aqq
where ak, a 0, k, and ~ are column vectors, and the A i j dimensions. Given (49),
J~ = a 0 + Aqkk + A~kO;
(49) are
matrices of conforming
Jok = AOk.
(50)
Substitute in (47) and impose k = k*:
k* = - r ( I -I- rAoK) -1 (a 0 + AO4gl),
(51)
where I is the identity matrix. Substitute (50) in (45) and simplify using (51),
it* = M ( k - k*);
M = (I + rAok) - l ,
(52)
where M is the adjustment matrix. Note the similarity of Equations (52) and (40). In addition to the fact that (52) is a differential equation and (40) is a difference equation, Equation (52) is a multivariate equation and M is expressed in terms of coefficients of the value function. Otherwise, in empirical applications, the two versions are similar in form, so that the foregoing discussion provides a foundation for the distributed lag formulation. Using a discrete time approximation, the empirical equation can be written as
kt = (I - M ) k t - I - M k t.
(53)
The adjustment matrix, M, is constant, but under a different specification of the value function it can become a function of some exogenous variables.
6.9. Empirical investment analysis in agriculture The following review of individual studies is intended to span the space of the empirical parameters, and to convey the cumulative experience which should help us in forming a view of the scope of the various approaches and to learn from their inherent difficulties. This should help in outlining the strategy for future research. Our discussion is limited to the estimation of investment functions and will skip over the important conceptual
62
Y.Mundlak
and practical issues involved in measurements of capital (see for instance: [Griliches (1963c), Ball et al. (1993b), Larson et al. (1999)]. Unlike studies of production or supply functions, there are only a few empirical studies of investment in agriculture using the direct or primal approach. Griliches (1960, 1963c) studied the demand for tractors in the United States in 1921-1957 using a distributed lag framework where the desired stock is determined by the real price of tractors and by the interest rate. The results show the importance of price variables as determinants of investment. Heady and Tweeten (1963, Chapter 11) analyzed the purchases of all farm machinery in the United States in the period 1926-1959, excluding 1942-1947. They report a garden variety of regressions. The core explanatory variables are machines-to-commodity price ratio, a ratio of equity to liabilities of the farm sector, or alternatively a measure of farm income, a time trend, and in some cases, the lagged value of the dependent variable. They conclude that "... a 1 percent increase in the price of either trucks, tractors or equipment aggregate ... is predicted to increase respective annual purchases 1 percent; stock 0.2 percent in one or two years. In four years the elasticity of machinery purchases Qi with respect to Pi remains about unity, but with respect to PR [commodity price YM] is 2 or more. A sustained 1 percent rise in prices received by farmers is expected to increase stock for these same items 0.2 percent in one or two years, 0.5 percent in four years and more than 2 percent in the long run" (pp. 327-328). The trend variable was robust, and the equity/liability ratio had the fight sign and was significant. This can be interpreted as a sign of cyclical behavior, with higher investment in good times. As in many empirical applications, their equations contain fewer variables than what is called for by the theory. Presumably, the equation should include all prices and a measure of technology. In general, with a short time series the empirical equation does not sustain all the pertinent variables. For instance, in the study of Heady and Tweeten (l 963), the inclusion of more prices was not supported by the data. One way to deal with this problem is to collapse the prices and other exogenous variables into one measure, the rate of return. The higher the expected rate of return, the higher the investment demand. The rate of return can be thought of as a proxy for the gap between the expected marginal productivity of capital and the rental rate, labeled as z in Equation (42). Mundlak (1964a, Chapter 6) used a panel of farm micro data to study investment in farm structures using the accelerator formulation and demonstrated the importance of aggregating the data over time in order to eliminate the noise that exists in annual micro data. This finding is consistent with lumpy investment and is not supportive of the idea of a convex cost of adjustment function that results in a gradual adjustment. As indicated earlier, this may be typical for many investments in agriculture. The application of firm theory to the estimation of the aggregate industry investment function overlooks the fact that the supply of capital goods is not perfectly elastic. One way to incorporate this element is to estimate the allocation of total investment to the various sectors. This is the approach taken by Mundlak, Cavallo, and Domenech (1989) for Argentina, and Coeymans and Mundlak (1993) for Chile. The differential sectoral
Ch. 1: Productionand Supply
63
profitability is measured by the rate of return. The long-run elasticity with respect to the ratio of sectoral rates of return is roughly 1 in both countries. 6.10. Dynamic factor demand using duality
The empirical application of the static expectations model assumes that every year the firm recalculates its plans conditional on the new information on prices and technology. The model provides an interpretation of the flexible accelerator, and it facilitates a convenient way to estimate the adjustment pattern of the quasi-fixed factors. The empirical inference has substantive and analytic aspects. The first is judged by the economic meaning of the results, regardless of the method used to derive them. The second is more complex. For the theory to be applicable, the empirical results should be consistent with the underlying conditions of the model. For the duality to be of interest, the prices should appear as arguments in the derived factor demand, their coefficients should have the right sign, and the value function should be convex in the prices. That is, in terms of Equation (49), A ~ should be positive definite. In what follows, we summarize findings, pertinent to our discussion, of some leading studies dealing mostly with agriculture. Some of these studies use micro data, while the others use macro data. There is a similarity in the basic assumptions underlying the static and dynamic dual analysis. Most important is the assumption, often made regardless of the level of aggregation of the data, that the factor supply and the product demand are all perfectly elastic. Other than that, the technology is generally represented by a time trend. The term "capital" is used freely to any aggregate of capital goods. Our foregoing, discussion indicates that the demand elasticity for an input depends on its production elasticity or factor share. Thus, we should expect a different demand elasticity for a single item, say machinery, than for an aggregate measure. Epstein and Denny (1983) applied the Epstein (1981) model to the US manufacturing annual data for the period 1947-1976. This application has had an influence on the studies in agriculture, and we therefore begin by reviewing here some of its pertinent sections. The technology is represented by a cost function, and hence the value function is derived by choosing the investment that minimizes the present value of the time path of the cost of production. Because it is a minimum problem, the value function should be concave in prices, which implies that the matrix analogous to A0~ in (49) should be negative definite. In the estimation, the symmetry in price response was imposed, but the nonnegativity condition is violated. The authors argue that the violation is statistically only marginal. Following this line of thinking, we should note that the origin is also included in the joint confidence region for the price coefficients, which means that the null hypothesis of no price response cannot be rejected. The authors are aware of this problem, but do not accept the outcome because it is inconsistent with the concept of duality underlying the analysis. This raises the question of what do we learn from superimposing a model which is rejected by the data. The cost of this procedure is that we avoid the search for the reasons of the violation of confirming duality with the given sample.
64
Y. Mundlak
The results show that labor and capital turn out as quasi-fixed. The rate of adjustment is fast for labor, an adjustment coefficient of 0.9, which implies a closure of the gap in a little over a year. On the other hand, the rate for capital is slow, an adjustment coefficient of 0.12, which means that it takes about 8 years to close the gap. The adjustment matrix is not diagonal, implying an interaction in the adjustment of the two factors toward their steady exogenous values. The authors are disturbed by the direction of the interaction. "It implies that a 'deficient' stock of labor reduces the demand for capital" [Epstein and Denny (1983, p. 660)]. This finding is acceptable, however, with the choice of technique approach. The own price elasticities for capital and labor are negative but small, both in the short run and the long run. The largest numerical value is the long-run elasticity of capital, which varies between - 0 . 2 5 and - 0 . 1 8 for the three reported years. Because the technology is represented by a cost function, output is one of the arguments of the factor demand and, as in the studies based on the primal approach, it has a much stronger influence on demand. "With respect to output changes, a different pattern emerges. The short-run labor elasticity is roughly 0.6 and the long-run is roughly 60 percent higher. Most of the changes in labor occur in the short-run. For capital, the short-run response is negligible while the long-run response is large, an output elasticity approximately equal to 1.4" [Epstein and Denny (1983, p. 662)]. This implies that in the long run labor expands at about the same rate as output but capital grows at a faster rate, which is consistent with capital deepening and also with the hypothesis that capital is a carrier of new techniques. The authors are aware of the fact that the theory is a micro theory, but it is applied to aggregate data. There would be no difference between the micro and macro models if the firms were similar in some sense, and the micro unit would be representative of the firms in the industry. However, the conditions for this, as developed by the authors and which are similar in nature to those of linear aggregation, are stringent. In the case of the cost function, the value function should be linear and additive in k and y. Specifically, this implies no interaction between size of the firm and factor intensity, which is unlikely in the case of heterogeneous technology. The authors estimate the model under these conditions and find that "... the resulting structure failed to satisfy the regularity conditions" [Epstein and Denny (1983, p. 662)]. In passing, it should be indicated that even if the stringent conditions for aggregation were maintained, there would still be the problem of upward-slopping factor supply that would differentiate between the micro and macro studies. Turning to agriculture, we begin with macro studies of the US agricultural sector or industries thereof. One of the earliest applications of the duality model is the study by Vasavada and Chambers (1986) of the factor demand of US agriculture. 48 The model deals with four input categories: land, labor, machinery, and materials. The results indicate that land, labor, and capital services are quasi-fixed factors, and materials are 48 Lopez (1985b) used the cost of adjustment in studying the dynamics of the Canadian food processing industry.
Ch. 1: Production and Supply
65
variable factors. The univariate flexible accelerator hypothesis is rejected; thus the adjustment process of the various factors is interdependent. The results show a long adjustment period for capital (10 years) and labor (9 years), and a short period for land (2 years). This pattern is puzzling, but before going deep into the rationalization of the results, it is noted that the coefficients of the adjustment matrix are mostly nonsignificant. This suggests that the null hypothesis of no adjustment might not be rejected, in which case there is no response to changes in the desired values. Obviously, this is inconsistent with the fact that inputs change every year. An inspection of the price coefficients indicates that with the exception of materials, the own-price coefficients are not significantly different from zero. Furthermore, "Because all the diagonal elements are not positive, convexity of the value function cannot be accepted" [Vasavada and Chambers (1986, p. 955)]. 49 Luh and Stefanou (1991) estimate factor demand for US agriculture in 1950-1982. Like Vasavada and Chambers (1986), they also obtain a slow convergence to long-run equilibrium values: 0.15 of the gap for capital and 0.11 for labor. Interestingly, unlike Vasavada and Chambers (1986), they find independent convergence of labor and capital. This is consistent with the idea that the equations are strongly influenced by the factor supply. Taylor and Monson (1985) study the factor demand in the US southeastern states in the period 1949-1981. The quasi-fixed factors are land and farm machinery, which the authors refer to as capital. The variable factors are labor and materials. "Fifteen of the estimated 26 parameters are at least two times their corresponding asymptotic standard errors" (p. 5). The price coefficients have the correct signs, hence monotonicity is maintained. Convexity is largely maintained. It seems though that most of the insignificant coefficients are those of prices, and this weakens the finding on convexity. The price elasticities, both short-run and long-run, are mostly low and fairly distant from 1. The hypotheses of independent rates of adjustment and instantaneous adjustment are rejected. The rate of adjustment was 0.55 for machinery and 0.18 for land, which means that it takes roughly two years to close the gap in machinery and six years to close the gap in land. Howard and Shumway (1988) study the US dairy industry in the period 1951-1982. The analysis deals with two quasi-fixed inputs: herd size and labor, whereas feeds is a variable input. They use a modified version of the generalized Leontief equation. Their untested justification for the use of a micro model to the study of the industry is basi-
49 Vasavada and Chambers (1986) remark that "... [t]here are no estimated diagonal elements with negative point estimates whose asymptotic confidenceintervals do not encompass zero and positive numbers at traditionally reasonable levels of significance. Hence, the divergence from convexity,if it exists, may not be significant" (p. 955). This is not a strong supporting argument. It can be conjectured that if a joint confidence region were constructed for all the diagonal parameters in question, it would contain the origin, implying that the quadratic term in prices can be omitted; this reduces the model to absurdity.
66
Y. Mundlak
cally the assumption that the technology is invariant to the size of the firm. 5° A similar assumption was tested by Epstein and Denny (1983) and was rejected. As to the results, "Nearly half of the parameters were significant at the 5 percent level, which was quite robust compared to other estimated dynamic dual models" [Howard and Shumway (1988, p. 842)]. This is hardly a complimentary comment, and it illustrates the difficulties associated with the application of the model. R 2 is high for the inputs but low for the output (0.29). 51 The adjustment rate for cows and labor is 0.09 and 0.4 respectively. This raises a question: When prices change, why would labor respond when the adjustment in herd size is sluggish? It is suggested that "[t]he slow adjustment of cows is consistent with the very inelastic short-run milk supply found in previous studies" [Howard and Shumway (1988, p. 842)]. This now suggests that the capital stock is a function of output, but this is an explanation that the present model intends to replace and as such it is questionable. A different line of reasoning suggests that because the study deals with the industry as a whole, the changes in output reflect expected changes in aggregate demand, and this possibility is not accommodated by the model. The monotonicity conditions on the value function were held at nearly all observations. However when the convexity was imposed, the model did not converge, and this is an indication of inconsistencies. "All the short-run own price input demand elasticities were negative, but the output own-price elasticity was positive for only fifteen of the thirty-two observations" [Howard and Shumway (1988, p. 844)]. In dynamic models, a sign reversal can happen in the short run, but this would have to come from a sign reversal in some inputs. This is not shown to be the case here. "The short-run, ownprice input demand elasticities for cows and labor became more elastic over time. The increasing own-price elasticity for labor was consistent with the increasing proportion of hired to family labor over the period" (Ibid., p. 845). Again, the question of identification comes up. With what we know about the declining number of farm operators in the US (as elsewhere), the question is whether this is not a reflection of changes in labor supply rather than in labor demand. Next, we review two studies that extend the assumption of the model to allow for a difference in the pace of adjustment between positive and negative investment. Chang and Stefanou (1988) apply the model to a panel data of 173 Pennsylvania dairy farms in 1982-1984. Hired labor and feeds are variable inputs, whereas family labor, herd size (cow), real estate, and equipment are quasi-fixed. Results are reported only for the adjustment coefficients, so that we cannot evaluate the impact of the specification on
50 "The dairy industry consists of many price-taking firms, and theory suggests that in long run competitive equilibrium all such firms operate at the minimumaverage cost ... it is necessary and sufficientfor consistent aggregation across firms that the value function be affiue in capital" ]Howardand Shumway(1988, p. 840)]. 51 The actual empirical equation is not presented. However, in general, the inputs are regressed on their lagged values and the other variables. When the dependent variable is quasi-fixed, the regression is of a stock variable on its lagged value. Such equations in general show a very good fit. The output is a flow variable, and this may explain its relatively low value.
Ch. 1: Production and Supply
67
the price coefficients. It is stated that "... at least half of the parameter estimates are significant at the 10 percent significant level especially those associated with prices of v a r i a b l e factors" (p. 149, italics by YM). If this statement suggests low precision of the estimated price coefficients, as in the other studies, the results are better for the adjustment coefficients, where most of the own adjustment coefficients are significant at the 1 percent level. The adjustment of the four quasi-fixed inputs are interdependent. There is a difference in the response when asymmetry is allowed for. "In the symmetric model, the estimated own adjustment coefficient for durable equipment is 0.8072, the highest among four quasi-fixed factors. The adjustment rates for family labor, herd size and real estate are relatively more sluggish. In the asymmetric specification the adjustment of durable equipment also appears to be sluggish. Family labor and herd size follow a similar adjustment pattern in that the contracting adjustment rate is higher than the expanding one... The adjustment rates for real estate and durable equipment are somewhat confusing in terms of their signs and magnitude" (p. 151). Lansink and Stefanou (1997) extend further the asymmetric model by allowing also for changes in the investment regime. The model is applied to a sample of specialized cash crop farms in Holland, 1971-1992. There are 4,040 observations, 2.4 percent of which reported negative investment, 29.4 percent of which had zero investment, and the remainder of which had positive investment. Quasi-fixed inputs are machinery and rootcrop-specific area. Fixed inputs are the total area of rootcrops and other outputs and labor. There are two outputs, rootcrops and 'others'. Variable inputs include pesticides, fertilizers, and 'others'. "This model contains 92 parameters, including two parameters related to the expected error terms in Equation (20). The estimated model generated 49 percent of the parameters estimated significant at the critical 5 percent level. Convexity ... is found not to hold" [Lansink and Stefanou (1997, p. 1346)]. It is concluded that the parameter difference between the two regimes is significant for the adjustment parameter of machinery and the parameter relating machinery investment to the quality of labor. Simulation shows response to prices in both the probability of being in a particular regime and in the magnitude. Finally, "The adjustment rate for machinery is 13 percent a year toward the long-rnn equilibrium machinery target in the presence of a disinvestment regime and 7 percent a year in the presence of an investment regime" (p. 1349). The rate of disinvestment is in line with conventional rates of depreciation used for machinery, which suggests disinvestment by attrition. Under the assumption of static expectations, firms recalculate the optimal plan every year conditional on the prevailing prices and technology. But prices are subject to variations and the firms know it, so they must exercise some judgment as to the permanence of a given price regime. This brings up the question of expectations. Luh and Stefanou (1996) replace the assumption of static expectations with "nonstatic expectations", which are introduced by first order autoregressive regressions. The model is applied to US agriculture, using two alternative data sets. The quasi-fixed inputs are capital and labor. The results are not invariant to the data set. The hypotheses of static
68
Y. Mundlak
price expectations are all soundly rejected for one data set but not for the other. Similarly, the test for independent adjustment rejects the null (independence) for one set but not the other. Quasi-fixity is accepted for both sets. As to the rate of adjustment: "While estimated adjustment rates vary, taken together these results suggest that capital and labor take two to three years to adjust to their long-run equilibrium levels. Other adjustment cost models for US agriculture.., report adjustment rates for capital and labor ranging, respectively, from 9 percent to 55 percent and from 7 percent to 40 percent. Our study predicts moderate adjustment speed for capital but much faster labor adjustment compared to other studies" [Luh and Stefanou (1996, pp. 1001-1002)]. Not all the required properties of the value function are met (Table 6). The authors are disturbed by the fact that the results are sensitive to the data sets. Thijssen (1996) compares static expectations with rational expectations, using panel data of Dutch dairy farms, 1970-1982. The specification is different from the studies reviewed above in that labor and land are treated as exogenous; capital is the only endogenous variable. The results obtained by imposing the constraints of the rational expectations do not make sense and are inconsistent with the theory. The results with static expectations give elasticities of long-run demand for capital of 0.59, -0.45, and -0.13 for the prices of output, capital services, and variable inputs, respectively. However, the coefficients of labor and land are insignificantly different from zero. The impact of the resource constraint on the demand of the factors that are allowed to vary can be evaluated by comparing the short-run and long-run price elasticities. Output control as a component of agricultural policy introduces another constraint. Fulginiti and Perrin (1993) and Moschini (1988) showed that production quotas on a product reduce the supply elasticities of the nonmanaged products. This can be attributed to the reduction in the scope for substitution. Richards and Jeffrey (1997) use the dynamic duality framework and data for Alberta dairy farms over the period 1975-1991. They attribute the impact to the investment that is tied up in the purchase of production quotas, which may amount to "... half of the total cost of establishing a dairy farm, may cause farmers to face a real capital constraint" (p. 555). As to the results, monotonicity and symmetry are not rejected, but "... imposing convexity on the full four quasi-fixed inputs model caused the estimation procedure to fail to converge" (Ibid., p. 561). The model was reduced to contain only two quasifixed inputs, but "[a]s with the full model, the reduced model does not converge with convexity imposed parametrically. Given these results, further estimation proceeds with two quasi-fixed inputs, dairy cattle and quota licenses, with only symmetry imposed" (Ibid., p. 561). The estimated adjustment coefficients were 0.0995 for quota and 0.1556 for cattle. Obviously, the adjustment of the quotas to their long-run equilibrium is slow, and the question is whether this reflects only the demand side or, as with the studies based on industry data, the slow adjustment reflects the changes in the supply of quotas. 6.11. D i s c u s s i o n
We can now repeat the questions asked in our summary discussion of the static dual approach to the estimation of the production functions. These should be answered at
Ch. 1:
Production and Supply
69
two levels: methodological and substantive. On the methodological level, the answer is simple: The approach provides an efficient and powerful way to discuss and formulate dynamic factor demand. Similar to the static duality framework, this assertion is true regardless of the outcome of the empirical analysis. In this respect, the claim made by some of the authors that the empirical analysis tests the validity of the competitive conditions is not accurate. The most that can be claimed for the empirical analysis is that the conducted tests are of the particular specification. A rejection of a particular specification is not a rejection of the competitive conditions. The substantive message is more complex. Like in the static case, the essence of the duality framework is the ability to identify the technology by means of prices. It is therefore only natural that we concentrate our attention on the role of prices. The results with the dual dynamic framework are similar, if not more pronounced, to those obtained in the static case in that the convexity in prices of the value function is generally violated. Moreover, the price effect is relatively weak, and the long-run price elasticities and, of course, the short-run elasticities of the factor demands are relatively low. In some cases the whole price matrix is not significantly different from zero. All this suggests that the raison d'etre of the duality model is put to question. We return to possible explanations below. The dynamic dual approach concentrates on the behavioral equations and grossly neglects the inference on the production function itself. This is a good example of the principle of comparative advantage. The dynamic behavior indicates a gradual adjustment to the prevailing, and ever-changing, gaps between the desired long-run values of the quasi-fixed factors and their current values. This result is obtained by the inclusion of lagged values of the dependent stock variable in the empirical equation, as has been the case with the exogenous dynamics. The difference between the two approaches is that the dual dynamic model connects the adjustment coefficients to those of the value function. This can be considered the strength of the approach, but at the same time it also represents its weakness. In essence, this approach attributes the whole dynamics to the internal cost of adjustment. The empirical results show that in most cases the adjustment is sluggish, and in this respect it is also not different from those obtained under (the presumably naive approach of) exogenous dynamics. There are many investment studies in nonagriculture with cost of adjustment. Often the empirical equation includes output as a variable. In the exogenous dynamics case, output is introduced to the model through the explicit expression of the marginal productivity of capital, and as such, the output coefficient is related to the production function, or through the cost function when the technology is represented by the cost function. On the other hand, in the endogenous dynamics models it is introduced also, and sometimes solely, through the expression for the adjustment cost, and as such it describes a completely different process than that implied from the first case. In summarizing the empirical record in nonagriculture, Chirinko (1993) notes that output performs well in explaining investment and that the performance of prices is rather weak. He also notes a lack of robustness of the results.
70
Y. Mundlak
Can all these results be rationalized? There are two aspects of the decision to invest in any given year: growth and timing. The growth aspect reflects the long-term view about the prospects of the contemplated investment. The question is when to act. The timing aspect is related to the prevailing price variability which generates opportunities for cost reduction, or capital gains. This possibility is ruled out in a world of static expectations where the current prices are assumed to remain constant indefinitely. This is the reason that the value function can be formulated in terms of the annual capital charges (rental rates) rather than in terms of the total expenditures on the capital goods. It is only under the latter formulation that the expected capital gains constitute a component of the rental rate, as for instance in (32) or (34). The prospects for capital gains introduce cyclical considerations into the model. This also holds true for the interest rate which varies over time and also across individuals, reflecting their financial position. However, the interest rate is taken to be constant, as in the empirical studies reviewed above. Furthermore there is the problem of price expectations. There are no clear-cut systematic differences in the estimates associated with different assumptions about the nature of the price expectations. It is difficult to conceive that the expectations do not matter, so it must follow that the tried alternatives have something in common, probably an error component. When the price variables are subject to measurement error, their estimated coefficients are likely to be biased downward. This problem is more serious for the capital goods than for the variable inputs because they require price forecasts for the entire lifetime of the project. If this argument is true, the own price elasticities of the variable inputs should have a lower downward bias and also be more precise (have higher t-ratios) than those of the durable inputs. A superficial inspection of the studies reviewed above indicates that this might be the case. Duality is a micro theory, and therefore the applications with macro data add additional problems. The question of whether the macro function can be considered as that of the representative firm has already been mentioned above. But the test of the conditions for the ideal aggregation that will allow this interpretation deals only with the consequences of aggregation. There is still the problem that the factor supply and product demand are not perfectly elastic as the model assumes. Consequently, there is an identification problem, and the estimated coefficients reflect both supply and demand. This problem is shared also with the static estimates, but the dynamic model has an additional problem in that the pace of the closure of the gap is likely to reflect the pace of the changes in the factor supply or product demand. For instance, in interpreting the studies on US agriculture it is important to note that the movement of labor and capital have taken opposite directions. The decision of labor to leave agriculture is a decision made by households on their employment conditional on the opportunities outside agriculture. As for capital, its supply is not perfectly elastic, and agriculture has to compete with other industries for resources. This is consistent with the study by Lee and Chambers (1986), which tests for the credit constraint in US agriculture in 1947-1980 and concludes that farmers do not face a perfectly elastic supply of funds or credit (p. 865). As such, it is also supportive of the discussion on the choice of technique.
Ch. 1: Productionand Supply
71
For the micro data, we noted that in many cases the investments are lumpy. A tractor is not purchased gradually, a piece at a time, and similarly for a milking shed. This pattern is masked in the analysis with macro data because the aggregation over firms gives a smooth time path of the investment, but the results do not shed light on the decisions made at the farm level. Why does output perform better in studies where it appears as a variable? The foregoing discussion suggested some reasons for a revealed weak price response. In addition, as illustrated in the foregoing discussion, a change in price has direct and indirect effects on the desired capital stock, and the indirect effect is considerably larger. Thus, part of the effect of output on the desired capital stock may reflect an indirect effect of price. In addition, changes in output represent not only price effects but also changes in technology. As technology is the engine of growth, it probably plays a key role in explaining actual investment in many cases. In conclusion, the endogenous dynamics models have two basic limitations. First, they describe a dynamic process in terms of unobserved variables, and thereby lose the main potential of explaining the timing of investment; and second, their only engine for the dynamics is the internal cost of adjustment. There has been no obvious advantage to their performance in empirical analysis nor has there been any particular insight gained by their empirical application.
7. The scope for policy evaluation In the discussion of duality, the question was raised as to where we go from here. At this stage, it is clear that this question should be addressed within the broader framework that has evolved from the foregoing discussion. The core of the production structure, as outlined above, can be summarized by the following functions: y (v, k, T)
Production function
(54)
v(p, w, k, T)
Demand for nondurable inputs
(55)
w (v, s (v))
Supply of nondurable inputs
(56)
k* (s (k*))
Capital demand on the optimal path
(57)
k(k*, s(k))
Actual capital
(58)
T (s (T) )
Implemented technology
(59 )
where s(x) is the vector of the exogenous variables pertinent to the supply or demand of x, whichever the case may be. Specifically, s(v) are the exogenous variables that affect the supply of the nondurable (variable) inputs, s(k*) affect the capital demand on the optimal path, s (k) are the variables that determine the dynamics of convergence of the capital stock to the optimal path, and s(T) determine the implemented technology. Some of the exogenous variables were discussed explicitly above, others are discussed in the references or are left in an implicit form. In passing we note that the role of these
Y. Mundlak
72
variables in empirical analysis is still to be more fully unveiled in future research. The system should also include land which is not dealt with explicitly here because we have already covered considerable ground without land. Mechanically, we can think of land as being a component of capital, in which case the supply condition of this component should be carefully specified. 52 To obtain the dynamics of the supply, substitute the functions (55)-(59) in the production function to obtain
y[p, w, s(v), s(k*), s(k), s(T)].
(60)
Obviously, a function of the form y (p, w) cannot capture all the complexities of Equation (60). The function serves as an approximation whose quality depends on the importance of the missing exogenous variables, which in turn depend on the data base. More generally, this is the problem of estimates based on duality which depend heavily on prices. When dealing with micro data with constant technology, the only relevant issue that will differentiate between the general expression in (60) and y(p, w) is the handling of capital. On the other hand, when dealing with aggregate time-series data, all the exogenous variables may have an important impact. Can such systems be evaluated empirically? The answer is positive, as has been demonstrated by Cavallo and Mundlak (1982) and Mundlak, Cavallo, and Domenech (1989) for Argentina; Coeymans and Mundlak (1993) for Chile; Lachaal and Womack (1998) for Canada; and at a lower level of aggregation, McGuirk and Mundlak (1991) for the Punjab agriculture under the Green Revolution. These studies show clearly that agriculture responds to prices following endogenous dynamics, of a different form from those discussed above, and that it takes time for the response to reach its full course. Studying the production structure in all its complexities is both research-intensive and promising. What is the alternative? I will leave it for the reader to formulate his or her own answer. However, in thinking of an answer, we have to keep in mind that more than 70 years have passed since the work of Douglas. During this period, considerable work and ingenuity has been directed to improve the specification and the estimation method, but as we have indicated, there is no simple, robust way to describe reality. In part, the reality has many faces, and in part the researchers have many faces. As in Rashamon, we vary in our reports of the same phenomenon. With this background, we can now address the cardinal question of what effect policy can have on production. Traditionally, the evaluation of the consequences of policy is limited to the examination of resource allocation. The present framework introduces an additional dimension, the determination of the implemented technology. The dependence of the implemented technology on the environment is the key factor to understanding why less-developed countries lag persistently behind the performance of developed countries. The economic environment is affected by policies, sector-specific
52 For a discussion of land, see [Mundlak (1997)].
Ch. 1: Productionand Supply
73
as well as sector-neutral. The response to changes in the economic environment is not immediate, and it is therefore important to spell out the role of the dynamics of response through resource allocation and the choice of the implemented technology. This is what the above structure does. 7.1. Summary and conclusions
We have reviewed the more important issues concerning empirical production and supply analysis with emphasis on agriculture. In order to confront aspiration with reality, we have deliberately substantiated the main arguments with explicit, and in some cases detailed, references to the reviewed studies. The literature, spread over 50 years of research, has evolved from analysis of specific issues concerning the production function p er se to analysis which binds together competitive conditions with the technology. Initially, the incorporation of competitive conditions dealt with static (one period) analysis, and this was extended later on to dynamic analysis. The lack of robust, and often of meaningful, results triggered a search in several directions: better precision in the estimation, an appropriate parametric form of the production function, or avoidance of a parametric presentation altogether, and ultimately the consequences of heterogeneous technology. To some extent, the different approaches have been associated with different questions asked and consequently resulted in different results, which are not always comparable. This complicates the assessment, and consequently the evaluation of a given approach is done by comparing the results with the underlying assumptions and expectations, as well as with the substantive message. This state of affairs is unsatisfying because the essence of duality is that knowing the production function, one can derive the behavioral equations and conversely, but the analysis is seldom carried out that far. Still, the search in the various directions has been essential for the understanding of the process, for marking the boundaries of the empirical analysis, and for developing alternative approaches that might overcome some of the difficulties. This is research. The primal approach consisted initially of the estimation of a Cobb-Douglas production function using both micro and macro data. The main yield of these studies consists of production elasticities, a check of the prevalence of profit maximization, and a measure of economies of scale. The results have not been robust and have varied with the samples. We have provided some numerical results for the production elasticities which, on the whole, show that labor elasticity in agriculture is smaller than in nonagriculture, indicating that agriculture is more susceptible to changes in the cost of capital and less to changes in the wage rates than nonagriculture. Economies of scale have been detected mainly in strictly cross-sectional studies and are attributed to statistical bias due to the correlation between the unobserved idiosyncratic productivity and the input level, or simply the endogeneity of inputs. The main approaches to overcome this statistical bias have been the use of covariance analysis in panel data and the use of prices as instrumental variables (and more recently a combination of the two). The covariance analysis also provides a measure of the managerial ability - the idiosyncratic productivity - of the various firms (or other observation units such as a country or a region
74
Y. Mundlak
as well as time). This measure is based on the same concept as that of the residual, or the TFE The extension of the analysis to production functions with richer parametric presentation offered greater flexibility in fitting the function to data, and bred expectations for more robust results. How do such extensions modify the conclusions drawn from the Cobb-Douglas model with respect to elasticities, profit maximization, and scale economies? In most cases, no comparison of the production elasticities obtained by the different functions is reported. Perhaps additional work would be required, perhaps this question has not come up, but there is also a more profound reason. The more general functions are either nonlinear in the parameters (such as the CES, or some of the quadratic functions) or contain too many parameters which leads to multicollinearity, and therefore are not easy to estimate directly. The situation is simplified considerably when the parameters are estimated from the first order conditions for profit maximization, rather than from the production function itself. This requires the imposition of profit maximization on the model. In many cases, the dependent variables are the factor shares, or a monotone function thereof. This procedure precludes the testing of the profit maximization and of economies of scale. The explanatory variables in these equations are the inputs. Thus, the essence of such extensions is to attribute the differences in the factor shares across observations to the variations in the input ratios, whereas in the Cobb-Douglas case the elasticities are constant. In many cases the variability in the input ratios in the sample is not sufficiently large to induce the observed spread in the factor shares. Because the parametric enrichment of the specification of the production function generated the need to use the first order conditions for profit maximization in empirical analysis, it thereby eliminated the possibility of testing this hypothesis empirically. This state of affairs generated a potential scope for the nonparametric methods which offers a simple test for profit maximization. One can think of a two-stage analysis: a preliminary test of the hypothesis by nonparametric methods, and if the hypothesis is not rejected, a follow-up with parametric specification that imposes the conditions for profit maximization. Unfortunately, this course of action suffers from the fact that under technical change, the test for profit maximization loses much of its purity. The allowance for technical change implicitly utilizes profit maximization, and thus the analysis loses not only its purity but also much of its usefulness. Having said this, we note that there is a more profound consideration. The question of profit maximization is not a qualitative one that can be answered yes or no. Even if profit maximization is the rule, there are deviations from the first order conditions, and therefore the imposition of these conditions in the estimation may lead to erroneous results. Such deviations from the first order conditions may reflect considerations such as risk, dynamic considerations in the case of the price of durables, or simply a discrepancy in the price perception between the econometrician and the firms. Given the estimates of the primal function, it is possible to calculate the elasticities of the behavioral functions, product supply and factor demand, and the value of the objective functions, profit, cost, or revenue as the case may be. Duality offers a reverse
Ch. 1: Production and Supply
75
course of action where the point of departure is the objective function. When the objective function is known, it can be used to derive the production function. In principle, there are several reasons to use duality in empirical analysis. First, it is a powerful theoretical concept. Second, prices are thought to be exogenous and therefore can be used to identify the technology, thereby overcoming the endogeneity of the inputs in the direct estimation of the production function. Third, it may provide a useful presentation of the technology. The first point is valid, but the problem is in its empirical implementation. The second point is valid only for micro data, but even then the method does not utilize all the information available for the identification of the production function, and as such it is not efficient compared to the primal estimates. The third point is valid only when the implemented technology is independent of the prices. When the objective function is rich in parameters, the dual specification is reduced for empirical analysis by the use of the envelope theorem to yield empirical equations where the dependent variables are inputs, outputs, or factor shares. Those are regressed on the pertinent prices, time trend, and sometimes output. When the change in the use of inputs is decomposed to price, trend (a proxy for technology), and output effects, it is found that trend and output capture most of the change, whereas the role of prices is the least important. Thus the contribution of prices to the explanation of inputs or output variations is rather limited. Duality between technology and prices holds under well-defined conditions that can be tested empirically. In most studies these underlying conditions are not fully met; in particular the concavity of the cost function or the convexity of the profit function is violated. Therefore, the estimated technology is inconsistent with the basic premises of the model. The price elasticities of factor demand and product supply are usually obtained under the assumption that producers are price takers in the product and factor markets. On the whole, the own-price elasticities are less than one. There is no uniformity in the signs of the cross elasticities, but in general, most inputs appear to be substitutes. The magnitude of the own and cross elasticities reflects in part the fact that in reality factor supplies are not perfectly elastic as the models assume, and therefore the results need not represent demand-driven substitution as is thought. This is the case with respect to elasticities related to labor, land, and capital. We further elaborate on this subject below. With respect to other findings, interestingly, on the whole the studies based on duality do not show increasing returns to scale. Technical change, obtained by including a time trend in regressions of factor shares, is largely labor-saving, capital-using, and fertilizerusing, with the results for land being somewhat ambiguous. The interest of agricultural economists in the behavioral functions had long preceded the work on production functions. The work on supply response, which was triggered by policy considerations rather than methodological innovations, is similar in nature to that of the empirical estimation of behavioral functions that emerged from the estimation of the dual functions. The initial work on supply response was in part intuitive; it lacked the duality framework, and basically it had been inspired by the primal approach. Still, it emphasized two related cardinal topics whose importance has not diminished: quasi-fixed factors and dynamics. The root of the importance of these topics is in the
76
Y. Mundlak
fact that static analysis is timeless, whereas data are dated. This requires that behavioral equations will be conditional on the available quantities of quasi-fixed factors, a condition that has been overlooked in many (but not all) of the studies based on duality. Such functions are termed short-run, or restricted, functions. Supply elasticities derived from short-run functions are inversely related to the relative importance of quasi-fixed factors (as measured by their factor shares). The larger is the relative weight of the quasi-fixed factors, the larger is the gap between the short- and long-run supply (or factor demand) elasticities. This gap was well highlighted by distributed lag analysis which introduced dynamics into the empirical analysis. The distributed lags model is a powerful empirical tool because of its simplicity. But when the distributed lags model is applied to the outputs or inputs that are endogenous in the short run, this simplicity is achieved at the cost of ignoring the underlying production structure. The extension of the analysis to the long run requires determining the optimal level of the quasi-fixed factors, and this is done within the framework of multiperiod optimization, an important subject of current research. Intertemporal optimization determines the optimal time path for durable goods, or simply capital goods. The first-order conditions for optimization using the primal approach sets the marginal productivity of capital equal to the user cost at any point on the optimal path. Endogenous dynamics are generated within the model, mostly by the inclusion of adjustment costs, whereas exogenous dynamics superimpose the dynamics on the model without an explicit expression for the causality. Under the dual approach, as in the static case, the value function is specified parametrically and serves as a starting point for deriving the factor demand. There is a similarity in the basic appearance of the empirical equations of these alternative approaches in that they all express the capital demand in terms of incentives and the existing capital stock. There are two aspects of the decision to invest in any given year: growth and timing. The growth aspect reflects the long-term view about the prospects of the contemplated investment, and the timing aspect is related to the question of when to act. The expected profitability of investment is affected by changes in technology and prices. Over the long haul, technology changes more than real prices. In fact, in the case of agriculture, investment has taken place in spite of a decline in real prices. Yet, the emphasis in empirical analysis has been to explain investment in terms of prices, while technology is represented by time trend. This is particularly true for studies based on the dual approach. Time trend is not sufficiently reflective of the changes in technology. Thus it might be more promising to measure the incentives in terms of the rate of return on capital, which summarizes the information on technology and prices, rather than in terms of prices. The dynamic dual approach provides an efficient and powerful way to discuss and formulate dynamic factor demand. However, the results with the dual dynamic framework are similar, if not more pronounced, to those obtained in the static case in that convexity in prices of the value function is generally violated. Moreover, the price effect is relatively weak, and the price elasticities, and especially the short-run elasticities, of the factor demands are relatively low. In some cases the whole price matrix is not signifi-
Ch. 1: Production and Supply
77
cantly different from zero. All this suggests that the r a i s o n d'Otre of the duality model is put to question. On the other hand, in studies which, for whatever reason, include output as an explanatory variable, output appears as a very prominent variable. It is suggested that this is due to the fact that output is a good proxy for profitability and may reflect the effect of technical change, as well as prices. There are several possible reasons for the poor performance of prices. Some of them are due to the fact that duality is a micro theory, and therefore the applications with macro data add additional problems. In addition, there is the problem of long horizon which requires generating expected prices, and technology for that matter, for the entire lifetime of the investment. These have to be generated, and there is considerable scope for error. In addition, in the case of the dual approach, the specification is very parameter-intensive, and this creates imprecision in the estimation of individual coefficients. The empirical results indicate a gradual and sluggish adjustment to the ever changing gaps between the desired long-run values of the quasi-fixed factors and their current values. This raises a question whether the sluggish response is the outcome of the internal cost of adjustment or alternatively a reflection of the fact that total resources are limited and the economy is facing an upward-slopping factor supply, which may be fairly inelastic. As we progress with the review, it has become evident that some of the difficulties that have been encountered in the empirical work could be accounted for if we allow for heterogeneous technology. Changes in the available technology and in the economic environment generate opportunities for firms to seize on. The implementation of new available technologies is governed by economic considerations and is affected by the variables used in conventional analysis, such as prices or capital. It is suggested that the scope of this approach should be further investigated as a step in our attempt to come up with a uniform and robust framework that would be applicable to a wide range of economic and physical environments. An important advantage of this framework is that it provides a channel for introducing the direct effect of policy on productivity. To conclude, in spite of all these difficulties of obtaining a uniform robust model, we know today quite a bit about orders of magnitude of some important parameters.
Acknowledgement I am indebted to Rita Butzer for comments and for editorial assistance.
References Afriat, S.N. (1972), "Efficiency estimation of production function", International Economic Review 13(3):568-598. Antle, J.M. (1983), "Infrastructureand aggregateagricultural productivity:Internationalevidence",Economic Development and Cultural Change31(3):609-619.
78
Y. Mundlak
Antle, J.M. ( 1984), "The structure of US agricultural technology, 1910-78", Am erican Journal of Agricultural Economics 66(4):414-421. Arrow, K.J., H.B. Chenery, B.S. Minhas and R.M. Solow (1961), "Capital-labor substitution and economic efficiency", Review of Economics & Statistics 43(3):225-250. Askari, H., and J.T. Cummings (1976), Agricultural Supply Response: A Survey of the Econometric Evidence (Praeger Publishers, New York). Ball, V.E. (1985), "Output, input and productivity measurement in US agriculture: 1948-79", American Journal of Agricultural Economics 67(3):475-486. Ball, V.E., J.-C. Bureau, K. Elkin and A. Somwaru (1993a), "Implications of the common agricultural policy reform: An analytical approach", USDA, mimeograph. Ball, V.E., J.-C. Bureau, J. Butanlt and H.E Witzke (1993b), "The stock of capital in European community agriculture", European Review of Agricultural Economics 20:437-450. Ball, V.E., J.-C. Bureau, R. Nehring and A. Somwaru (1997), "Agricultural productivity revisited", American Journal of Agricultural Economics 79(4): 1045-1063. Bar-Shira, Z., and I. Finkelshtaiu (1999), "Simple nonparametric tests of technological change: Theory and application to US agriculture", American Journal of Agricultural Economics (forthcoming). Bean, L.H. (1929), "The farmers' response to price", Journal of Farm Economics 11:368-385. Bhattacharjee, J.E (1955), "Resource use and productivity in world agriculture", Journal of Farm Economics 37(1):57-71. Binswanger, H.E (1974), "A cost function approach to the measurement of elasticities of factor demand and elasticities of substitution", American Journal of Agricultural Economics 56(2):377-386. Bouchet, E, D. Orden and G.W. Norton (1989), "Sources of growth in French agricuhure", American Journal of Agricultural Economics 71 (2):280-293. Brandow, G.E. (1962), "Demand for factors and supply of output in a perfectly competitive industry", Journal of Farm Economics 44(3):895-899. Brewster, J.M., and H.L. Parsons (1946), "Can prices allocate resources in American agriculture?", Journal of Farm Economics 28(4):938-960. Bronfenbrenner, M. (1944), "Production functions: Cobb-Douglas, interfirm, intrafirm", Econometrica 12(1):35-44. Capalbo, S.M. (1988), "A comparison of econometric models of US agricultural productivity and aggregate technology", in: S.M. Capalbo and J.M. Antle, eds., Agricultural Productivity: Measurement and Explanation (Resources for the Future, Washington, DC) 159-188. Capalbo, S.M., and T.T. Vo (1988), "A review of the evidence on agricultural productivity and aggregate technology", in: S.M. Capalbo and J.M. Antle, eds., Agricultm-al Productivity: Measurement and Explanation (Resources for the Future, Washington, DC) 96-137. Cassels, J.M. (1933), "The nature of statistical supply curves", Journal of Farm Economics 15(2):378-387. Cavallo, D. (1976), "A note on consistent estimation of a production function with partially transmitted errors", Department of Economics mimeo (Harvard University, Cambridge, MA). Cavallo, D., and Y. Mundlak (1982), Agriculture and Economic Growth in an Open Economy: The Case of Argentina, Research Report No. 36 (International Food Policy Research Institute, Washington, DC). Caves, D.W., and L.R. Chfistensen (1980), "Global properties of flexible functional forms", American Economic Review 70(3):422-432. Chalfant, J.A. (1984), "Comparison of alternative functional forms with application to agricultural input data", American Journal of Agricultural Economics 66(2):216-220. Chalfant, J.A., and B. Zhang (1997), "Variations on invariance or some unpleasant nonparametric arithmetic", American Journal of Agricultural Economics 79(4): 1164-1176. Chambers, R.G., and R.E. Just (1989), "Estimating multioutput technologies", American Journal of Agricultural Economics 71(4):980-995. Chambers, R.G., and R.D. Pope (1994), "A virtually ideal production system: specifying and estimating the VIPS model", American Journal of Agricultural Economics 76(1): 105-113.
Ch. 1:
Productionand Supply
79
Chang, C.C., and S.E. Stefanou (1988), "Specification and estimation of asymmetric adjustment rates for quasi-fixed factors of production", Journal of Economic Dynamics and Control 12(1): 145-151. Chavas, J.-R (1994), "Production and investment decisions under sunk cost and temporal uncertainty", American Journal of Agricultural Economics 76(1): 114-127. Chavas, J.-R, and T.L. Cox (1988), "A nonparametric analysis of agricultural technology", American Journal of Agricultural Economics 70(2):303-310. Chavas, J.-R, and T.L. Cox (1994), "A primal-dual approach to nonparametric productivity analysis: The case of US agriculture", The Journal of Productivity Analysis 5(4):359-373. Chavas, J.-P., and T.L. Cox (1992), "A nonparametric analysis of agricultural technology", American Journal of Agricultural Economics 74:583-591. Chenery, H.B. (1952), "Overcapacity and the acceleration principle", Econometrica 20(1):1-28. Chennareddy, V. (1967), "Production efficiency in South Indian agriculture", Journal of Farm Economics 49(4):816-820. Chh'inko, R.S. (1993), "Business fixed investment spending: a critical survey of modeling strategies, empirical results, and policy implications", Journal of Economic Literature 31 (4): 1875-1911. Christensen, L.R., D.W. Jorgenson and L.J. Lan (1973), "Transcendental logarithmic production frontiers", Review of Economics and Statistics 55(1):28-45. Clark, C. (1973), The Value of Agricultural Land (Pergamon Press, Oxford). Clark, J.S., and C.E. Youngblood (1992), "Estimating duality models with biased technical change: A time series approach", American Journal of Agricultural Economics 74(2):353-360. Cobb, C.W., and P.H. Douglas (1928), "A theory of production", American Economic Review 18(1):139-165. Coeymans, J.E., and Y. Mundlak (1993), Sectoral Growth in Chile: 1962-82, Research Report No. 95 (International Food Policy Research Institute, Washington, DC). Colyer, D., and G. Jimenez (1971), "Supervised credit as a tool in agricultural development", American Journal of Agricultural Economics 53(4):639-642. Cox, T.L., and J.-P. Chavas (1990), "A nonparametric analysis of productivity: The case of US agriculture", European Review of Agricultural Economics 17(4):449-464. Diewert, W.E. (1974), "Applications of duality theory", in: M. Intrilligator and D.A. Kendriek, eds., Frontiers of Quantitative Economics, Vol. II (North-Holland, Amsterdam). Douglas, RH. (1976), "The Cobb-Douglas production function once again: its history. Its testing, and some new empirical values", Journal of Political Economy 84(5):903-916. Edwards, C. (1959), "Resource fixity and farm organization", Journal of Farm Economics 41(4):747-759. Epstein, L.G. (1981), "Duality theory and functional forms for dynamic factor demands", Review of Economic Studies 48(1):81-95. Epstein, L.G., and M.G.S. Denny (1983), "The multivariate flexible accelerator model: its empirical restrictions and an application to US manufacturing", Econometrica 51(3):647~674. Evenson, R.E., and Y. Kislev (1975), Agricultural Research and Productivity (Yale University Press, New Haven). Fawson, C., and C.R. Shnmway (1988), "A nonparametric investigation of agricultural production behavior for US subregions", American Journal of Agricultural Economics 70(2):311-317. Featherstone, A.M., G.A. Moghnieh and B.K. Goodwin (1995), "Farm-level nonparametric analysis of costminimization and profit-maximization behavior", Agricultural Economics 13(2): 109-117. Floyd, J.E. (1965), "The effects of farm price supports on the returns to land and labor in agriculture", Journal of Political Economy 73(2): 148-158. Fox, G., and L. Kivanda (1994), "Popper or production?", Canadian Journal of Agricultural Economics 42(1):1-13. Fulginiti, L., and R. Perrin (1993), "The theory and measurement of producer response under quotas", Review of Economic and Statistics 75(1):97-106. Fuss, M., and D. McFadden (1978), "Flexibility versus efficiency in ex ante plant design", in: M. Fuss and D. McFadden, eds., Production Economics: A Dual Approach to Theory and Applications (North-Holland, Amsterdam) 311-364.
80
E Mundlak
Fuss, M., D. McFadden and Y. Mundlak (1978), "A survey of functional forms in the economic analysis of production", in: M. Fuss and D. McFadden, eds., Production Economics: A Dual Approach to Theory and Applications (North-Holland, Amsterdam) 219-268. Galbraith, J.K., and J.D. Black (1938), "The maintenance of agricultural production during depression: The explanations reviewed", Journal of Political Economy 46(3):305-323. Galeotti, M. (1996), "The intertemporal dimension of neoclassical production theory", Journal of Economic Surveys 10(4):421-460. Gould, J.E (1968), "Adjustment costs in the theory of investment of the firm", Review of Economic Studies 35(1):47-55. Griliches, Z. (1959), "The demand for inputs in agriculture and a derived supply elasticity", Journal of Farm Economics 41(2):309-322. Griliches, Z. (1960), "The demand for a durable input: Farm tractors in the United States, 1921-57", in: A.C. Harberger, ed., The Demand for Durable Goods (The University of Chicago Press, Chicago) 181-207. Griliches, Z. (1963a), "The sources of measured productivity growth: United States agriculture, 1940-1960", Journal of Political Economy 71 (4): 331-346. Griliches, Z. (1963b), "Estimates of the aggregate agricultural production function from cross-sectional data", Journal of Farm Economics 45(2):419-428. Griliches, Z. (1963c), "Capital stock in investment functions: Some problems of concept and measurement", in: C.E Christ et al., eds., Measurement in Economics: Studies in Mathematical Economics and Econometrics, in Memory of Yehuda Grunfeld (Stanford University Press, Stanford, CA). Griliches, Z. (1964), "Research expenditures, education, and the aggregate agricultural production function", American Economic Review 54(6):961-974. Griliches, Z., and D. Jorgenson (1966), "Sources of measured productivity change: Capital input", American Economic Review 56(2):50-61. Haavelmo, T. (1947), "Methods of measuring the marginal propensity to consume", Journal of the American Statistical Association 42:105-122. Hail, R.E. (1973), "The specification of technology with several kinds of output", Journal of Political Economy 81(4):878-892. Hamermesh, D.S., and G.A. Pfann (1996), "Adjustment costs in factor demand", Journal of Economic Literature 34(3):1264-1292. Hanoch, G. (1975), "Production and demand models with direct or indirect implicit additivity", Econometrica 43(3):395-419. Hanoch, G., and M. Rothschild (1972), "Testing the assumptions of production theory: A nonparametric approach", Journal of Political Economics 80:256-75. Hayami, Y. (1969), "Sources of agricultural productivity gap among selected countries", American Journal of Agricultural Economics 51(3):564-575. Hayami, Y. (1970), "On the use of the Cobb-Douglas production function on the cross-country analysis of agricultural production", American Journal of Agricultural Economics 52(2):327-329. Hayami, Y., and V.W. Ruttan (1970), "Agricultural productivity differences among countries", American Economic Review 60(5):895-911. Headley, J.C. (1968), "Estimating the productivity of agricultural pesticides", American Journal of Agriculturai Economics 50(1):13-23. Heady, E.O. (1946), "Production functions from a random sample of farms", Journal of Farm Economics 28(4):989-1004. Heady, E.O., and J.L. Dillon (1961 ), Agricultural Production Functions (Iowa State University Press, Ames). Heady, E.O., and L.G. Tweeten (1963), Resource Demand and the Structure of the Agricultural Industry (Iowa State University Press, Ames). Herdt, R.W. (1971), "Resource productivity in Indian agriculture", American Journal of Agricultural Economics 53(3):517-521. Hildebrand, J.R. (1960), "Some difficulties with empirical results from whole-farm Cobb-Douglas-type production functions", Journal of Farm Economics 42(4):897-904.
Ch. 1:
Production and Supply
81
Hoch, I. (1955), "Estimation of production function parameters and testing for efficiency", Econometrica 23(3):325-326. Hoch, I. (1958), "Simultaneous equation bias in the context of the Cobb-Douglas production function", Econometrica 26(4):566-578. Hoch, I. (1962), "Estimation of production function parameters combining time-series and cross-section data", Econometrica 30(1):34--53. Hopper, W.D. (1965), "Allocation efficiency in a traditional Indian agriculture", Journal of Farm Economics 47(3):611-624. Howard, W.H., and C.R. Shumway (1988), "Dynamic adjustment in the US dairy industry", American Journal of Agricultural Economics 70(4):837-847. Huang, Y. (1971), "Allocation efficiency in a developing agricultural economy in Malaya", American Journal of Agricultural Economics 53(3):514-516. Huffman, W.E., and R.E. Evenson (1989), "Supply and demand functions for multiproduct US cash grain farms: Biases caused by research and other policies", American Journal of Agricultural Economics 71(3):761-773. Johnson, D.G. (1950), "The nature of supply function for agricultural products", American Economic Review 40(4):539-564. Johnson, G.L. (1958), "Supply function-some facts and notions", in: E.O. Heady, H.G. Diesslin, H.R. Jensen, and G.L. Johnson, eds., Agricultural Adjustment Problems in a Growing Economy (The Iowa State College Press, Ames, Iowa) 74-93. Johnson, G.L., and L. Quance (1972), The Overproduction Trap in US Agriculture (The Johns Hopkins University Press for Resources for the Future, Baltimore, Maryland). Jorgenson, D.W. (1963), "Capital theory and investment behavior", American Economic Review 53(2):247259. Jorgenson, D.W. (1967), "The theory of investment behavior", in: R. Ferber, ed., Determinants of Investment Behavior, (Columbia University Press, National Bureau of Economic Research, New York) 129-155. Jorgenson, D.W. (1986), "Econometric methods for modeling producer behavior", in: Z. Griliches and M.D. Intriligator, eds., Handbook of Econometrics, Vol. 111(North-Holland, Amsterdam) 1841-1915. Jorgenson, D.W., and EM. Gollop (1992), "Productivity Growth in US agriculture: A postwar perspective", American Journal of Agricultural Economics 74(3):745-750. Just, R.E., D. Zilberman and E. Hochman (1983), "Estimation of multicrop production functions", American Journal of Agricultural Economics 65(4):770-780. Kako, T. (1978), "Decomposition analysis of derived demand for factor inputs: The case of rice production in Japan", American Journal of Agricultural Economics 60(4):628-635. Kamien, M.I., and N.L. Schwartz (1991), Dynamic Optimization, 2nd edition (North-Holland, Amsterdam). Kawagoe, T., and Y. Hayami (1983), "The production structure of world agriculture: An intercountry crosssection analysis", The Developing Economies 21:189-206. Kawagoe, T., Y. Hayami and V.W. Ruttan (1985), "The intercountry agricultural production function and productivity differences among countries", Journal of Development Economics 19:113-132. Kislev, Y. (1966), "Overestimates of returns to scale in agriculture - a case of synchronized aggregation", Journal of Farm Economics 48(4):967-983. Kislev, Y., and W. Peterson (1996), "Economies of scale in agriculture: A reexamination of evidence", in: J.M. Antle and D. Sumner, eds., The Economics of Agriculture, Papers in honor of D. Gale Johnson, Vol. 2 (University of Chicago Press, Chicago) 156-170. Klein, L.R. (1953), A Textbook of Econometrics (Row, Peterson and Co, Evanston, IL). Koyck, L. (1954), Distributed Lags and Investment Analysis (North-Holland, Amsterdam). Kuroda, Y. (1987), "The production structure and demand for labor in postwar Japanese agriculture, 195282", American Journal of Agricultural Economics 69(2):328-337. Lachaal, L., and A.W. Womack (1998), "Impacts of trade and macroeconomic linkages on Canadian agriculture", American Journal of Agricultural Economics 80(3):534-542.
82
Y. Mundlak
Lansink, A.O., and S.E. Stefanou (1997), "Asymmetric adjustment of dynamic factors at the firm level", American Journal of Agricultural Economics 79(4): 1340-1351. Larson, D., R. Butzer, Y. Mundlak and A. Crego (1999), "A cross-country database for sector investment and capital," Working Paper No. 9903 (The Center for Agricultural Economic Research, Rehovot). Lan, LJ. (1978), "Applications of profit functions", in: M. Fuss and D. McFadden, eds., Production Economics: A Dual Approach to Theory and Applications, Vol. 1 (North-Holland, Amsterdam) 133-216. Lau, LJ., and EA. Yotopoulos (1972), "Profit, supply, and factor demand functions", American Journal of Agricultural Economics 54(1): 11-18. Leathers, H.D. (1991), "Allocable fixed inputs as a cause of joint production: A cost function approach", American Journal of Agricultural Economics 73(4): 1083-1090. Lee, H., and R.G. Chambers (1986), "Expenditure constraints and profit maximization in US agriculture", American Journal of Agricultural Economics 68(4):857-865. Lopez, R.E. (1980), "The structure of production and the derived demand for inputs in Canadian agriculture", American Journal of Agricultural Economics 62(1 ):38-45. Lopez, R.E. (1984), "Estimating substitution and expansion effects using a profit function framework", American Journal of Agricultural Economics 66(3):358-367. Lopez, R.E. (1985a), "Structural implications of a class of flexible functional forms for profit functions", International Economic Review 26(3):593-601. Lopez, R.E. (1985b), "Supply response and investment in the Canadian food processing industry", American Journal of Agricultural Economics 67(1):40-48. Lucas, R.E. (1967), "Optimal investment policy and the flexible accelerator", International Economic Review 8:78-85. Luh, Y.H., and S.E. Stefanou (1991), "Productivity growth in US agriculture under dynamic adjustment", American Journal of Agricultural Economics 73(4): 1116-1125. Luh, Y.H., and S.E. Stefanou (1996), "Estimating dynamic dual models under nonstatic expectations", American Journal of Agricultural Economics 78(4):991-1003. Marschak, J., and W.H. Andrews, Jr. (1944), "Random simultaneous equations and the theory of production", Econometrica 12(3&4):143-205. McFadden, D. (1978), "Cost, revenue, and profit functions", in: M. Fuss and D. McFadden, eds., Production Economics: A Dual Approach to Theory and Applications (North-Holland, Amsterdam) 3-109. McGuirk, A., and Y. Mundlak (1991 ), Incentives and Constraints in the Transformation of Punjab Agriculture, Research Report No. 87 (International Food Policy Research Institute, Washington, DC). McLaren, K.R., and RJ. Cooper (1980), "Intertemporal duality: Application to the theory of the firm", Econometrica 48(7): 1755-1762. Mittelhammer, R.C., D.L. Young, D. Tasanasanta and J.T. Dormelly (1980), "Mitigating the effects of multicollinearity using exact and stochastic restrictions: The case of an aggregate agricultural production function in Thailand", American Journal of Agricultural Economics 62:199-210. Moschini, G. (1988), "A model of production with supply management for the Canadian agricultural sector", American Journal of Agricultural Economics 70(2):318-329. Mundlak, Y. (1961), "Empirical production function free of management bias", Journal of Farm Economics 43(1):44-56. Mundlak, Y. (1963a), "Estimation of production and behavioral functions from a combination of cross-section and time-series data", in: C.E Christ et al., eds., Measurement in Economics: Studies in Mathematical Economics and Econometrics, in Memory of Yehuda Grunfeld (Stanford University Press, Stanford, CA) 138-166. Mundlak, Y. (1963b), "Specification and estimation of multiproduct production functions", Journal of Farm Economics 45(2):433-443. Mundlak, Y. (1964a), An Economic Analysis of Established Family Farms in Israel, 1953-1958 (The Fall( Project for Economic Research in Israel, Jerusalem). Mundlak, Y. (1964b), "Transcendental multiproduct production functions", International Economic Review 5(3):273-284.
Ch. 1: Productionand Supply
83
Mundlak, Y. (1966), "On the microeconomic theory of distributed lags", Review of Economics and Statistics 48(1):51~60. Mundlak, Y. (1967), "Long-run coefficients and distributed lag analysis: A reformulation", Econometrica 35(2):278-293. Mundlak, Y. (1968) "Elasticities of substitution and the theory of derived demand", Review of Economic Studies 35:225-236. Mundlak, Y. (1988), "Endogenous technology and the measurement of productivity", in: S.M. Capalbo and J.M. Antle, eds., Agricultural Productivity: Measurement and Explanation (Resources for the Future, Washington, DC) 316-331. Mundlak, Y. (1993), "On the empirical aspects of economic growth theory", American Economic Review 83(2):415-420. Mundlak, Y. (1996a), "Production function estimation: Reviving the primal", Econometrica 64(2):431-438. Mundlak, Y. (1996b) "On the aggregate agricultural supply", in: J.M. Antle and D. Sumner, eds., The Economics of Agriculture, Papers in honor of D. Gale Johnson, Vol. 2 (University of Chicago Press, Chicago) 101-120. Mundlak, Y. (1997), "Land expansion, land augmentation, and land saving", Benjamin H. Hibbard Memorial Lecture Series (Department of Agricultural and Applied Economics, University of Wisconsin, Madison, WI). Mundlak, Y. (2000), Agriculture and economic growth; Theory and Measurement (forthcoming). Mundlak, Y., D. Cavallo and R. Domenech (1989), Agriculture and Economic Growth in Argentina, 1913-84, Research Report No. 76 (International Food Policy Research Institute, Washington, DC). Mundlak, Y., and R. Hellinghansen (1982), "The intercountry agricultural production function: Another view", American Journal of Agricultural Economics 64(4):664-672. Mundlak, Y., and I. Hoch (1965), "Consequences of alternative specifications in estimation of Cobb-Douglas production functions", Econometrica 33(4):814-828. Mundlak, Y., D. Larson and R. Butzer (1999), "Rethinking within and between regression: The case of agricultural production functions," Annales D'Economie et de Statistique 55-56:475-501. Mundlak, Y., and A. Razin (1969), "Aggregation, index numbers and the measurement of technical change", Review of Economics and Statistics 51(2):166-175. Mundlak, Y., and A. Razin (1971), "On multistage multiproduct production functions", American Journal of Agricultural Economics 53(3):491-499. Mundlak, Y., and Z. Volcani (1973), "The correspondence of efficiency frontier as a generalization of the cost function", International Economic Review 14(1):223-233. Nadiri, M.I., and S. Rosen (1969), "Interrelated factor demand functions", American Economic Review 59(4):457-471. Neflove, M. (1956), "Estimates of the elasticities of supply of selected agricultural commodities", Journal of Farm Economics 38(2):496-509. Nerlove, M. (1958), "Distributed lags and estimation of long-run supply and demand elasticities: Theoretical considerations", Journal of Farm Economics 40(2):301-313. Nerlove, M. (1963), "Returns to scale in electricity supply", in: C.E Christ et al., eds., Measurement in Economics: Studies in Mathematical Economics and Econometrics, in Memory of Yehuda Grnnfeld (Stanford University Press, Stanford, CA) 167-200. Nguyen, D. (1979), "On agricultural productivity differences among countries", American Journal of Agricultural Economics 61(3):565-570. Ray, S.C. (1982), "A translog cost function analysis of US agriculture, 1939-77", American Journal of Agricultural Economics 64(3):490-498. Reder, M.W. (1943), "An alternative interpretation of the Cobb-Douglas function", Econometrica 11(3&4):259-264. Richards, T.J., and S.R. Jeffrey (1997), "The effect of supply management on Herd size in Alberta dairy", American Journal of Agricultural Economics 79(2):555-565.
84
Y. Mundlak
Rosegrant, M.W., and R.E. Evenson (1992), "Agricultural productivity and sources of growth in South Asia", American Journal of Agricultural Economics 74(3):757-761. Ruttan, V.W. (1956), "The contribution of technological progress to farm output: 1950-1975", Review of Economics and Statistics 38(1):61-69. Sadan, E. (1968), "Capital formation and growth in the Israeli cooperative farm", American Journal of Agricultural Economics 50:975-990. Sahota, G.S. (1968), "Efficiency of resource allocation in Indian agriculture", American Journal of Agricultural Economics 50:584-605. Schultz, T.W. (1953), Economic Organization of Agriculture (McGraw-Hill, New York). Shih, J.T., L.J. Hushak and N. Rask (1977), "The validity of the Cobb-Douglas specification in Taiwan's developing agriculture", American Journal of Agricultural Economics 59(3):554-558. Shumway, C.R. (1983), "Supply, demand, and technology in a multiproduct industry: Texas field crops", American Journal of Agricultural Economics 65(4):748-760. Shumway, C.R. (1995), "Recent duality contributions in production economics", Journal of Agricultural and Resource Economics 20(1): 178-194. Shumway, C.R., and W.E Alexander (1988), "Agricultural product supplies and input demands: Regional comparisons", American Journal of Agricultural Economics 70(1): 153-161. Shumway, C.R., R.D. Pope and E. Nash (1984), "Allocatable fixed inputs and jointness in agricultural production: Implications for modeling", American Journal of Agricultural Economics 66(1):72-78. Shumway, C.R., R.R. Saez and RE. Gottret (1988), "Multiproduct supply and input demand in US agriculture", American Journal of Agricultural Economics 70(2):330-337. Shumway, C.R., H. Talpaz and B.R. Beattie (1979), "The factor share approach to production function "estimation": Actual or estimated equilibrium shares?", American Journal of Agricultural Economics 61(3):561-564. Smith, V.E. (1945), "The statistical production function", Quarterly Journal of Economics 59(4):543-562. Solow, R.M. (1957), "Technical change and the aggregate production function", Review of Economics and Statistics 39(3):312-320. Taner, L.W. (1995), "Do New York dairy farmers maximize profits or minimize costs?", American Journal of Agricultural Economics 77(2):421429. Taylor, T.G., and M.J. Monson (1985), "Dynamic factor demands for aggregate southeastern United States agriculture", Southern Journal of Agricultural Economics 17(2): 1-9. Thijssen, G. (1996), "Farmers' investment behavior: An empirical assessment of two specifications of expectations", American Journal of Agricultural Economics 78(1): 166-174. Tintner, G. (1944), "A note on the derivation of production functions from farm records", Econometrica 12:26-34. Tintner, G., and O.H. Brownlee (1944), "Production functions derived from farm records", Journal of Farm Economics 26(3):566-571 (a correction in JFE Feb. 1953, 35:123). Treadway, A.B. (1969), "On rational entrepreneurial behavior and the demand for investment", Review of Economic Studies 36(2):227-239. Tweeten, L.G., and L. Quance (1969), "Positivistic measures of aggregate supply elasticities: Some new approaches", American Economic Review 59(2): 175-183. Ulveling, E.E, and L.B. Fletcher (1970), "A Cobb-Douglas production function with variable returns to scale", American Journal of Agricultural Economics 52(2):322-326. Varian, H.R. (1984), "The nonparametric approach to production analysis", Econometrica 52(3):579-597. Vasavada, U., and R.G. Chambers (1986), "Investment in US agriculture", American Journal of Agricultural Economics 68(4):950-960. Waiters, A.A. (1963), "Production and cost functions: An econometric survey", Econometrica 31(1-2): 1-66. Weaver, R.D. (1983), "Multiple input, multiple output production choices and technology in the US wheat region", American Journal of Agricultural Economics 65(1):45-56. Wolfson, R.J. (1958), "An econometric investigation of regional differentials in American agricultural wages", Econometrica 26(2):225-257.
Ch. 1:
Production and Supply
85
Working, E.J. (1927), "What do statistical demand curves show?", Quarterly Journal of Economics 41:212235. Wu, C.C. (1977), "Education in farm production: The case of Taiwan", American Journal of Agricultural Economics 59(4):699-709. Yotopoulos, P.A. (1967), Allocative Efficiency in Economic Development (Center of Planning and Economic Research, Athens). Yotopoulos, P.A., L.J. Lau and W.L. Lin (1976), "Microeconomic output supply and factor demand functions in the agriculture of the province of Taiwan", American Journal of Agricultural Economics 58(2):333-340.
Chapter 2
UNCERTAINTY, R I S K AVERSION, A N D R I S K MANAGEMENT FOR AGRICULTURAL PRODUCERS GIANCARLO MOSCHINI and DAVID A. HENNESSY Department of Economics, Iowa State University, Ames, IA
Contents
Abstract 1. Introduction 1.1. Uncertainty and risk in agriculture 1.2. Modeling issues
2. Decision making under uncertainty 2.1. Preferences over lotteries and the expected utility model 2.2. Risk aversion 2.3. Ranking distributions
3. The agricultural producer under uncertainty and risk aversion 3.1. Modeling price and production uncertainty 3.2. Static models under risk neutrality 3.3. Static models under risk aversion 3.3.1. Introduction of uncertainty 3.3.2. Marginal changes in environment 3.3.3. Uncertainty and cost minimization 3.4. Dynamics and flexibility under uncertainty
4. Selected empirical issues 4.1. Identifying risk preferences 4.2. Estimating stochastic sm~ctures 4.3. Joint estimation of preferences and technology 4.4. Economelric estimation of supply models with risk 4.5. Risk and equilibrium in supply and production systems 4.6. Programming models with risk 4.7. Technology adoption, infrastructure and risk
5. Risk management for agricultural producers 5.1. Hedging with price contingent contracts 5.1.1. Forward contracts and futures contracts 5.1.2. Options on futures 5.1.3. The time pattern of hedging
Handbook of Agricultural Economics, Volume 1, Edited by B. Gardner and G. Rausser © 2001 Elsevier Science B.V. All rights reserved
88 89 89 90 91 92 94 95 96 97 99 100 100 101 103 104 106 106 110 112 114 117 119 121 122 123 124 129 131
88 5.1.4. Hedgingand productiondecisions 5.1.5. The value of hedgingto farmers 5.2. Cropinstu-ance 5.2.1. Moralhazard 5.2.2. Adverseselection 5.2.3. Furtherdiscussion 6. Conclusion Acknowledgements References
G. Moschini and D.A. Hennessy
132 133 134 136 139 140 142 144 144
Abstract Uncertainty and risk are quintessential features of agricultural production. After a brief overview of the main sources of agricultural risk, we provide an exposition of expected utility theory and of the notion of risk aversion. This is followed by a basic analysis of agricultural production decisions under risk, including some comparative statics results from stylized models. Selected empirical topics are surveyed, with emphasis on risk analyses as they pertain to production decisions at the farm level. Risk management is then discussed, and a synthesis of hedging models is presented. We conclude with a detailed review of agricultural insurance, with emphasis on the moral hazard and adverse selection problems that arise in the context of crop insurance. J E L classification: Q12
Ch. 2: Uncertainty,Risk Aversion, and Risk Managementfor Agricultural Producers
89
1. Introduction Because of the complexities of physical and economic systems, the unfolding of most processes that we care about exhibits attributes that cannot be forecast with absolute accuracy. The immediate implication of this uncertainty for economic agents is that many possible outcomes are usually associated with any one chosen action. Thus, decision making under uncertainty is characterized by risk, because typically not all possible consequences are equally desirable. Although uncertainty and risk are ubiquitous, in agriculture they constitute an essential feature of the production environment and arguably warrant a detailed analysis. Considerable research has been devoted to exploring questions connected with the effects of uncertainty and risk in agriculture, and these efforts have paralleled related developments in the general economics literature. In this chapter we set out to review a number of these studies, especially as they relate to farm-level production decisions. To economize on our coverage of earlier work, and at the risk of not doing justice to some ground-breaking studies, we can refer to Dillon's (1971) survey as a starting point. In addition to providing an exposition of expected utility (EU) theory, which contributed to rooting subsequent studies in modern economic analysis, that survey provides an exhaustive account of previous studies of uncertainty and risk in agricultural economics. Subsequent useful compendia include Anderson, Dillon and Hardaker (1977), who consider a comprehensive set of applications of decision theory to agricultural production under uncertainty, and Newbery and Stiglitz (1981), who not only provide a thorough study of commodity price stabilization issues, but also analyze a number of problems that are relevant to the understanding of risk in agriculture. The aforementioned contributions have been accompanied and followed by considerable research that is relevant to our pursuit. As we undertake to provide a critical survey of these studies, we are mindful of the subjective bias and unintended oversights that an exercise such as this inevitably entails, a risk heightened in our case by the encompassing nature of the topic and the sheer volume of the relevant literature. We apologize for errors of omission and commission, and we hope that our review will nonetheless prove useful to the applied researcher. 1.1. Uncertainty and risk in agriculture Despite the fact that any taxonomy is somewhat arbitrary, it is useful to start by outlining the main sources of uncertainty and risk that are relevant from the point of view of the agricultural producer. First, there is what can be broadly defined as production uncertainty: in agriculture the amount and quality of output that will result from a given bundle of inputs are typically not known with certainty, i.e., the production function is stochastic. This uncertainty is due to the fact that uncontrollable elements, such as weather, play a fundamental role in agricultural production. The effects of these uncontrollable factors are heightened by the fact that time itself plays a particularly important role in agricultural production, because long production lags are dictated by the biological processes that underlie the production of crops and the growth of animals. Although
90
G. Moschini and D.A. Hennessy
there are parallels in other production activities, it is fair to say that production uncertainty is a quintessential feature of agricultural production. Price uncertainty is also a standard attribute of farming activities. Because of the biological production lags mentioned above, production decisions have to be made far in advance of realizing the final product, so that the market price for the output is typically not known at the time these decisions have to be made. Price uncertainty, of course, is all the more relevant because of the inherent volatility of agricultural markets. Such volatility may be due to demand fluctuations, which are particularly important when a sizable portion of output is destined for the export market. Production uncertainty as discussed earlier, however, also contributes to price uncertainty because price needs to adjust to clear the market. In this process some typical features of agricultural markets (a large number of competitive producers, relatively homogeneous output, and inelastic demand) are responsible for generating considerable price volatility, even for moderate production shocks. Additional sources of uncertainty are relevant to farming decisions when longer-term economic problems are considered. Technological uncertainty, associated with the evolution of production techniques that may make quasi-fixed past investments obsolete, emerges as a marked feature of agricultural production. Clearly, the randomness of new knowledge development affects production technologies in all sectors. What makes it perhaps more relevant to agriculture, however, is the fact that technological innovations here are the product of research and development efforts carried out elsewhere (for instance, by firms supplying inputs to agriculture), such that competitive farmers are captive players in the process. Policy uncertainty also plays an important role in agriculture. Again, economic policies have impacts on all sectors through their effects on such things as taxes, interest rates, exchange rates, regulation, provision of public goods, and so on. Yet, because agriculture in many countries is characterized by an intricate system of government interventions, and because the need for changing these policy interventions in recent times has remained strong (witness the recent transformation of key features of the agricultural policy of the United States and the European Union, or the emerging concerns about the environmental impacts of agricultural production), this source of uncertainty creates considerable risk for agricultural investments.
1.2. Modeling issues Two concepts of paramount importance in economic modeling are optimization (the rational behavior of economic agents) and equilibrium (the balancing of individual claims in a market setting). The application of both of these concepts raises problematic issues when uncertainty is involved. In particular, to apply the powerful apparatus of optimization to individual choices under uncertainty one needs to determine what exactly is being optimized. Although a universally satisfactory answer to this question is far from obvious, the most widely used idea is that agents exposed to uncertainty and risk maximize expected utility. This paradigm represents the culmination of a research program that dates back to Bernoulli (1738), and rests on some compelling assumptions about
Ch. 2:
Uncertainty, Risk Aversion, and Risk Management for Agricultural Producers
91
individual choice. Most of the applications that we will review rely on the EU model (indeed, often some restricted version of it). Thus, in what follows we will briefly review the EU hypothesis before we proceed with a survey of applications. We should note, however, that despite its normative appeal, the EU framework has recently come under intense scrutiny because of its inability to describe some features of individual behavior under risk, and a number of generalizations of the EU model have been proposed [Machina (1987), Quiggin (1993)]. A modeling strategy that recurs in the applied literature is the distinction between uncertainty and risk attributed to Knight (1921). According to this view, risk arises when the stochastic elements of a decision problem can be characterized in terms of numerical objective probabilities, whereas uncertainty refers to decision settings with random outcomes that lack such objective probabilities. With the widespread acceptance of probabilities as subjective beliefs, Knight's distinction between risk and uncertainty is virtually meaningless and, like other authors [e.g., Hirshleifer and Riley (1992)], we will ignore it here. 1 Thus, the notions of uncertainty and risk are interchangeable in what follows, although, like Robison and Barry (1987), we tend to use the word uncertainty mostly to describe the environment in which economics decisions are made, and the word risk to characterize the economically relevant implications of uncertainty.
2. Decision making under uncertainty Economic models of individual choice are necessarily rooted in the assumption of rationality on the part of decision makers. Perhaps the most common and widely understood such model is given by the neoclassical theory of consumer choice under certainty. The primitive assumption is that there is a preference ordering on commodity bundles that satisfies the consistency requirements of completeness and transitivity. These basic rationality postulates, coupled with the assumption of continuity (a hardly avoidable and basically harmless mathematical simplification), allow consumer choices to be characterized in terms of an ordinal utility function, a construct that enhances the analytical power of the assumptions. Choice under uncertainty could be characterized within this elementary setting, given minor modification of the original assumptions. For example, as in Debreu (1959), the standard preference ordering of neoclassical consumption theory could be applied to state-contingent commodity bundles. The analysis can then proceed without reference to the probability of the various states of nature. Whereas such an approach has proven useful for some problems [Arrow (1964), Hirshleifer (1966)], for a number of other cases, including applications typically of interest to agricultural economists, a more specific framework of analysis is desirable. By explicitly recognizing the mutually exclusive nature of alternative random consequences,
! We should note, however, that in some cases this approach is not totally satisfactory,as illustrated for exampleby the so-calledEllsberg paradox [Ellsberg(1961)].
92
G. Moschini and D.A. Hennessy
one can get a powerful representation of decision making under uncertainty. This leads to the so-called EU model of decision under uncertainty, arguably the most important achievement of modern economic analysis of individual behavior. Although there exist a number of lucid expositions of this model [for a textbook treatment, see Mas-Colell et al. (1995, Chapter 6)], we present (somewhat informally) the main features of EU theory, to set the stage for the review of applications that follows.
2.1. Preferences over lotteries and the expected utility model Let A represent the set of all PoSsible actions available to decision makers, and let S represent the set of all possible states of nature. The specific action chosen by the agent and the particular state of nature that is realized (with the former choice being made prior to the resolution of uncertainty about the true state of nature) determine the outcomes (consequences) that the agent cares about. In other words, consequences are random variables as given by the function c : S x A --+ C, where C is the set of all possible consequences. For example, C could be the set of all possible commodity bundles as in standard consumer theory, in which case C = ~ _ . Alternatively, as in many applications, it is monetary outcomes that are of interest to the decision makers, in which case one can put C = R. Suppose for simplicity that the set C is finite, and that there are N possible consequences. Given an objectively known probability for each state of nature, then choosing a particular action will result in a probability distribution (a lottery, a gamble) over outcomes. Formally, one can define a lottery as a probability list L --= (~l, ~2 . . . . . /~U) such that ~i is the probability (likelihood) that consequence Ci E C will arise (of course, ~i C [0, 1] and Y~i ~i = 1). In this setting, primitive preferences are represented by a preference relation ~ defined over the set of all possible lotteries 12. Assuming that this relation is rational (complete and transitive) and satisfies a specific continuity assumption, then all lotteries can be ranked by a function V : L --+ R in the sense that, for any two lotteries L and L I, we have L ~ U ¢~ V(L) >. V(U). Because the underlying assumption is that the decision maker is concerned only with the ultimate consequences, compound lotteries in this setting are always equivalent to the corresponding reduced lottery. Thus, for example, a gamble that gives lottery L with probability )~ and lottery U with probability (1 - ;~) is equivalent to a simple lottery whose probabilities are given by the mixture )~L ÷ (1 - )~)L zr. So far, the parallel with standard consumer theory is quite close [in particular, for example, V(L) is an ordinal function]. To get the EU model, a further assumption is required at this point, namely the "independence axiom" [Samuelson (1952)]. This condition requires that, if we consider the mixture of each of any two lotteries L and L I with another lottery U 1, the preference ordering on the two resulting lotteries is independent of the particular common lottery U r. That is, for any L, U and U z, and any )~ e (0, 1),
L ~ L' 4:~ LL + (1 - 2.)L M~ XL' + (1 - )~)LZ'.
(2.1)
Ch. 2." Uncertainty, Risk Aversion, and Risk Management for Agricultural Producers
93
One may note that an equivalent assumption in the standard choice problem of consumer theory would be very restrictive, which is why it is seldom made in that context. Here, however, the independence assumption is quite natural because of a fundamental feature of decision problems under uncertainty: consequences are mutually exclusive. 2 The independence axiom, coupled with the other standard rational choice assumptions, has the remarkable implication that there exists a utility function defined over consequences, U : C -+ ~R, such that N
N
i=1
i=1
(2.2)
where again, £i is the probability that consequence ci will attain under L and Ui is the probability that consequence ci will attain under U. In other words, with the independence axiom, the utility function over lotteries can always be represented as the mathematical expectation of a utility function defined over consequences, that is V (L) = E[U (c)] where El.] is the mathematical expectation operator. As such, the utility function V(L) is linear in probabilities. The function U(c) is usually referred to as the von Neumann-Morgenstern (vNM) utility function. 3 This vNM utility function U(c) is monotonically increasing and is cardinal in the sense that it is defined up to an increasing finear transformation [that is, if U (c) represents the preference relation >~, then any U(c) =- ot + flU(c), with 13 > 0, provides an equivalent representation of this relation]. When the outcomes of interest are described by continuous random variables with joint cumulative distribution function F(c), the EU model implies that V ( F ) = f U ( c ) d F ( c ) . In conclusion, in the EU model the problem of selecting the action that induces the most preferred probability distribution reduces to that of maximizing the expected utility of outcomes. Versions of the EU model more general than the one just discussed are available. Perhaps the most important is the EU model with subjective probability developed by Savage (1954). 4 In this framework one does not assume that the probabilities of various states of the world are objectively given. Rather, the existence of probabilities for the states of nature and of a vNM utility function for the consequences are both implied by a set of axioms. Prominent among these is the "sure-thing" axiom, roughly equivalent to the independence condition discussed earlier. A crucial element for this approach is that probabilities are inherently subjective, an idea pioneered by de Finetti (1931).
2 Despite its theoretical appeal, the empirical validity of the independence axiom has been questioned, especially in light of the so-called Allais paradox [Allais (1953)]. 3 This convention recognizes these authors' pioneering contribution to the development of the EU model in [von Neumann and Morgenstern (1944)]. But others call U(-) the Bernoulli utility function, in recognition of Daniel Bemoulli's solution of the St. Petersburg paradox [Bernoulli (1738)], which anticipated some of the features of the EU model. 4 Anscombe and Aumann (1963) provide an easier (albeit somewhat different) set-up within which one can derive Savage's subjective EU model.
94
G. Moschini and D.A. Hennessy
2.2. Risk aversion The EU model allows us to capture in a natural way the notion of risk aversion, which is a fundamental feature of the problem of choice under uncertainty. This notion is made precise when the consequences that matter to the decision maker are monetary outcomes, such that the vNM utility function is defined over wealth, say U(w) where w E 1R is realized wealth. In a very intuitive sense, a decision maker is said to be risk averse if, for every lottery F(w), she will always prefer (at least weakly) the certain amount E[w] to the lottery F ( w ) itself, i.e., u [ f w d F ( w ) ] >~ U(w) d F ( w ) [Arrow (1965), Pratt (1964)]. But by Jensen's inequality, this condition is equivalent to U(w) being concave. Thus, concavity of the vNM utility function provides the fundamental characterization of risk aversion. In many applied problems it is of interest to quantify risk aversion. For example, when can we say that an agent a is more risk averse than another agent b? Given the representation of risk aversion in terms of the concavity of U(.), then we can say that agent a is globally more risk averse than agent b if we can find an increasing concave function g (.) such that Ua = g(Ub), where Ui denotes the utility function of agent i (i = a, b). An interesting question, in this context, concerns how the degree of risk aversion of a given agent changes with the level of wealth. For this purpose, two measures of risk aversion that have become standard are the Arrow-Pratt coefficient of absolute risk aversion A(w) and the Arrow-Pratt coefficient of relative risk aversion R(w) [Arrow (1965), Pratt (1964)]. Because concavity of U(w) is equivalent to risk aversion, the degree of concavity of U(w), as captured for example by U1~(w), is a candidate to measure the degree of risk aversion. But because U(w) is defined only up to an increasing linear transformation, we need to normalize by U ( w ) > 0 to obtain a measure that is unique for a given preference ordering. Thus, the coefficient of absolute risk aversion is defined as A(w) = -U~1(w)/U~(w).5 As is apparent from its definition, absolute risk aversion is useful for comparing the attitude of an agent towards a given gamble at different levels of wealth. It seems natural to postulate that agents will become less averse to a given gamble as their wealth increases. This is the notion of decreasing absolute risk aversion (DARA), i.e., A(w) is a decreasing function of w [when A(w) is merely nonincreasing in w, the notion is labeled nonincreasing absolute risk aversion (NIARA)]. As we shall see, most comparative statics results of optimal choice under uncertainty rely on this condition. Sometimes, however, it is interesting to inquire about the attitude of risk-averse decision makers towards gambles that are expressed as a fraction of their wealth. This type of risk preference is captured by the coefficient of relative risk aversion R(w) =-- wA(w). Unlike the case of absolute risk aversion, there are no compelling a priori reasons for
f
5 Note that A(w) can also be used to compare the risk aversion of two agents. If Aa (w) and A b (w) are the coefficients derived from the vNM utility functions Ua and Ub, respectively, then agent a is more risk averse than agent b if Aa (w) >/Ab(w) for all w. This characterization is equivalent to that given earlier in terms of Ua being an increasing concavetransformation of Ub.
Ch. 2: Uncertainty,RiskAversion, and RiskManagementfor AgriculturalProducers
95
any particular behavior of R(w) with respect to w. A n assumption that is sometimes invoked is that o f nonincreasing relative risk aversion (NIRRA), implying that an agent should not become more averse to a gamble expressed as a fixed percentage of her wealth as the level of wealth increases. 6 Of some interest for applied analysis are utility functions for which A(w) and R(w) are constant. The constant absolute risk aversion (CARA) utility function is given by U(w) ----- e -xw, where )~ is the (constant) coefficient of absolute risk aversion. The constant relative risk aversion (CRRA) utility function is given by U (w) = (w 1- p ) / (1 p) if p 5~ 1, and by U(w) = log(w) if p = 1, where p is the (constant) coefficient of relative risk aversion. 7
2.3. Ranking distributions As discussed, the choice problem under uncertainty can be thought of as a choice among distributions (lotteries), with risk-averse agents preferring distributions that are "less risky". But how can we rank distributions according to their riskiness? Earlier contributions tried to provide such ranking based on a univariate measure of variability, such as the variance or standard deviation [for example, the portfolio theory of Markowitz (1952) and Tobin (1958) relied on a mean-standard deviation approach]. But it was soon determined that, for arbitrary distributions, such ranking is always consistent with EU only if the v N M utility function is quadratic. Because of the restrictiveness of this condition, a more general approach has been worked out in what are known as the stochastic dominance conditions [Hadar and Russell (1969), Hanoch and Levy (1969), Rothschild and Stiglitz (1970)]. A distribution F(w) is said tofirst-order stochastically dominate (FSD) another distribution G(w) if, for every nondecreasing function U(-), we have
F
U(w) d F ( w ) >~
S
U(w) d G ( w ) .
(2.3)
It can be shown that under F S D one must have F(w) ~O, the first-order condition (3.8) implies that the expression fo Uz[']Za(')dF(e) is never positive because of the positivity of marginal utility and because Za (') is negative at low e and increases to be positive at high e. Therefore, given A < 0, Q is positive if d J(., v)/dv 0). All other things equal, if fl shifts the distribution of payoffs rightward (z~(.) ~> 0), as would be the case with a reduction in fixed costs K in payoff specifications (3.1) or (3.2), and if preferences are N I A R A (Az[-] ~< 0), then a increases. When/5 = fll + (5 - 5-)fl2, then z/~l (') ~> 0 for specification (3.1). Because Zany(') >>-O, both coupling and wealth effects act to increase optimal a, and this is the Sandmo (1971) result that NIARA is sufficient for a shift in mean price to increase production. Notice that because zeal (.) = 0, the second part of dJ(.)/dv may be ignored. Whereas 131 has both wealth and coupling effects, it is easy to describe a wealth effect that does not also involve coupling. Setting z (a, 13, 5) = [ill + (5 - g)fl2Ja - C(a, r) - K + fi3 G(ao), an increase in 133 or a decrease in K induces an increase in optimal a under NIARA. Coupling may also occur without wealth effects, although this case is somewhat more difficult to show. The second part, A[.]z~e(.), is the insurance effect (B). If the favorable exogenous shift acts to stabilize income, that is if z~e(.) 0. The similarity of wealth (i.e., risk aversion) and insurance effects has been discussed in detail by Jewitt (1987). Because of the price uncertainty inherent in agricultural production environments, the effect of an increase in/32 for the specification (3.1), where/3 =/31 + (5 - g)/32, is of particular importance. From ze~2 = 1, it can be seen that the/32 parameter has a negative insurance effect. It has already been concluded, however, that the coupling effect of/32, that is Za~2('), does not have a uniform sign. Thus, although it may be intuitive to expect that an increase in/32 would decrease optimal a, to determine that requires more work in addition to the N I A R A assumption [Batra and Ullah (1974), Ishii (1977)]. Since changing the parameter/32 ~> 0 in this setting does not cover the set of all Rothschild and Stiglitz mean-preserving spreads, the above results do not demonstrate that all mean-preserving spreads of price decrease the optimal choice for the model in (3.1). Whereas Meyer and Ormiston (1989), Ormiston (1992), and Gollier (1995), among others, have made advances toward identifying precisely the set of spreads that act to decrease production for N I A R A and various conditions on the payoff function, this problem has not yet been completely solved.12 3.3.3. Uncertainty and cost minimization It is well known that profit maximization is predicated upon satisfaction of the cost minimization assumption. Does cost minimization continue to hold under risk, when the objective is expected utility maximization? It turns out that the answer is yes, provided that "cost minimization" is suitably defined. Consider the competitive firm where the input vector x is chosen to maximize E[U (w0 + #)], where # = R(x, ~) - rx. Here R(x, 5) is a revenue profile (that can accommodate both price and/or production uncertainty) and 5 denotes the source of revenue uncertainty. Pope and Chavas (1994) show that, if the revenue profile satisfies the restriction R(x, 5) = K O p ( x ) , ~), where 7e(x) is (possibly) vector-valued, then the relevant cost function can be written as C(q ~, r), where q7~ is the vector of conditioning values corresponding to the functions ~ (x). Hence, technical efficiency is satisfied in the sense that the EU maximizing choice of x is consistent with the cost minimizing means of obtaining some (vector) level of ~ (x). The simplest special case arises with multiplicative production risk, when R(x, ~) = H ( x ) 5 . As anticipated in Section 3.1, in such a case the cost function is written as C(~-, r), where ~ is
12 The conclusions drawn thus far are, of course, only relevant for the given context. Noting that peasants in less developed countries often consume a significant fraction of their own production, Finkelshtain and Chalfant (1991) concludedthat production and consumptiondecisions cannotbe modeled separately for these agents. Their generalization of the Sandmo model suggests that production may plausibly increase under an increase in price uncertainty.
104
G. Moschini dnd D.A. Hennessy
expected output. Thus, the relevant cost function for this special case is rather standard, with the expected output level playing the role of a deterministic output level under certainty. More generally, however, a vector of conditioning values will be needed. For example, if there is no price risk but the production function has the stochastic form suggested by Just and Pope (1978) (to be discussed further in Section 4.2), then revenue is written as R = p M (x) + p [ V (x) ] 1/2g with E [~] = 0. It follows that the EU-consi stent cost function here can be written as C(~, ~r2, r), where ~ is a level of expected output [corresponding to the function M(x)] and a2 is a level of output variance [corresponding to the function V(x)]. That cost minimization always holds for EU maximizers, even when the revenue profile does not satisfy the restriction invoked by Pope and Chavas (1994), is shown by Chambers and Quiggin (1998). Their approach is best illustrated for the production uncertainty case in which the random variable g takes on a finite number (say N) of values. Given the stochastic production function G(x, ~), then realized output for any given realization of the random variable ( e i , s a y ) is qi = G ( x , el). If £i denotes the probability of ei occurring, then the producer's EU problem is N
Max2~iU(pG(x,
e i ) - r x ).
(3.12)
i=1
Now define a cost function C(ql . . . . . qN, r) as
C(ql, q2 . . . . . qN, r) =--Min{rx: qi 0. Further analysis reveals that this condition is equivalent to the requirement that O[Rx~x2(.)/Rx2x2 (.)]/Ox2 0 is necessary for DARA. For the related, but distinct, coefficient of absolute prudence (-U~z(.)/UI(.)) see Kimball (1990). 16 This means that -7rU~r(zr + wo)/U~(zr + wo) is invariant to changes in Jr for the level of w 0 in question.
110
G. Moschini and D.A. Hennessy
4.2. Estimating stochastic structures As mentioned earlier, production risk is an essential feature of agriculture, and estimation of such stochastic production structures has obvious immediate interest for farm management as well as to address agricultural policy issues. For example, production uncertainty has implications for the implementation of crop insurance. Also, environmental externalities such as water contamination and ecosystem destruction may sometimes be traced back to the use of such agricultural inputs as nitrogen and pesticides; production uncertainty, together with risk aversion, may increase application of these inputs. Existing statistical procedures for studying relationships between stochastic distributions have tended to emphasize stochastically ordered comparisons, such as first- and second-degree dominance, between elements in a set of distributions. But economists, especially agricultural economists, are often interested in conditional relationships. To reconstruct nonparametric stochastic relationships between crop yield and input use would often require volumes of data beyond that usually available to analysts. Further, as the literature on the impacts of stochastic shifts on decisions has shown, the necessary and the sufficient conditions for a stochastic shift to have a determinate impact on the decisions of a meaningful class of decision makers are generally not among the simpler types of stochastic shifts. The complexity of the decision environment is substantially reduced if one can treat technology as being nonrandom. If one is primarily concerned with price uncertainty, then it might be convenient to assume deterministic production. Thus, one can estimate the distribution of the realized random element without regard to the choices made. In other cases, however, it is not possible to simplify the decision environment in this way. Although random yield - the consequence of interactions between choices and random weather variables - can be measured, it would be more difficult to measure and aggregate in a meaningful manner the various dimensions of weather. In such a case, it is more convenient to estimate the input-conditioned distribution of yield. Although they do not lend themselves to estimating or testing for general production function relations, existing stochastic ordering methods can be useful in testing for the nature of and impacts of exogenous stochastic shifts in, say, the distribution of output price, and for studying discrete decisions such as the adoption of a new technology. Although studies applying stochastic dominance methods to agricultural problems are numerous [e.g., Williams et al. (1993)], most of these studies compare point estimates of the distributions and do not consider sampling errors. Tolley and Pope (1988) developed a nonparametric permutation test to discern whether a second-order dominance relationship exists. More recently, Anderson (1996) used the nonparametric Pearson goodness-of-fit test on Canadian income distribution data over the years 1973 to 1989 to investigate, with levels of statistical confidence, whether first-, second-, and third-order stochastic dominance shifts occurred as time elapsed. For input-conditioned output distributions, Just and Pope (1978) accounted for heteroskedasticity by developing a method of estimating a two-moment stochastic produc-
Ch. 2: Uncertainty,Risk Aversion, and Risk Managementfor Agricultural Producers
111
tion function by three-stage non linear least squares techniques. The function is of the form dl = M ( x )
+ [g(x)]l/2~,
(4.1)
where q is output, E[~] = 0, Var[~] = 1, and x is a vector of input choices. The functions M ( x ) and V ( x ) determine the conditional mean and variance of q, respectively, and can be chosen to be sufficiently flexible to meet the needs of the analysis. Just and Pope (1979) applied their method to Day's (1965) corn and oats yield-fertilization data set, and found the results generally, but not totally, supportive of the hypothesis that an increase in fertilization increases the variance of output. Their readily estimable approach has proven to be popular in applied analyses. For example Traxler et al. (1995) used the approach in a study of the yield attributes of different wheat varieties in the Yaqui Valley (Mexico), and found that whereas earlier varietal research appeared to emphasize increasing mean yield, later research appeared biased toward reducing yield variance. Suggesting that mean and variance may not be sufficient statistics to describe stochastic production, Antle and Goodger (1984) used an approach due to Antle (1983) to estimate an arbitrarily large number of input-conditioned moments for large-scale California milk production. They rejected the statistical hypothesis that input-conditioned mean and variance are sufficient statistics. An interesting simulation finding was that a CARA decision maker facing the estimated technology substantially increased dairy rations relative to a risk-neutral decision maker. This suggests that the marginal risk premium in Ramaswami (1992) may be negative on occasion. Nelson and Preckel (1989) identified the need for a flexible approach to estimating parametric yield distributions when accommodating skewness is important. Gallagher (1987), among others, has observed negative skewness for crop yields. The Just-Pope approach is insufficiently flexible, whereas the Antle-Goodger method, which is nonparametric, may be inefficient. Finding inspiration in Day's (1965) suggestion that the beta distribution would likely fit most yield distributions quite well, Nelson and Preckel conditioned beta distribution parameters on input choices. The output density function is then r(o~ + t ) (q - qmin)c~-l(qmax _ q)/~-I f ( q Ix) = F(ol)r(fl) (qmax _ qmin)e+/~-i '
(4.2)
where F(.) is the gamma function, output q is supported on the interval [qmin, qmax], and the distribution parameters are conditional on inputs, i.e., a = a ( x ) and/~ =/3(x). For field-level corn yields in five Iowa counties over the period 1961 to 1970, Nelson and Preckel set qmin = 0, and let both oe(x) and/3(x) be Cobb-Douglas functions of nitrogen, phosphorus, potassium, field slope, and soil clay content. Using a two-stage maximum likelihood method, they found that the marginal effects of nitrogen, phosphorus, and potassium on skewness, variance, and even mean were mixed in sign.
112
G. Moschini and D.A. Hennessy
The maximum likelihood approach to estimating parameterized conditional densities has proven to be quite popular. A gamma distribution relationship between applied nitrogen levels and late spring soil nitrate levels has been used in Babcock and Blackmer (1992) to study the effects of information concerning spring soil nitrate levels on subsequent side-dressing and on expected profit; a beta distribution has been applied by Babcock and Hennessy (1996) to study input use in the presence of crop insurance. A different line of inquiry has sought to model the nonnormality of crop yield distributions by estimating transformations of the normal distribution. Taylor (1990) employed a hyperbolic trigonometric transformation to deviations from a linear yield trend estimation on corn, soybean, and wheat crops. Moss and Shonkwiler (1993) and Ramfrez (1997) have extended this approach to accommodate stochastic yield trends and multivariate distributions, respectively. But the presumption that yields are not normally distributed has been called into question by Just and Weninger (1999), who criticize a number of features of statistical analyses implemented by previous studies and conclude that the empirical evidence against normality is weak. Stochastic production has implications for the estimation of dual representations of production technologies. For example, as discussed in Section 2.3.3, when the production function is affected by multiplicative risk and producers maximize expected utility the relevant cost function is C(~-, r), where ~ is expected output. When the stochastic production function is written more generally as G(x, g), the relevant cost function still has the structure C(~, r) if producers are risk neutral (they maximize expected profits). 17 Pope and Just (1996) call such a function the "ex ante cost function", and convincingly argue that a number of previous studies have resulted in inconsistent estimates of technological parameters because they have estimated a standard cost function C(q, r) (conditional on realized output q) when in fact they should have been estimating C(~, r). Estimation of the ex ante cost function C(~, r)is problematic, on the other hand, because it is conditional on expected output ~, which is not observable. The solution proposed by Pope and Just (1996) entails estimating ~-jointly with the structure of the ex ante cost function. The specific procedure that they suggest fails to achieve consistent estimation of technological parameters because it does not address the nonlinear errors-in-variables problem that typically arises in this context [Moschini (1999)]. But by exploiting the full implications of expected profit maximization; Moschini (1999) shows that it is possible to effectively remove the errors-in-variables problem and obtain consistent estimation of the ex ante cost function parameters. 4.3. Joint estimation of preferences and technology Most research studies considered thus far have sought to identify risk preferences without estimating the source of randomness, or they have sought to estimate the source
17 Of course, in such a case the parametersof the cost function C (~, r) may include parametersof the distribution of the randomvariable~.
Ch. 2:
Uncertainty, Risk Aversion, and Risk Management for Agricultural Producers
113
of randomness without simultaneously estimating the risk preference structure. Those papers that have simultaneously identified risk preferences and the source of randomness [e.g., Moscardi and de Janvry (1977)) or Antle (1987)] have treated either one or both components in a rather elementary manner. Separating the estimation of the two structures is econometrically inefficient to the extent that a joint estimation imposes cross-estimation restrictions and accommodates error correlations. Using a Just-Pope technology with Cobb-Douglas mean and variance functions together with a CARA risk preference structure, cross-equation restrictions and a nonlinear three-stage least squares estimator, Love and Buccola (1991) applied a joint estimation for Iowa corn and soybean production. The data pertained to three of the five counties studied by Nelson and Preckel (1989). Love and Buccola found considerable variation in the estimated coefficient of risk aversion across the three Iowa counties under consideration. Concerning technology, they contrasted their results with a straightforward Just-Pope estimation and with the Nelson and Preckel analysis to find that each estimated similar technology structures. The Love and Buccola approach is restrictive in the sense that CARA was imposed. Chavas and Holt (1996) developed a joint estimation method that is able to test for CARA or DARA. Applying their estimator to corn and soybean acreage allocation in the United States, and on a data set much the same as that used in their 1990 work, they assumed that the production technology was a quadratic function of allocated acres and that the utility function is u(zrt, t) = exp(c~0 + OllZ + Cg2Z2 -~-C~3t) dz, where L is a lower bound on profit realizations, t is time, the ~ are parameters to be estimated, rrt is profit in year t, and z is a dummy variable of integration. Their analysis found strong statistical evidence for the presence of downside risk aversion and for rejecting CARA in favor of DARA. Although the approach by Chavas and Holt does generalize the representation of risk preferences, the assumed technology was not flexible in the Just-Pope sense. Further, their specification can say little about the impact of relative risk aversion. Using Saha's (1993) expo-power utility specification, U[zr] = - exp(-/~zr ~) where ~ and/3 are parameters to be estimated, Saha, Shumway and Talpaz (1994) assumed a JustPope technology and jointly estimated the system using maximum likelihood methods. Data were for fifteen Kansas wheat farms over the four years 1979 to 1982, and there were two aggregated input indices in the stochastic technology (a capital index and a materials index). The results supported the hypotheses of DARA and increasing relative risk aversion (IRRA). Also, the materials index was found to be risk decreasing, so riskaverse agents may have a tendency to use more fertilizer and pesticides than risk-neutral agents. Before leaving the issue of risk estimation, a comment is warranted about subsequent use of the estimates. There may be a tendency on the part of modelers engaged in policy simulation to use without qualification risk preference structures that were identified in previous research. Newbery and Stiglitz (1981, p. 73) have shown that caution is warranted in accommodating the particular circumstances of the simulation exercise. One must ensure that the chosen risk preference structure is consistent with reasonable
f~'
G. Moschini and D.A. Hennessy
114
levels of risk premia for the problem at hand. The set of coefficients of absolute risk aversion that give reasonable risk premia vary from problem to problem. 4.4. Econometric estimation of supply models with risk One of the most widely agreed upon results from the theory of the firm under price uncertainty is that risk affects the optimal output level. Normally, the risk-averse producer is expected to produce less than the risk-neutral producer, ceteris paribus, and the risk-averse producer will adjust output to changing risk conditions (e.g., decrease production as risk increases). Econometric studies of agricultural supply decisions have for a long time tried to accommodate these features of the theory of the firm. There are essentially two reasons for wanting to do so: first, to find out whether the theory is relevant, i.e., to "test" whether there is response to risk in agricultural decisions; second, assuming that the theory is correct and risk aversion is important, accounting for risk response may improve the performance of econometric models for forecasting and/or policy evaluation, including welfare measurement related to risk bearing. To pursue these two objectives, a prototypical model is to write supply decisions at time t as yt = ~o + X ~ l + fl2[~t "~- f13~? "q- et,
(4.3)
where y denotes supply, tx denotes the (subjective) conditional expectation of price, O-2 denotes the (subjective) conditional variance of price, x represents the vector of all other variables affecting decisions, e is a random term, t indexes observations, and (/~0,/~l,/~2,/~3) are parameters to be estimated (/~1 is a vector). Clearly, this formulation simplifies theory to the bone by choosing a particular functional form and, more important, by postulating that mean and variance can adequately capture the risk facing producers. Whereas more sophisticated models may be desirable, from an econometric point of view Equation (4.3) is already quite demanding. In particular, the subjective moments of the price distribution/xt and a2 are unobserved, and thus to implement Equation (4.3) it is necessary to specify how these expectations are formed. The specification of expectations for the first moment is a familiar problem in econometric estimation. Solutions that have been proposed range from naive expectations models (where /xt = pt-1), to adaptive expectations (where #t is a geometrically weighted average of all past prices), to rational expectations (where #t is the mathematical expectation arrived at from an internally consistent model of price formation, for example). A review of price expectations formation for price levels is outside the scope of this chapter, but we note that, not surprisingly, parallel issues arise in the context of modeling variance. Behrman (1968) allowed for price risk to affect crop supply in a developing country by measuring cr2 as a three-year moving average (but around the unconditional mean of price). Similar ad hoc procedures have been very common in other studies, although often with the improvement of a weighted (as opposed to simple)
Ch. 2:
Uncertainty, Risk Aversion, and Risk Management for Agricultural Producers
115
average of squared deviations from the conditional (as opposed to unconditional) expectation of the price level [e.g., Lin (1977), Traill (1978), Hurt and Garcia (1982), Sengupta and Sfeir (1982), Brorsen et al. (1987), Chavas and Holt (1990, 1996)]. A more ambitious and coherent framework was proposed by Just (1974, 1976), whereby first and second moments of price are modeled to the same degree of flexibility by extending Nerlove's (1958) notion of adaptive expectations to the variance of price. This procedure has been used in other studies, including [Pope and Just (1991), Antonovitz and Green (1990), and Aradhyula and Holt (1990)]. More recently, advances have been made by modeling the time-varying variance within the autoregressive conditional heteroskedasticity (ARCH) framework of [Engle (1982)], as in [Aradhyula and Holt (1989, 1990), Holt and Moscbini (1992), and Holt (1993)]. The empirical evidence suggests that risk variables are often significant in explaining agricultural production decisions. The early work by Just (1974), as well as some other studies, has suggested that the size of this supply response to risk may be quite large, but the quantitative dimension of this risk response is more difficult to assess because results are typically not reported in a standardized manner. For example, an interesting question in the context of supply response concerns the size of the likely output contraction due to risk. As model (4.3) suggests, an approximate estimate of this output reduction (in percentage terms) is simply given by the elasticity of supply with respect to the price variance cr2, but this basic statistic often is not reported. As a yardstick, however, we note that for broiler production Aradhyula and Holt (1990) found a long-run price variance elasticity of -0.03, whereas for sow farrowing, the comparable long-run elasticity estimated by Holt and Moschini (1992) was -0.13. Although such estimates may suggest a fairly sizeable production response to the presence of risk, caution is in order for several reasons. First, as is often the case in applied economic modeling, these empirical results are drawn from models that are based on individual behavior but that are estimated with aggregate data without explicit consideration of aggregation conditions. Second, insofar as producers use appropriate risk management procedures (see Section 5), the conditional variance typically used may not be measuring the relevant risk. 18 Finally, estimating response to conditional variance is inherently difficult. To illustrate this last point, consider the adaptive expectation approach that specifies the (subjective) conditional mean and the conditional variance as follows: oo
,c~t = ~-')~(1 --)0pt_k_l,
(4.4)
k=O oo
cv2 = y'~ ~bk(1 -- qh)[pt-k-1 -- P , t - k - l ] a,
(4.5)
k=O
18 For example, a producer facing price risk and using futures contracts optimally to hedge risk would be exposed only to residual basis risk, and conceivably that is what the variance terms should measure.
116
G. Moschini and D.A. Hennessy
where usually )~ c (0, 1) and 4) c (0, 1). These parameterizations are appealing because they make the unobservable variable a function of past realizations (which are, at least in principle, observable) in a very parsimonious way. It is known that the assumption of adaptive expectations for the mean of price is rather restrictive, and it turns out that such an assumption for the variance is even more restrictive. By definition, if/xt denotes the agent's conditional expectation of price, then a pricegenerating equation consistent with the agent's beliefs is Pt = IXt + u t , where ut is a random term with a zero conditional mean. Hence, an equivalent way of saying that the producer's expected price is formed adaptively as in Equation (4.4) is to say that the producer believes that price is generated by ptmpt-i
--hUt-l-bUt
(4.6)
with E [ u t [ Pt-1] = 0, where Pt-1 denotes the entire price history up to period t - 1. Thus, adaptive expectation for the conditional mean of price is equivalent to assuming that the agent believes that price changes follow an invertible first-order moving-average process, a rather restrictive condition. 19 Given that Equation (4.6) is the relevant price model, the adaptive expectation model for the variance of Equation (4.5) can be rewritten as (4.7) Note that for the model to be internally consistent the agent must believe that the random terms ut are drawn from a distribution with mean zero and variance crt2. But, as is apparent from (4.7), for most types of distributions (including the normal), ~2 is bound to converge to zero as time passes. Indeed, Equation (4.7) shows that the adaptive expectation model for conditional price variance is a special case of Bollerslev's (1986) generalized A R C H (GARCH) model, specifically what Engle and Bollerslev (1986) called the "integrated" G A R C H model. For this model, cr2 --+ 0 almost surely for most common distributions [Nelson (1990)]. 2o The fact that these models imply that c~2 --+ 0 leads to the somewhat paradoxical situation of modeling response to risk with models that entail that risk is transitory. As Geweke (1986, p. 59) stated, "... the integrated G A R C H model is not typical of anything we see in economic time series". These undesirable modeling features are avoided if the conditional price variance is modeled by a regular G A R C H model, such as the GARCH(1,1) model: 0-2 = 0¢0 -'~ 0¢10-2 1 -1"-OQUt2 1,
(4.8)
19 See, for example [Pesaran (1987, p. 19)]. 20 Similar problems also apply to other more ad hoc parameterizations, such as that used by Chavas and Holt (1990), where 0-2 = Y~.k°tk u2 k and oek are predetermined constants satisfying Y~kuk = l.
Ch. 2: Uncertainty,Risk Aversion, and Risk Managementfor Agricultural Producers
117
where c~0 > 0 bounds the conditional variance away from zero (and thus precludes o-2 --> 0), and al + OQ < 1 ensures stationarity of the conditional variance process. This class of models, popular in finance studies, has been applied to agricultural supply models by Aradhyula and Holt (1989, 1990), Holt and Moschini (1992), Holt (1993), and others. Whereas this approach offers a coherent framework for modeling production response to risk, the GARCH model makes explicit the relation between conditional and unconditional variance and brings to the fore an important feature of the problem at hand. Namely, models such as (4.3) can identify response to variance only if the latter is time-varying. If, on the other hand, producers perceive variance to be relatively constant, then no response to risk can be estimated. For example, in the logic of the model (4.8), a constant variance would imply that al = o~2 = 0, such that the conditional variance is the same as the unconditional variance (el0, in such a case), and the term/33a0 in Equation (4.3) would then be absorbed by the intercept. We conclude this section with two observations. First, the assumption that producers perceive a constant conditional variance may not be a bad approximation. Most economic time series do seem to display ARCH properties, but the ability to forecast squared errors is usually very limited even in these models [Pagan and Schwert (1990)], and this is particularly true for the planning horizons typical of agricultural production decisions [Holt and Moschini (1992)]. Thus, in such cases conditional variance does not do much better than unconditional variance for the purpose of measuring the relevant risk; hence, identifying and estimating risk response may be too ambitious an undertaking. 21 But second, the fact that we may have trouble identifying risk response does not mean that production adjustments to risk are not present. Indeed, virtually any supply model that has been estimated without a risk term is consistent with a potentially large risk response insofar as the relevant risk is an unconditional variance that is captured by the intercept. 4.5. Risk and equilibrium in supply and production systems
The models that we have just reviewed introduce a risk variable in a single equation supply model. As mentioned earlier, representing risk in terms of a single variable (say, price variance) may be justified as an approximation to the more general EU model and will be an admissible procedure only under certain restrictive conditions (for example, normality and CARA). Whereas consideration of higher moments has been advocated [Ante and Goodger (1984)], it is arguable that such ambitions may be frustrated in most empirical applications. The single equation nature of these supply models, on the other hand, can only be a partial representation of the more complete production and supply system that may represent the agricultural producer's decision problem. Thus, generalizing risk response models to systems of equations may be desirable, and it has been
21 A related point is that, unlike typical financeapplications, agricultural supplymodels with risk are usually estimated with a small sampleof observations.
118
G. Moschini and D.A. Hennessy
pursued by Coyle (1992), Chavas and Holt (1990, 1996), and Saha, Shumway and Talpaz (1994), among others. Consideration of such complete supply systems is common in applied work under assumptions of certainty or risk neutrality, thanks partly to the popularization of flexible functional forms for dual representations of technology (such as profit and cost functions), which greatly simplify the derivation of coherent systems of output supply and input demand equations. Extension of this "dual" approach under risk has been explored by Coyle (1992), but because his set-up relies on a linear mean-variance objective function (which, as discussed earlier, is consistent with EU only under restrictive assumptions), it is unclear whether this dual approach is better than the corresponding "primal" approach. The system approach typically can accommodate such integrability conditions as symmetry, homogeneity, and curvature (say, convexity in prices of the profit function). Interest in these restrictions can arise for at least two reasons. First, this set of testable restrictions may be used to validate the theoretical framework. Second, if testing the theory is not an objective, then maintaining these restrictions may be useful in improving the feasibility/efficiency of estimation, as well as improving the usefulness of empirical results for policy and welfare analysis. If one wanted to consider the integrability conditions for EU maximizing producers, what would such conditions look like? Pope (1980) pursued this question and showed that the simple symmetry and reciprocity conditions that hold under certainty need not hold under uncertainty. But, as in any optimization problem, some symmetry conditions must exist, and for the case of a producer who maximizes expected utility under price uncertainty, these conditions were characterized by Pope (1980), Chavas and Pope (1985), and Paris (1989). In general the relevant symmetry conditions will involve wealth effects (and thus will depend on risk attitudes). Restrictions on preferences, however, can reduce the symmetry and reciprocity conditions of the risk-averse case to those of the certainty case. That will happen, for example, if the utility function is of the CARA type [Pope (1980)]. Alternatively, restrictions on the technology can also reduce the symmetry and reciprocity conditions of the risk-averse case to those of the certainty case. Specifically, if the production function is homothetic, then input demands satisfy the symmetry conditions that hold under certainty; and if the production function is linearly homogeneous, then the corresponding reciprocity conditions also hold [Dalal (1990)]. A fundamental restriction of output supply and input demand functions under certainty is that of homogeneity of degree zero in prices. Thus, for example, if all input and output prices are scaled by a constant (for instance, a change of units of measurement from dollars to cents), then all real decisions are unaffected, i.e., there is no money illusion. In general the homogeneity property does not seem to hold under price uncertainty, as noted by Pope (1978) and Chavas and Pope (1985), unless restrictions are placed on preferences. Because a proportional change in all input and output prices induces a corresponding change in profit, the decisions of a producer with CARA preferences are affected by such a proportional change. On the other hand, if the producer
Ch. 2:
Uncertainty, Risk Aversion, and Risk Management for Agricultural Producers
119
holds CRRA preferences, then decisions are not affected by such a proportional change in all prices. 22 Spelling out such homogeneity conditions is quite useful, and indeed Pope (1988) used homogeneity to derive tests for the structure of risk preferences. But because homogeneity of degree zero of choice functions in prices is typically associated with the absence of money illusion, the conclusion that homogeneity need not hold under uncertainty may seem somewhat puzzling. One way to look at the problem is to recognize that the absolute risk-aversion coefficient is not unit-free; thus, for example, it is meaningless to postulate a particular numerical value for )~ independent of the units of measurement of prices. If doubling of all prices were associated with halving of )~, for example, then even under CARA choices would not be affected by such a change. There is, however, a more fundamental way of looking at the homogeneity property. The crucial element here is to recognize that the vNM utility function of money, say U (zr), is best interpreted as an indirect utility function of consumer demand, such that zr creates utility because it is used to purchase consumption goods. Thus, U(zr) = V(p e, re) where V(p c, zc) is the agent's indirect utility function, and pC denotes the price vector of consumption goods. In analyses of risk models, the vector pC is subsumed in the functional U(.) under the presumption that these prices are held constant. Because V(p c, zr) is homogeneous of degree zero in pe and Jr, it follows that, when consumption prices are explicitly considered, the vNM utility function is homogeneous of degree zero in all prices (i.e., consumption prices, output prices, and input prices). Thus, homogeneity (i.e., lack of money illusion) must hold even under uncertainty, when this property is stated in this extended sense. Storage opportunities introduce dynamics and require a more careful accounting for equilibrium issues as well as for expectation formation when modeling supply. In particular, because negative storage is impossible, nonlinearities are inherent in the equilibrium problem. Using U.S. soybean market data over the period 1960 to 1988, Miranda and Glauber (1993) develop an equilibrium rational expectations model that explicitly represents the behavior of producers, consumers, and storers (both private and public). They find evidence to suggest that both acres supplied and storage activities respond negatively to increased price risk. The storage result suggests that risk management institutions may facilitate efficiency by reducing impediments to intertemporal transactions.
4.6. Programming models with risk In a number of agricultural economics applications, especially those with a normative focus, risk has been considered within suitably parameterized programming models that
22 For example, if output and input prices are scaled by a constant k > 0, then profit changes from zr to kzr. If utility is CARA, then -exp()~Jr) ~ -exp(-k)~zr), because scaling prices by k is equivalent to changing the constant coefficient of risk aversion. On the other hand, if utility is CRRA, say U = log(zr), then scaling profit by k clearly has no effect on choices.
G. Moschini and D.A. Hennessy
120
can readily be solved (and simulated) by appropriate computational methods. The classical quadratic programming problem of Freund (1956) maximizes a weighted linear summation of mean and variance subject to resource constraints: 1
M a x / z ( x ) - z)~ V (x) x 2
such that G(x) /~,
such that (5.12)
where R is supported on [a, b], g is the minimum level of expected utility that must be maintained to entice the producer to insure, F (R [ x) is the revenue distribution function conditional on the input vector x, and r is the input price vector. Standard analysis, due to Borch (1962), yields the requirement that I (R) satisfy the point-wise condition
1 -- CI(R)[I(R)] g~[rr]
=~,
(5.13)
where/~ is the Lagrange multiplier for the EU constraint in problem (5.12). Now, if the insurer's cost is invariant to the nature of the schedule, then optimality requires U~ [rr]
Ch. 2:
Uncertainty, Risk Aversion, and Risk Management for Agricultural Producers
137
to be constant, and so for risk-averse producers I (R) must be such that R - I ( R ) - r x is constant. This is the classical risk-sharing result, namely that the risk-neutral insurer should accept all risk from the risk-averse producer. Under general conditions, this result continues to hold if the insurer is risk averse but contracts upon a large number of independent risks. 4° Because the insurer here assumes all the risk, and given the participation constraint, then I ( R ) = R - r x - U - l [g], and the optimal x is that which maximizes the producer's expected profit. 41 This set-up is drastically changed, and moral hazard problems arise, when the insurer contracts on a risk-averse producer whose inputs are unobservable (i.e., there is asymmetric information). This is because the insurer has but one instrument, the payoff schedule, to address two goals. To be attractive a contract must mitigate the uncertainty facing insurers, but to make a profit the contract must ensure that producers do not take advantage of the limited control over insurance payoffs that arise from the insurer's inability to observe input use. The insurer's problem when inputs are not observable, but the stochastic technology F ( R ] x ) is known, can be stated as Max Z(R) Jf. b { I ( R ) - - C [ I ( R ) ] } d F ( R a b V [ R -- I ( R ) - r x ] d F ( R x = argmax
fb
Ix)
such that
I x ) >1 ~,
U[R - I(R) - rx]dF(R
(5.14) Ix).
,la
The additional incentive compatibility constraint ensures that the rational insurer endogenizes the input consequences of the payoff schedule posed. For both problems (5.12) and (5.14), in general the participation constraint is binding and the producer achieves utility level g. Under moral hazard, however, it is not optimal for the risk-neutral principal to assume all risk. Some residual risk must be borne by the (risk-averse) producer and hence, to achieve a given ~, the expected payouts to the producer have to be larger than under symmetric information. Chambers (1989) discusses the welfare loss associated with the incentive constraint as well as the possibility that it might cause crop insurance markets to fail. The implications of the moral hazard problem are not as clear-cut as intuition might suggest. Being relieved of some of the consequences of low input use, the producer m a y reduce input intensity. On the other hand, as previously shown, if input use is risk
40 Unfortunately,risks across crop production units usually tend to be more systematic than idiosyncratic in nature. 41 In the trivial case where inputs are tmobservable but the producer is risk neutral, this expected profitmaximizing result may also be achieved by setting the schedule I ( R ) equal to a constant. In this way, the producer faces all the consequences of the actions taken. But then, of course, the insurance company serves no purpose and will never be able to cover any administrativecosts.
138
G. Moschini and D.A. Hennessy
increasing then a high-risk environment may cause the producer to use fewer inputs than a lower-risk environment. Thus the existence of insurance may, in mitigating risk, encourage input use. That is, risk sharing and moral hazard effects may oppose each other. To model econometrically the moral hazard problem, the crop producer contemplating whether to insure may be viewed as having to make two decisions: whether or not to insure, and the choice of input vector. In one of the first econometric analyses of the effects of crop insurance, Horowitz and Lichtenberg (1993) assumed that the decision to insure affects input use but not the other way around. Modeling the insurance decision by Probit analysis and modeling input choice as a linear regression on the insurance decision, among other regressors, they studied corn production decisions in ten Corn Belt states and concluded that the decision to insure increased significantly the use of nitrogen and pesticides. These results are somewhat surprising, so other researchers sought to confirm the conclusions on different data sets and using other methodologies. Smith and Goodwin (1996) estimated a simultaneous equations model of input use and crop insurance purchases for Kansas dryland wheat farmers, and concluded that insurance and input decisions are likely simultaneously determined. Further, their results suggest that insurance reduces the use of agricultural chemicals. Estimating an input-conditioned beta distribution for farm-level Iowa corn production, Babcock and Hennessy (1996) simulated optimal input use under different types and levels of insurance for risk-averse producers and also concluded that insurance would likely decrease input use. Although more empirical investigations are warranted, it would appear that risk sharing through crop insurance reduces input use. The moral hazard problem was also studied in the West African Sahel region, which is at risk to drought. Following on work by Hazell (1992), among others, Sakurai and Reardon (1997) identified quite strong potential demand for area-level rainfall insurance. Their analysis also raises the concern that moral hazard arising from food aid could undermine the viability of such contracts. In identifying two types of risk, production risk and land value risk arising from soil depletion, Innes and Ardila (1994) suggest an intertemporal environmental aspect to the incentive problem. For fragile land, a contract tailored to insure against production risk may exacerbate land value deterioration, and so one might not be able to ignore dynamic aspects of moral hazard. This is especially true if the operator does not own the land. Dynamic issues also arise in work by Coble et al. (1997) who find evidence that input reduction by insured producers occurs mainly when a crop loss is most likely, thus exacerbating the magnitude of the loss. Moral hazard problems may not be confined to input intensity issues. If output is difficult to verify, then false yields may be reported. Such illegal acts raise questions concerning contract design, the structure of legal sanctions, and the nature of detection technologies. Hyde and Vercammen (1997) argue that, whereas it is difficult to motivate the structure of insurance contracts actually offered (i.e., the attributes of monotonicity, convexity, deductibility, and co-insurance) as a response to moral hazard on input use
Ch. 2:
Uncertainty, Risk Aversion, and Risk Management for Agricultural Producers
139
alone, actual contracts can plausibly be an optimal response to moral hazard on both input use and yield verification together. 5.2.2. Adverse selection
When, unlike the producer, the insurer is not completely informed about the nature of the risk being insured, then the insurer faces the problem of adverse selection. Ignoring input choices, let a risk-neutral insurer have categorized three production units owned by different operators and of equal size (say, one acre without loss of generality), A, B, and C, into the same risk cohort. From the information available to it, say common average yield (y), the insurer can observe no difference among these three acres. In fact, the associated yield distributions differ; suppose all acres realize two outcomes, each with probability 1/2, but the realizations for acre A are {y - 10, y 4- 10}, those for B are {y - 20, y + 20}, and those for C are {y - 30, y + 30}. With unit price, if the insurance payout equaled Max[y - y, 0], then the expected payouts for acres A, B, and C would be 5, 10, and 15, respectively. In such a case, assuming full participation, the actuarially fair premium for a contract covering all three risks would be 10/acre. However, if the acre A producer is insufficiently risk averse, then she may conclude that the loss ratio for acre A, at 5/10 = 1A, is too low and may not insure the acre. If the insurer continues to charge 10/acre when covering only acres B and C, then an average loss of 22V2/acre is incurred. On the other hand, if the premium is raised to 122V2/acre so that a loss is avoided, then acre B may not be insured. Thus, the market may unravel in stages. Avoiding adverse selection may require the successful crop insurance program to identify, acquire, and skillfully use data that discriminate among different risks. Although perhaps costly to implement, such data management procedures may be crucial because, unless rates are perceived as being acceptable, the market may collapse. The phenomenon of unravelling suggests that identifying a sufficiently large number of relatively homogeneous risks is a prerequisite for a successful contract. Useful discriminators would appear to include mean yield. Skees and Reed (1986) and Just and Calvin (1993) have found evidence suggesting that yield variance may decrease with increased mean yield, and so, even if the trigger insurance yield increases with mean yield, rates should probably be lower for more productive acres. Goodwin (1994), studying Kansas crops (1981-90), finds the relationship between yield variability and mean yield to be tenuous and suggests that farm yield histories be used to calculate yield variability rather than impute variability from historical mean yield. He also concludes that other factors, such as enterprise size, could be informative in setting premium rates. The degree of homogeneity required to sustain the contract depends upon, among other things, the degree of risk aversion expressed by producers. The more risk averse the producers, the more tolerant they will be of actuarially unfair rates. In an investigation of adverse selection in contracts on corn production, Goodwin (1993) studied county-level data for the ninety-nine Iowa counties over the period 1985 to 1990 and found the elasticities of acreage insured to expected payoff to be in the range of 0.30.7. At the farm level, these elasticities may be higher. Further, he found that counties
140
G. Moschini and D.A. Hennessy
where the risk of payout is low are quite sensitive to the premium charged, so that an across-the-state (of Iowa) premium increase might not make corn yield insurance more profitable because substantial cancellations by the better risk prospects may occur. He concluded that the best approach to loss ratio reduction may involve fine-tuning the rate setting at the county or farm level. Adverse selection may be either spatial or temporal in nature. The problem type discussed thus far may be categorized as being spatial in the sense that the factors differentiating risks occur at a given point in time. An alternative form of adverse selection, identified by Luo, Skees and Marchant (1994), may arise when attributes of a given risk vary temporally. 42 Coble et al. (1996) consider the case of adverse selection in crop insurance contracts for Kansas dryland wheat farmers over the years 1987 to 1990. Preseason rainfall was used as an indicator for intertemporal adverse selection whereby an unseasonably low (high) level of rainfall occurring before contract signing would entice marginal risks into (out of) signing, thus increasing the loss ratio if rates do not reflect the implications of the water deficit prevailing at signing. Although finding some evidence of adverse selection, they did not identify any of an intertemporal nature. There are, of course, many factors other than adverse selection that determine the decision for, and the magnitude of, crop insurance participation. To understand adverse selection it is necessary to isolate its impact by accounting for other determinants of participation. In addition to the aforementioned research, econometric analyses of the determinants of insurance participation have been conducted by Gardner and Kramer (1986), Just and Calvin (1990), and Smith and Baquet (1996), among others. Although the conclusions are somewhat mixed, an overview of results suggests that participation tends to increase with farm size. This may be because of the negative correlation between farm size and the importance of off-farm income, or because of increased borrowing. Also, enterprise specialization tends to increase participation, presumably because of increased risk exposure. Further, and suggestive of adverse selection, higher yield variability land is more likely to be insured. However, estimates by Coble et al. (1996) infer that this is true even if rates account for the increased riskiness. 5.2.3. F u r t h e r d i s c u s s i o n
Though conceptually distinct, the differences between the moral hazard and adverse selection problems often disappear in practice. Noting that both moral hazard and adverse selection are problems of information asymmetry, Quiggin, Karagiannis and Stanton (1993) posed the situation in which a wheat and corn producer contemplating crop insurance has one acre of good land and one acre of bad land. Given the decision to insure wheat but not corn, the planting of wheat on poor quality land might be viewed as moral
42 If the producer is better informed about the temporal evolution of risk, then adverse selection may occur. However, as discussed in [Knightand CoNe (1997)], the insurer may be just as informed about the temporal risk as the producer, but may be either unable o1"unwilling to adjust rates. In such a situation, the problem is not one of adverse selection.
Ch. 2:
Uncertainty, Risk Aversion, and Risk Management for Agricultural Producers
141
hazard. However, given the decision to plant poor land to wheat, the decision to insure wheat only may be viewed as adverse selection. Thus, it should be no surprise that the potential remedies to each problem are similar. Due to the informational nature of the main barriers to successful crop insurance markets, the obvious solution is, where feasible, to acquire and use as much information as marginal cost and profit considerations allow. To improve performance by reducing adverse selection, the FCIC changed its approach to rate setting in 1985 to accommodate additional information. Subsequent contracts changed the determination of the insurable yield from an average of past yields observed in a locality to an average of past yields observed on the farm in question. Even so sensible a reform, however, may give rise to incentive problems. As pointed out by Vercammen and van Kooten (1994), producers might manipulate input use in a cyclical manner to build up insurable yield levels before cashing in (in a probabilistic sense) by reducing input use for a few years. On the other hand, area yield insurance [Halcrow (1949), Miranda (1991), Mahul (1999)], where indemnities are based upon the average yield of a suitably wide area (say, a county), eliminates the moral hazard problem and may reduce or eliminate adverse selection. In addition, just as futures markets permit hedge ratios in excess of one, a producer may take out an arbitrary level of area yield insurance coverage without giving rise to concerns about increased moral hazard. Area yield insurance rates are likely to be lower than farm-specific rates because an area yield index will usually be less variable than yield on a given farm. However, because farm-specific risks are not insured, producers may continue to be subjected to some (possibly substantial) production risk. Revenue insurance is a recurrently popular concept because it directly addresses the income risk problem facing producers. A further possible advantage is that, in combining price and yield insurance, the approach may mitigate somewhat the incidence of moral hazard and adverse selection. Miranda and Glauber (1991), as well as Babcock and Hennessy (1996), conducted simulation analyses for U.S. crop production, and Turvey (1992a, 1992b) studied the costs and benefits of such a program in Canada. The potential for revenue insurance arises from the fact that, even together, price contingent markets (for a fixed quantity) and yield contingent markets (for a fixed price) are not likely to fully stabilize income. Hennessy, Babcock and Hayes (1997) have shown that this targeting attribute of revenue insurance means that it can increase the welfare impact of a given expenditure on income support relative to various alternatives of price and yield support. Compulsory insurance has often been proposed to eliminate the political need for continual ex-post interventions. If adverse selection is a major problem in competitive insurance markets, however, then compulsory insurance is unlikely to gain the political support necessary for a long-term solution. More effective re-insurance on the part of crop insurers may facilitate the reduction of market rates, and thus reduce adverse selection, because systemic risk is pervasive in the insurance of crop risks and so pooling is largely ineffective for the insurer [Miranda and Glauber (1997), Duncan and Myers (1997)]. Given the diminishing importance of agriculture in developed economies, the introduction of crop loss risks into a well-diversified portfolio of risks would re-
142
G. Moschini and D.A. Hennessy
duce the high level of systematic risk in crop insurance markets, and so may reduce the risk premia required by crop insurers. But crop insurance differs in many ways from other forms of insurance, and it may prove difficult to entice reinsurers into accepting these contracts. If a permanent solution exists that is politically more acceptable than a laissez-faire market approach, it may involve a package of reforms that is balanced to mitigate the incentive impacts but incurs low budgetary costs. Such a package should also take care not to undermine existing or potentially viable risk markets. Finally, the policy mix must be flexible because the technology and organization of crop production may undergo fundamental changes in the coming years.
6. Conclusion
It is abundantly clear that considerations of uncertainty and risk cannot be escaped when addressing most agricultural economics problems. The demands imposed on economic analysis are complex and wide-ranging, with issues that extend from the pure theory of rational behavior to the practicality of developing risk-management advice. The economics profession at large, and its agricultural economics subset, has responded to this challenge with a wealth of contributions. In this chapter we have emphasized theoretical and applied analyses as they pertain to production decisions at the farm level. The EU model provides the most common approach to characterizing rational decisions under risk, and it has been the framework of choice for most applied work in agricultural economics. Whereas our review has provided only a nutshell exposition of the framework's main features, the careful student will dig deeper into its axiomatic underpinning as a crucial step to appreciating what modeling decisions under risk means. More generally, we can note that a satisfactory model of decision making under risk requires assuming an extended notion of rationality. Agents need to know the entire distribution of risky variables, and need to take into account how this randomness affects the distribution of outcomes over alternative courses of action. Thus, the decision maker's problem is inherently more difficult under uncertainty than under certainty. Because the notion of rational behavior under risk arguably requires agents to solve a complex problem, it is perhaps useful to distinguish between whether models are meant to provide a positive theory (aiming to describe how agents actually make decisions under risk) or a normative theory (the purpose of which is to prescribe a rational course of action for the particular risky situation). This distinction is admittedly somewhat artificial, and most models are suitable to either interpretation. Yet being more explicit about whether one's analysis is pursuing a positive or normative exercise is possibly quite important in applied contexts such as those covered in this chapter. Much agricultural risk management work is meant as a normative activity, and this may have implications for the choice of models. For instance, the EU model has been criticized, on positive grounds, for failing to describe accurately how agents actually behave under risk in some situations; such a critique, of course, says nothing about the suitability of the EU model for normative (prescriptive) purposes.
Ch. 2:
Uncertainty, Risk Aversion, and Risk Management for Agricultural Producers
143
Models of decision making under risk bring to the forefront the fact that decisions will be affected in a crucial way by the agent's preferences, i.e., her attitudes towards risk. Consequently, it is quite important to quantify the degree of agricultural producers' risk aversion, and a number of studies have endeavored to do just that. The conclusions may be summarized as follows: within the EU framework, producers typically display some aversion to risk, and risk preferences probably conform to DARA. But evidence on the magnitude of risk aversion is less conclusive and falls short of providing useful parameters that are critical for normative statements (whether in terms of risk management advice to farmers or in terms of suggesting desirable government policies). Considerations of risk aversion also raise concerns about a very common attribute of applied studies that have a positive orientation. Namely, whereas theoretical models are meant for individual decision making, empirical models are often implemented with aggregate data. The danger of ignoring the implicit aggregation problem is obviously a general concern that applies to economic models of certainty as well. But the fact that risk attitudes play an important role in models with risk, and given that such preferences are inherently an individual attribute, suggests that agents' heterogeneity is bound to be more important when risk matters. It seems that more can and should be done to tackle aggregation considerations in a satisfactory manner. The complexities of the decision maker's problem under risk raise additional issues for the applied researcher. Agents' beliefs about the characteristics of uncertainty are obviously crucial in this context. The EU model, by relying on the notion of subjective probabilities, neatly solves the theoretical modeling question. But the applied researcher may need to model explicitly how the agent makes probability assessments (i.e., to model her expectations). Whereas the rational expectation hypothesis provides perhaps the most ambitious answer to this question, it is informationally very demanding when (as is typically the case in risky situations) the entire distribution of the random variables matters. This raises the question of whether rational expectations are legitimate from a theoretical point of view, but also implies that empirical models that wish to implement rational expectations can be computationally quite demanding, even for the simplest model under risk. Indeed, many empirical models reviewed in this chapter appear somewhat oversimplified. The modus operandi seems to be to allow theoretical modeling to be as sophisticated as desired but to keep empirical models as simple as possible. Such oversimplifications naturally beg the question of the relationship of empirical models to the theoretical constructs that are used to interpret results, and raise some concerns about what exactly we can learn from this body of empirical studies. Notwithstanding the remaining criticisms and concerns that one may have, the studies surveyed in this chapter have addressed an important set of problems. Uncertainty and risk are essential features of many agricultural activities, and have important consequences for the agents involved and for society at large. Although welfare and policy considerations related to risk are discussed elsewhere in this H a n d b o o k , we should note that the economic implications of the existence of risk and uncertainty are related to the particular institutional setting in which agents operate. Insofar as the set of rele-
144
G. Moschini and D.A. Hennessy
vant markets is not complete, then this market incompleteness has the potential of adversely affecting resource allocation, as well as resulting in less than optimal allocation of risk-bearing. Indeed, the incompleteness of risk markets for agricultural producers has often been cited as a motivation for agricultural policies in many developed countries. But arguably neither existing markets nor government policies have solved the farmers' risk exposure problems. Risk continues to have the potential of adversely affecting farmers' welfare, as well as carrying implications for the long-run organization of agricultural production and for the structure of resource ownership in the agricultural sector.
Acknowledgements We appreciate the comments of many colleagues including Jock Anderson, Keith Coble, Sergio Lence, Mario Miranda, Bob Myers, and the Handbook's editors. This chapter was largely written in 1997, and slightly revised in 1998. We have not attempted to cover work published more recently. Other unhedged errors and omissions are the responsibility of the authors. Journal paper No. J- 17995 of the Iowa Agriculture and Home Economics Experiment Station, Ames Iowa. Project No. 3463, supported by Hatch Act and State of Iowa funds.
References Allais, M. (1953), "Le comportementde l'homme rationneldevantle risque: Critiquedes postulatset axiomes de l'6cole am6ricaine",Econometrica21:503-546. Anderson, G. (1996), "Nonparametrictests of stochastic dominancein incomedistributions",Econometrica 64:1183-1193. Anderson, J.R., J.L. Dillon and B. Hardaker (1977), AgriculturalDecisionAnalysis(Iowa State University Press, Ames, IA). Anderson,R., and J.-E Danthine(1981), "Cross-hedging",Journalof PoliticalEconomy89:1182-1196. Anderson, R., and J.-E Danthine (1983), "The time pattern of hedging and the volatilityof futures prices", Review of EconomicStudies 50:249-266. Anscombe,E, and R. Aumann(1963), "A definitionof subjectiveprobability",Annalsof Mathematical Statistics 34:199-205. Antle, J.M. (1983), "Testingthe stochastic structureof production:A flexiblemoment-basedapproach", Journal of Businessand EconomicStatistics 1 (3):192-201. Antle, J.M. (1987), "Econometricestimationof producers' risk attitudes", AmericanJournal of Agricultural Economics 69:509-522. Antle, J.M. (1989), "Nonstructuralrisk attitude estimation", AmericanJournal of AgriculturalEconomics 71:774-784. Antle, J.M., and C.C. Crissman(1990), "Risk, efficiency,and the adoptionof modem crop varieties:Evidence from the Philippines",EconomicDevelopmentand CulturalChange 38:517-537. Antle, J.M., and W.J. Goodger (1984), "Measuringstochastic technology: The case of Tulare milk production", AmericanJournal of AgriculturalEconomics66:342-350. Antonovitz,F., and R. Green (1990), "Alternativeestimates of fed beef supply response to risk", American Journal of AgriculturalEconomics72:475-487.
Ch. 2:
Uncertainty, Risk Aversion, and Risk Management for Agricultural Producers
145
Aradhyula, S.V., and M.T. Holt (1989), "Risk behavior and rational expectations in the U.S. broiler market", American Journal of Agricultural Economics 71:892-902. Aradhyula, S.V., and M.T. Holt (1990), "Price risk in supply equations: An application of GARCH time-series models to the U.S. broiler market", Southern Economic Journal 57:230-242. Arrow, K. (1964), "The role of securities in the optimal allocation of risk bearing", Review of Economic Studies 31:91-96. Arrow, K. (1965), Aspects of the Theory of Risk-beating (Yrio Jahnsson Foundation, Helsinki). Azam, J.-E (1996), "The impact of floods on the adoption rate of high-yielding rice varieties in Bangladesh", Agricultural Economics 13:179-189. Babcock, B.A., and A.M. Blackmer (1992), "The value of reducing temporal input nonuniformities", Journal of Agricultural and Resource Economics 17:335-347. Babcock, B.A., and D.A. Hennessy (1996), "Input demand under yield and revenue insurance", American Journal of Agricultural Economics 78:416-427. Baron, D.P. (1970), "Price uncertainty, utility, and industry equilibrium in pure competition", Intemational Economic Review 11:463-480. Barrett, C.B. (1996), "On price risk and the inverse farm size-productivity relationship", Journal of Development Economics 51:193-215. Basu, K. (1992), "Limited liability and the existence of share tenancy", Journal of Development Economics 38:203-220. Batlin, C.A. (1983), "Production under price uncertainty with imperfect time hedging opportunities in futures markets", Southern Economic Journal 49:681-692. Batra, R.N., and A. Ullah (1974), "Competitive firm and the theory of input demand under price uncertainty", Journal of Political Economy 82:537-548. Behrman, J.R. (1968), Supply Response in Underdeveloped Agriculture: A Case Study of Four Major Crops in Thailand, 1937-63 (North Holland, Amsterdam). Benninga, S., R. Eldor and I. Zilcha (1983), "Optimal hedging in the futures market under price uncertainty", Economics Letters 13:141-145. Bera, A.K. and T.G. Kelley (1990), "Adoption of high-yielding rice varieties in Bangladesh", Journal of Development Economics 33:263-285. Bernoulli, D. (1738), "Specimen theoriae novae de mensura sortis", Commentarii Academiae Scientiarum Imperialis Petropofitanae 5:175-192 (Translation by Sommer, L., 1954, and published in Econometrica 22:23-36). Bigman, D. (1996), "Safety-first criteria and their measures of risk", American Journal of Agricultural Economics 78:225-235. Binswanger, H.E (1980), "Attitudes toward risk: Experimental measurement in rural India", American Journal of Agricultural Economics 62:395407. Binswanger, H.P. (1981), "Attitudes toward risk: Theoretical implications of an experiment in rural India", Economic Journal 91:867-890. Bollerslev, T.E (1986), "Generalized autoregressive conditional heteroskedasticity", Journal of Econometrics 31:307-327. Borch, K. (1962), "Equilibrium in a reinsurance market", Econometrica 30:424-444. Bottomley, A. (1975), "Interest rate development in underdeveloped rural areas", American Journal of Agricultural Economics 57:279-291. Bray, M. (1981), "Futures trading, rational expectations, and the efficient market hypothesis", Econometrica 49:575-596. Brink, L., and B.A. McCarl (1978), "The tradeoff between expected return and risk among cornbelt farmers", American Journal of Agricultural Economics 60:259-263. Brorsen, B.W., J.-E Chavas and W.R. Grant (1987), "A market equilibrium analysis of the impact of risk on the U.S. rice industry", American Journal of Agricultural Economics 69:731-739. Burt, O.R. (1965), "Optimal replacement under risk", Journal of Farm Economics 47:324-346.
146
G. Moschini and D.A. Hennessy
Chambers, R.G. (1989), "Insurability and moral hazard in agricultural insurance markets", American Journal of Agricultural Economics 71:604-616. Chambers, R.G., and J. Quiggin (1998), "Cost functions and duality for stochastic technologies", American Journal of Agricultural Economics 80:288-295. Chavas, J.-R (1994), "Production and investment decisions under sunk cost and temporal uncertainty", American Journal of Agricultural Economics 76:114-127. Chavas, J.-R, and M.T. Holt (1990), "Acreage decisions under risk: The case of corn and soybeans", American Journal of Agricultural Economics 72:529-538. Chavas, J.-E, and M.T. Holt (1996), "Economic behavior under uncertainty: A joint analysis of risk preferences and technology", Review of Economics and Statistics 78:329-335. Chavas, J.-E, and R. Pope (1985), "Price uncertainty and competitive firm behavior: Testable hypotheses from expected utility maximization", Journal of Economics and Business 37:223-235. Coble, K.H., T.O. Knight, R.D. Pope and J.R. Williams (1996), "Modeling farm-level crop insurance demand with panel data", American Journal of Agricultural Economics 78:439-447. Coble, K.H., %0. Knight, R.D. Pope and J.R. Williams (1997), "An expected indemnity approach to the measurement of moral hazard in crop insurance", American Journal of Agricultural Economics 79:216226. Collins, R.A., and EJ. Barry (1986), "Risk analysis with single-index portfolio models: An application to farm planning", American Journal of Agricultural Economics 68:152-161. Cox, J.C., and M. Rubinstein (1985), Options Markets (Prentice-Hall, Englewood Cliffs, N.J.). Coyle, B.T. (1992), "Risk aversion and price risk in duality models of production: A linear mean-variance approach", American Journal of Agricultural Economics 74: 849-859. Dalai, A.J. (1990), "Symmetry restrictions in the analysis of the competitive firm under price uncertainty", International Economic Review 31:207-211. Danthine, J.-R (1978), "Information, futures prices, and stabilizing speculation", Journal of Economic Theory 17:79-98. Day, R. (1965), "Probability distributions of field crop yields", Journal of Farm Economics 47:713-741. Debreu, G. (1959), Theory of Value: An Axiomatic Analysis of General Equilibrium (Yale University Press, New Haven). de Finetti, B. (1931 ), "Sul significato soggettivo della probabilith", Fundamenta Mathematicae 17:298-229. Dillon, J.L. (1971), "An expository review of Bernouillian decision theory in agriculture: Is utility futility?", Review of Marketing and Agricultural Economics 39:3-80. Dillon, J.L., and EL. Scandizzo (1978), "Risk attitudes of subsistence farmers in Northeast Brazil: A sampling approach", American Journal of Agricultural Economics 60:425-435. DiPietre, D.D., and M.L. Hayenga (1982), "Cross-hedging wholesale products using live hogs futures", American Journal of Agricultural Economics 64:747-751. Dixit, A.K., and R.S. Pindyck (1994), Investment under Uncertainty (Princeton University Press, Princeton). Duncan, J., and R.J. Myers (1997), Crop insurance under catastrophic risk, Staff Paper 97-10 (Department of Agricultural Economics, Michigan State University). Eeckhoudt, L., and R Hansen (1992), "Mean-preserving changes in risk with tail-dominance", Theory and Decision 33:23-39. Ehrlich, I., and G. Becker (1972), "Market insurance, self-insurance, and self-protection", Journal of Political Economy 80:623-648. Ellsberg, D. (1961), "Risk, ambiguity, and the savage axioms", Quarterly Journal of Economics 75:643~569. Engle, R.E (1982), "Autoregressive conditional heteroskedasticity with estimates of the variance of the United Kingdom inflation", Econometrica 50:987-1007. Engle, R.E, and T. Bollerslev (1986), "Modelling the persistence of conditional variances", Econometric Reviews 5:1-50. Epstein, L.G. (1978), "Production flexibility and the behavior of the competitive firm under price uncertainty", Review of Economic Studies 45:251-261.
Ch. 2:
Uncertainty, Risk Aversion, and Risk Management for Agricultural Producers
147
Feder, G., R.E. Just and A. Schmitz (1980), "Futures markets and the theory of the firm under price uncertainty", Quarterly Journal of Economics 94:317-328. Feder, G., R.E. Just and D. Zilberman (1985), "Adoption of agricultural innovations in developing countries: A survey", Economic Development and Cultural Change 33:255-298. Federal Crop Insurance Corporation (1997), Crop insurance actuarial information public access server, World Wide Web site http://www.act.fcic.usda.gov/./actuarial/ Feinerman, E., E.K. Choi and S.R. Johnson (1990), "Uncertainty and split nitrogen application in corn production", American Journal of Agricultural Economics 72:975-984. Finkelshtain, I., and J.A. Chalfant (1991), "Marketed surplus under risk: Do peasants agree with Sandmo?", American Journal of Agricultural Economics 73:557-567. Foster, W.E., and G.C. Rausser (1991), "Farm behavior under risk of failure", American Journal of Agricultural Economics 73:276-288. Freund, R.J. (1956), "Introduction of risk into a programming model", Econometrica 24:253-263. Froot, K.A., D.S. Scharfstein and J.C. Stein (1993), "Risk management: Coordinating corporate investment and financing policies", Journal of Finance 48:1629-1658. Gallagher, RW. (1987), "U.S. soybean yields: Estimation and forecasting with nonsymmetric disturbances", American Journal of Agricultural Economics 69:796-803. Gardner, B.L. (1989), "Rollover hedging and missing long-term futures markets", American Journal of Agricultural Economics 71:311-325. Gardner, B.L. (1994), "Crop insurance in U.S. farm policy", in: D.L. Hueth, and W.H. Furtan, eds., Economics of Agricultural Crop Insurance: Theory and Evidence (Kluwer Academic Publishers, Boston) 17-44. Gardner, B.L., and R.A. Kramer (1986), "Experience with crop insurance programs in the United States", in: E Hazell, C. Pomareda and A. Valdrs, eds., Crop Insurance for Agricultural Development: Issues and Experience (Johns Hopkins Press, Baltimore) 195-222. Geweke, J. (1986), "Modelling the persistence of conditional variances: Comment", Econometric Reviews 5:57-61. Gollier, C. (1995), "The comparative statics of changes in risk revisited", Journal of Economic Theory 66:522-535. Goodwin, B.K. (1993), "An empirical analysis of the demand for crop insurance", American Journal of Agricultural Economics 75:425-434. Goodwiu, B.K. (1994), "Premium rate determination in the Federal crop insurance program: What do averages have to say about risk?", Journal of Agricultural and Resource Economics 19:382-395. Hadar, J., and W. Russell (1969), "Rules for ordering uncertain prospects", American Economic Review 59:25-34. Halcrow, H.G. (1949), "Actuarial structures for crop insurance", Journal of Farm Economics 21:418-443. Hamal, K.B., and J.R. Anderson (1982), "A note on decreasing absolute risk aversion among farmers in Nepal", Australian Journal of Agricultural Economics 26:220-225. Hanoch, G., and H. Levy (1969), "The efficiency analysis of choices involving risk", Review of Economic Studies 36:335-346. Hartman, R. (1976), "Factor demand with output price uncertainty", American Economic Review 66:675681. Hazell, RB.R. (1971), "A linear alternative to quadratic and semivariance programming for farm planning under uncertainty", American Journal of Agricultural Economics 53:53-62. Hazel1, RB.R. (1982), "Applications of risk preference estimates in firm-household and agricultural sector models", American Journal of Agricultural Economics 64:384-390. Hazell, RB.R. (1992), "The appropriate role of agricultural insurance in developing countries", Journal of International Development 4:567-582. Hennessy, D.A. (1998), "The production effects of income support under price uncertainty", American Journal of Agricultural Economics 80:46-57. Hennessy, D.A., B.A. Babcock and D.J. Hayes (1997), "Budgetary and producer welfare effects of revenue insurance", American Journal of Agricultural Economics 79:1024-1034.
148
G. Moschini and D.A. Hennessy
Hirshleifer, J. (1966), "Investment decisions under uncertainty: Applications of the state-preference approach", Quarterly Journal of Economics 80:252-277. Hirshleifer, J., and J.G. Riley (1992), The Analytics of Uncertainty and Information (Cambridge University Press, Cambridge, U.K.). Holt, M.T. (1993), "Risk response in the beef marketing channel: A multivariate generalized ARCH-M approach", American Journal of Agricultural Economics 75:559-571. Holt, M.T., and G. Moschini (1992), "Alternative measures of risk in commodity supply models: An analysis of sow farrowing decisions in the United States", Journal of Agricultural and Resource Economics 17:1-12. Holthausen, D.M. (1979), "Hedging and the competitive firm under price uncertainty", American Economic Review 69:989-995. Horowitz, J.K., and E. Lichtenberg (1993), "Insurance, moral hazard, and chemical use in agriculture", American Journal of Agricultural Economics 75:926-935. Hurt, C.A., and P. Garcia (1982), "The impact of price risk on sow farrowings, 1967-78", American Journal of Agricultural Economics 64:563-568. Hyde, C.E., and J.A. Vercammen (1997), "Cosily yield verification, moral hazard, and crop insurance contract form", Journal of Agricultural Economics 48:393-407. Innes, R. (1990), "Government target price interventions in economies with incomplete markets", Quarterly Journal of Economics 106:1035-1052. Innes, R., and S. Ardila (1994), "Agricultural insurance and soil depletion in a simple dynamic model", American Journal of Agricultural Economics 76:371-384. Innes, R., and G.C. Ransser (1989), "Incomplete markets and government agricultural policy", American Journal of Agricultural Economics 71:915-931. Ishii, 5(. (1977), "On the theory of the competitive firm under price uncertainty: Note", American Economic Review 67:768-769. Jewitt, I. (1987), "Risk aversion and the choice between risky prospects: The preservation of comparative statics results", Review of Economic Studies 56:14-25. Just, R.E. (1974), "An investigation of the importance of risk in farmer's decisions", American Journal of Agricultural Economics 56:14-25. Just, R.E. (1976), "Estimation of a risk response model with some degree of flexibility", Southern Economic Journal 42:675-684. Just, R.E., and L. Calvin (1990), "An empirical analysis of U.S. participation in crop insurance", Unpublished report to the Federal Crop Insurance Corporation. Just, R.E., and L. Calvin (1993), "Adverse selection in U.S. crop insurance: The relationship of farm characteristics to premiums", Unpublished manuscript, University of Maryland. Just, R.E., and R.D. Pope (1978), "Stochastic specifications of production functions and economic implications", Journal of Econometrics 7:67-86. Just, R.E., and R.D. Pope (1979), "Production function and estimation and related risk considerations", American Journal of Agricultural Economics 61:276-284. Just, R.E., and Q. Weninger (1999), "Are crop yields normally distributed?", American Journal of Agricultural Economics 81:287-304. Just, R.E., and D. Zilberman (1983), "Stochastic smacture, farm size and technology adoption in developing agriculture", Oxford Economic Papers 35:307-328. Kahneman, D., and A. Tversky (1979), "Prospect theory: An analysis of decision under risk", Econometrica 47:263 -291. Karp, L.S. (1988), "Dynamic hedging with uncertain production", International Economic Review 29:621637. Karp, L.S., and A. Pope (1984), "Range management under uncertainty", American Journal of Agricultural Economics 66:437-446. Katz, E. (1981), "A note on a comparative statics theorem for choice under risk", Journal of Economic Theory 25:318-319. Kimball, M.S. (1990). "Precautionary saving in the small and in large", Econometfica 58:53-73.
Ch. 2:
Uncertainty, Risk Aversion, and Risk Management for Agricultural Producers
149
Knight, E (1921), Risk, Uncertainty and Profit (Houghton Mifflin, Boston). Knight, T.O., and K.H. Coble (1997), "Survey of U.S. multiple peril crop insurance literature since 1980", Review of Agricultural Economics 19:128-156. Krause, M. (1979), "A comparative static theorem for choice under risk", Journal of Economic Theory 21:510-517. Lapan, H., and G. Moschini (1994), "Futures hedging under price, basis, and production risk", American Journal of Agricultural Economics 76:465-477. Lapan, H., and G. Moschini (1996), "Optimal price policies and the futures markets", Economics Letters 53:175-182. Lapan, H., G. Moschini and S. Hanson (1991), "Production, hedging and speculative decisions with options and futures markets", American Journal of Agricultural Economics 72:66-74. Lapan, H., G. Moschini and S. Hanson (1993), "Production, hedging and speculative decisions with options and futures markets: Reply", American Journal of Agricultural Economics 75:748-750. Leahy, J.V. (1993), "Investment in competitive equilibrium: The optimality of myopic behavior", Quarterly Journal of Economics 108:1105-1133. Lence, S.H. (1995), "On the optimal hedge under unbiased futures prices", Economics Letters 47:385-388. Lance, S.H. (1996), "Relaxing the assumptions of minimum-variance hedge", Journal of Agricultural and Resource Economics 21:39-55. Lin, W. (1977), "Measuring aggregate supply response under instability", American Journal of Agricultural Economics 59:903-907. Lin, W., G. Dean and C. Moore (1974), "An empirical test of utility vs. profit maximization in agricultural production", American Journal of Agricultural Economics 56:497-508. Losq, E. (1982), "Hedging with price and output uncertainty", Economic Letters 10:65-70. Love, H.A., and S.T. Buccola (1991), "Joint risk preference-technology estimation with a primal system", American Journal of Agricultural Economics 73:765-774. Luo, H., J.R. Skees and M.A. Marchant (1994), "Weather information and the potential for inter-temporal adverse selection", Review of Agricultural Economics 16:441-451. Machina, M.J. (1987), "Choice under uncertainty: Problems solved and unsolved", Journal of Economic Perspectives 1:121-154. MacMinn, R.D., and A.G. Holtmann (1983), "Technological uncertainty and the theory of the firm", Southern Economic Journal 50:120-136. Mahul, O. (1999), "Optimum area yield crop insurance", American Journal of Agricultural Economics 81. Marcus, A.J., and D.M. Modest (1984), "Futures markets and production decisions", Journal of Political Economy 92:409-426. Markowitz, H. (1952), "Portfolio selection", Journal of Finance 7:77-91. Mas-Colell, A., M.D. Whinston and J.R. Green (1995), Microeconomic Theory (Oxford University Press, Oxford). McKinnon, R.I. (1967), "Futures markets, buffer stocks, and income instability for primary producers", Journal of Political Economy 75:844-861. Menger, K. (1934), "Das unsicherheitsmoment in der wertlehre", Zeitschrift ftir National6konomie. Translation in: M. Shubik, ed., 1967, Essays in Mathematical Economics in Honor of Oskar Morgenstern (Princeton University Press, Princeton). Meyer, J. (1987), "Two-moment decision models and expected utility maximization", American Economic Review 77:421-430. Meyer, J., and M.B. Ormiston (1983), "The comparative statics of cumulative distribution function changes for the class of risk averse agents", Journal of Economic Theory 31:153-169. Meyer, J., and M.B. Ormiston (1985), "Strong increases in risk and their comparative statics", International Economic Review 26:425-437. Meyer, J., and M.B. Ormiston (1989), "Deterministic transformations of random variables and the comparative statics of uncertainty", Journal of Risk and Uncertainty 2:179-188.
150
G. Moschini and D.A. Hennessy
Miranda, M.J. (1991), "Area-yield crop insurance reconsidered", American Journal of Agricultural Economics 73:233-242. Miranda, M.J., and J.W. Glanber (1991), "Providing crop disaster assistance through a modified deficiency payment program", American Journal of Agricultural Economics 73:1233-1243. Miranda, M.J., and J.W. Glauber (1993), "Estimation of dynamic nonlinear rational expectations models of primary commodity markets with private and government stockholding', Review of Economics and Statistics 75:463-470. Miranda, M.J., and J.W. Glauber (1997), "Systemic risk, reinsurance, and the failure of crop insurance markets", American Journal of Agricultural Economics 79:206-215. Moscardi, E., and A. de Janvry (1977), "Attitudes toward risk among peasants: An econometric approach", American Journal of Agricultural Economics 59:710-716. Moschini, G. (1999), Production Risk and the Estimation of Ex-ante Cost Functions, Staff Paper # 315 (Department of Economics, Iowa State University). Forthcoming, Journal of Econometrics, 2001. Moschini, G., and H. Lapan (1992), "Hedging price risk with options and futures for the competitive firm with production flexibility", International Economic Review 33:607-618. Moschini, G., and H. Lapan (1995), "The hedging role of options and futures under joint price, basis, and production risk", International Economic Review 36:1025-1049. Moss, C.B., and J.S. Shonkwiler (1993), "Estimating yield distributions with a stochastic trend and nonnormal errors", American Journal of Agricultural Economics 75:1056-1062. Myers, R.J. (1988), "The value of ideal contingency markets in agriculture", American Journal of Agricultural Economics 70:255-267. Myers, R.J. (1989), "Econometric testing for risk averse behavior in agriculture", Applied Economics 21:542552. Myers, R.J., and S.D. Hanson (1996), "Optimal dynamic hedging in unbiased futures markets", American Journal of Agricultural Economics 78:13-20. Myers, R.J., and S.R. Thompson (1989), "Generalized optimal hedge ratio estimation", American Journal of Agricultural Economics 71:858-868. Nelson, D.B. (1990), "Stationarity and persistence in the GARCH(1,1) model", Econometric Theory 6:318334. Nelson, C.H., and RV. Preckel (1989), "The conditional beta distribution as a stochastic production function", American Journal of Agricultural Economics 71:370-378. Neflove, M. (1958), The Dynamics of Supply: Estimation of Farmers Response to Price (Johns Hopkins University Press, Baltimore). Newbery, D.M. (1988), "On the accuracy of the mean-variance approximation for futures markets", Economics Letters 28:63-68. Newbery, D.M.G., and J.E. Stiglitz (1981), The Theory of Commodity Price Stabilization - A Study in the Economics of Risk (Clarendon Press, Oxford). O'Donnell, C.J., and A.D. Woodland (1995), "Estimation of Australian wool and lamb production technologies under uncertainty: An error components approach", American Journal of Agricultural Economics 77:552-565. Ormiston, M.B. (1992), "First and second degree transformations and comparative statics under uncertainty", International Economic Review 33:33-44. Pagan, A.R., and G.W. Schwert (1990), "Alternative models for conditional stock volatility", Journal of Econometrics 45:267-290. Paris, Q. (1989), "Broken symmetry, symmetry, and price uncertainty", European Economic Review 33:12271239. Pesaran, M.H. (1987), Limits to Rational Expectations (Blackwell Press, Oxford). Pitt, M.M., and G. Sumodiningrat (1991), "Risk, schooling and the choice of seed technology in developing countries: A meta-profit function approach", International Economic Review 32:457-473. Pope, R.D. (1978), "The expected utility hypothesis and demand-supply restrictions", American Journal of Agricultural Economics 60:619-627.
Ch. 2:
Uncertainty, Risk Aversion, and Risk Management for Agricultural Producers
151
Pope, R.D. (1980), "The generalized envelope theorem and price uncertainty", International Economic Review 21:75-86. Pope, R.D. (1988), "A new parametric test for the structure of risk preferences", Economics Letters 27:117121. Pope, R.D., and J.-E Chavas (1994), "Cost functions under production uncertainty", American Journal of Agricultural Economics 76:196-204. Pope, R.D., and R.E. Just ( 1991 ), "On testing the structure of risk preferences in agricultural supply analysis", American Journal of Agricultural Economics 73:743-748. Pope, R.D., and R.E. Just (1996), "Empirical implementation of ex-ante cost functions", Journal of Econometrics 72:231-249. Pope, R.D., and R.A. Kramer (1979), "Production uncertainty and factor demands for the competitive firm", Southern Economic Journal 46:489-501. Pratt, J. (1964), "Risk aversion in the small and in the large", Econometrica 32:122-236. Purvis, A., W.G. Boggess, C.B. Moss and J. Holt (1995), "Technology adoption decisions under irreversibility and uncertainty: An ex ante approach", American Journal of Agricultural Economics 77:541-551. Pyle, D.H., and S.J. Turnovsky (1970), "Safety first and expected utility maximization in mean-standard deviation portfolio analysis", Review of Economics and Statistics 52:75-81. Qniggin, J. (1993), Generalized Expected Utility Theory - The Rank-Dependent Model (Kluwer Academic Publishers, Boston). Quiggin, J., G. Karagiannis and J. Stanton (1993), "Crop insurance and crop production: An empirical study of moral hazard and adverse selection", Australian Journal of Agricultural Economics 37:95-113. Ramaswami, B. (1992), "Production risk and optimal input decisions", American Journal of Agricultural Economics 74:860-869. Ramfrez, O.A. (1997), "Estimation and use of a multivariate parametric model for simulating heteroskedastic, correlated, nonnormal random variables: The case of corn belt corn, soybean, and wheat yields", American Journal of Agricultural Economics 79:191-205. Rausser, G.C., and E. Hochman (1979), Dynamic Agricultural Systems: Economic Prediction and Control (North-Holland, New York). Ray, D. (1998), Development Economics (Princeton University Press, Princeton NJ). Robison, L.J., and EJ. Barry (1987), The Competitive Firm's Response to Risk (MacMillan, New York). Rolfo, J. (1980), "Optimal hedging under price and quantity uncertainty: The case of a cocoa producer", Journal Political Economy 88:100-116. Rosenzweig, M.R., and H.E Binswanger (1993), "Wealth, weather risk and the composition and profitability of agricultural investments", Economic Journal 103:56-78. Rothschild, M., and J.E. Stiglitz (1970), "Increasing risk: I. A definition", Journal of Economic Theory 2:225243. Rothschild, M., and J.E. Stiglitz (1971), "Increasing risk: II. Its economic consequences", Journal of Economic Theory 3:66-84. Roumasset, J.A., M.W. Rosegrant, U.N. Chakravorty and J.R. Anderson (1989), "Fertilizer and crop yield variability: A review", in: J.R. Anderson, and EB.R. Hazell, eds., Variability in Grain Yields (Johns Hopkins University Press, Baltimore) 223-233. Saha, A. (1993), "Expo-power utility: A 'flexible' form for absolute and relative risk aversion", American Journal of Agricultural Economics 75:905-913. Saha, A., C.R. Shumway and H. Talpaz (1994), "Joint estimation of risk preference structure and technology using expo-power utility", American Jottrnal of Agricultural Economics 76:173-184. Sakurai, T., and T. Reardon (1997), "Potential demand for drought insurance in Burkina Faso and its determinants", American Journal of Agricultural Economics 79:1193-1207. Samuelson, E (1952), "Probability, utility, and the independence axiom", Econometrica 20:670-678. Sandmo, A. (1971), "On the theory of the competitive firm under price uncertainty", American Economic Review 61:65-73. Savage, L.J. (1954), The Foundations of Statistics (Wiley, New York).
152
G. Moschini and D.A. Hennessy
Sengupta, J.I., and R.E. Sfeir (1982), "Risk in supply response: An econometric application", Applied Economics 14:249-268. Sharpe, W.E (1963), "A simplified model for portfolio analysis", Management Science 2:277-293. Sigurdson, D., and R. Sin (1994), "An aggregate analysis of Canadian crop insurance policy", in: D.L. Hueth, and W.H. Furtan, eds., Economics of Agricultural Crop Insurance: Theory and Evidence (Kluwer Academic Publishers, Boston) 45-72. Sinn, H.-W. (1989), "Two-moment decision models and expected utility maximization: Comment", American Economic Review 79:601-602. Skees, J.R., and M.R. Reed (1986), "Rate-making for farm-level crop insurance: Implications for adverse selection", American Journal of Agricultural Economics 68:653-659. Smale, M., R.E. Just and H.D. Leathers (1994), "Land allocation in HYV adoption models: An investigation of alternative explanations", American Journal of Agricultural Economics 76:535-546. Smith, V.H., and A. Baquet (1996), "The demand for multiple peril crop insurance: Evidence from Montana wheat farms", American Journal of Agricultural Economics 78:189-201. Smith, V.H., and B.K. Goodwin (1996), "Crop insurance, moral hazard, and agricultural chemical use", American Journal of Agricultural Economics 78:428-438. Standing Committee on Agriculture and Colonization (1947), Minutes of the Proceedings and Evidence, (Canadian House of Commons, Ottawa, Canada) June 10. Tauer, L.W. (1983), "Target MOTAD", American Journal of Agricultural Economics 65:606-610. Taylor, C.R. (1990), "Two practical procedures for estimating multivariate nonnormal probability density functions", American Journal of Agricultural Economics 72:210-218. Teague, M.L., D.J. Bemardo and H.E Mapp (1995), "Farm-level economic analysis incorporating stochastic environmental risk assessment", American Journal of Agricultural Economics 77:8-19. Tobin, J. (1958), "Liquidity preference as behavior towards risk", Review of Economic Studies 25:65-86. Tolley, H.D., and R.D. Pope (1988), "Testing for stochastic dominance", American Journal of Agricultural Economics 70:693-700. Traill, B. (1978), "Risk variables in econometric supply models", Journal of Agricultural Economics 29:5361. Traxler, G., J. Falck-Zepeda, R.J.I. Ortiz-Monasterio and K. Sayre (1995), "Production risk and the evolution of varietal technology", American Journal of Agricultural Economics 77:1-7. Turvey, C.G. (1992a), "An economic analysis of alternative farm revenue insurance policies", Canadian Journal of Agricultural Economics 40:403-426. Turvey, C.G. (1992b), "Contingent claim pricing models implied by agricultural stabilization and insurance policies", Canadian Journal of Agricultural Economics 40:183-198. Udry, C. (1994), "Risk and insurance in a rural credit market: An empirical investigation in Northern Nigeria", Review of Economic Studies 61:495-526. United States Department of Agriculture (1996), Agricultural Statistics (various issues from 1990 to 1996). United States General Accounting Office (1999), Agriculture in Transition - Farmers' Use of Risk Management Strategies, GAO/RCED-99-90, Washington, D.C. Vercammen, J., and G.C. van Kooten (1994), "Moral hazard cycles in individual-coverage crop insurance", American Journal of Agricultural Economics 76:250-261. von Neumann, J., and O. Morgenstern (1944), Theory of Games and Economic Behavior (Princeton University Press, Princeton). Vukina, T., D. Li and D.M. Holthausen (1996), "Hedging with crop yield futures: a mean-variance analysis", American Journal of Agricultural Economics 78:1015-1025. Williams, J. (1986), The Economic Functions of Futures Markets (Cambridge University Press, Cambridge, U.K.). Williams, J.R., G.L. Carriker, G.A. Bamaby and J.K. Harper (1993), "Crop insurance and disaster assistance designs for wheat and grain sorghum", American Journal of Agricultural Economics 75:435-447. Wright, B.D. (1993), "Public insurance of private risks: Theory and evidence from agriculture", in: M.S. Sniderman, ed., Government Risk Bearing (Kluwer Academic Publishers, Boston).
Ch. 2:
Uncertainty, Risk Aversion, and Risk Management for Agricultural Producers
153
Wright, B.D., and J.D. Hewitt (1990), All Risk Crop Insurance: Lessons from Theory and Experience (Giannini Foundation, California Agricultural Experiment Station, Berkeley). Young, D.L. (1979), "Risk preferences of agricultural producers: Their use in extension and research", American Journal of Agricultural Economics 61:1067-1070.
Chapter 3
EXPECTATIONS, INFORMATION AND DYNAMICS MARC NERLOVE
Department of Agricultural and Resource Economics, University of Maryland, College Park, MD DAVID A. BESSLER
Department of Agricultaral Economics, Texas A & M University, College Station, TX
Contents
Abstract 1. Introduction 2. Expectations and dynamic optimization 2.1. The structure of the problem 2.2. Examples of the separation of expectations and constraints in dynamic decision making 2.2.1. The Nerlove supply model 2.2.2. A model of small ruminant production and supply
3. Alternative models of expectation formation 3.1. Extrapolative 3.2. Adaptive 3.3. Implicit expectations 3.4. Rational expectations and quasi-rational expectations 3.5. Futures price based models of expectation formation
4. Empirical studies of expectation formation 4.1. Direct versus indirect tests 4.2. Indirect tests 4.2.1. Minimalist tests 4.2.2. Tests based on "final form" VAR or VARMA models 4.2.3. Tests in a structural context 4.2.4. Futures-based models of expectation formation 4.3. Tests based on direct observation 4.3.1. What can we learn by asking people what they expect? 4.3.2. Experimental data 4.3.3. Survey and semi-survey data 4.3.4. Summary of the evidence
5. Conclusions and directions for further research Acknowledgements References
Handbook of Agricultural Economics, Volume l, Edited by B. Gardner and G. Rausser © 200l Elsevier Science B.V. All rights reserved
156 157 158 158 160 160 162 166 167 167 170 172 176 178 178 179 179 180 180 181 184 184 187 191 196 197 201 201
156
M. Nerlove and D.A. Bessler
Abstract
The role of expectations in the empirical analysis of agricultural supply is examined under the assumption of separation of expectations and constraints in dynamic decision making. Extrapolative, adaptive, implicit, rational and quasi-rational, and futures-based models of expectation formation are discussed. Empirical and experimental evidence for and against various models of expectation is summarized. J E L classification:
Q11
Ch. 3: Expectations,Informationand Dynamics
157
"We decide on one particular course of action out of a number of rival courses because this one gives us, as an immediately present experience, the most enjoyment by anticipation of its outcome. Future situations and events cannot be experienced and therefore their degree of desirableness cannot be compared: but situations and events can be imagined, and the desirableness of these experiences which happen in the imagination can be compared. What gives imagined things a claim to be treated as the equivalents of future things? It is some degree of belief that the imagined things will take actual shape at the dates we assign to them." G.L.S. Shackle, 1952. "All production is for the purpose of ultimately satisfying a consumer. Time usually elapses, however- and sometimes much time - between the incurring of costs by the producer (with the consumer in view) and the purchase of the output by the ultimate consumer ... Meanwhile the entrepreneur ... has to form the best expectations he can as to what the consumers will be prepared to pay when he is ready to supply them (directly or indirectly) after the elapse of what may be a lengthy period; and he has no choice but to be guided by these expectations, if he is to produce at all by processes which occupy time.., the behaviour of each individual firm.., will be determined by its short-term expectations... The actually realised results ... will only be relevant in so far as they cause a modification of subsequent expectations. John Maynard Keynes, 1936.
1. Introduction We consider the role of expectations and new information in agricultural economics, with reference to other work on expectation formation. The chapter is presented in four main parts. In the opening section we describe the structure of the problem of modeling dynamic optimizing behavior under uncertainty. Central to almost all treatments of the subject since the work of Keynes and Hicks in the 1930s is the separation assumption, in which dynamic decision problems are modeled by separating expectation formation from optimizing behavior. Two examples of dynamic models of agricultural supply response are used to illustrate the approach. In the second part, we present the five principal alternative approaches for modeling expectation formation: extrapolative expectations, adaptive expectations, implicit expectations, rational and quasi-rational expectations, and futures markets. In the third part, we consider the evidence on the validity of these five approaches, focusing primarily on rational expectations and the more operational variant, quasi-rational expectations. Evidence from both indirect tests, such as restrictions on parameters in an econometric model, and direct tests, such as tests of unbiasedness and orthogonality of elicited expectations obtained from survey and experiments, is presented. The chapter concludes by offering directions for future research.
158
M. Nerlove and D.A. Bessler
2. Expectations and dynamic optimization 2.1. The structure o f the problem If current decisions did not constrain future possibilities, opportunities, or costs, expectations of future events would not be relevant to these decisions. It is precisely because what we do today constrains what we can do tomorrow that the future is relevant to the present. 1 (See [Nertove (1972)].) Current events influence what we do today both directly and indirectly; directly, because present circumstances affect the desirability or profitability of actions now; indirectly, because events in the present influence our expectations of the future. These two effects may be quite different. What is the relation between dynamic optimization under uncertainty with respect to future opportunities and constraints and how economic agents form their expectations of the future and make decisions and plans? 2 Hicks (1946) found a solution to the problem of formulating a dynamic theory of the firm under certainty by dating all variables and applying static theory to the expanded set of variables and constraints, although, in the end, he was clearly not happy with this solution [Hicks (1977)]. The Hicksian solution essentially converts the dynamic decision-making problem into a static problem. It fails to reveal the dynamic structure of decisions and constraints and to deal explicitly with uncertainty, the costs of information, or the costs of formulating plans and decisions. In principle, we know how to set the problem up as a dynamic programming problem under uncertainty, in which conditional distributions of future u n k n o w n exogenous variables are estimated by using all available information up to the present [Nerlove (1972)]. The problem of costly information is more difficult to incorporate since its value is usually not known until it is acquired, but this problem can be resolved within a Bayesian framework. (See, inter alia, [Horvath and Nerlove (1996), Kiefer (1988-89)].) In such a "theoretically correct" formulation, decisions and expectations are not separable; the explanation of behavior proceeds directly from assumptions about agents' priors and the dynamic constraints of their optimization problem to the decisions they take now and in the future in response to future events. 3
1 Thisis also true with respect to future events over which we have no control, such as events after one's death. The imminentend of the world, if known,wouldcertainlychangebehaviortoday because constraints current behavior would impose on future options would no longer hold after the end of the world. In this sense, the future matters because of the constraintsit wouldimpose on currentbehaviorif there were a future. 2 The problemof what constitutesrationalbehaviorin a dynamiccontext is not so simple;see [McClennen (1990)] for a careful analysisfrom a philosopher'spointof view.Nor is it a trivialmatterto make the concepts of informationand uncertaintyprecise. There is a very extensive literature in economics on these matters which has been artfullysummarizedand integrated in [Hn'shleiferand Riley (1992)]. 3 Notwithstanding,Mundiak (1966, 1967) has suggested that a dynamictheory should be formulatedin a manner which takes explicit account of the restrictions implied by the Hicksian extensionof static theory. This is an extreme form of the separationassumption,to which we wouldnot subscribe.As Treadway (1967) has shown,the propositionsof usualcomparativestatic theory do not generallyhold in a dynamiccontext. But
Ch. 3: Expectations, Information and Dynamics
159
The theoretically correct formulation of the problem of dynamic decision making under uncertainty does not lend itself to empirical application, nor has it generally been adopted in studies of agricultural supply or other topics investigated by agricultural economists and, more generally, in empirical studies of expectations and plans (see [Nerlove (1983)], and the references cited therein). Instead, a separation between expectations and decisions is made and the effects of changing expectations on behavior is analyzed. "The Hicksian model of dynamic planning under certainty is the basis for a more empirically relevant framework for the analysis of plans and expectations .... The Hicksian assumption of certainty means that information about the future value of a variable is single valued and costless. We continue to regard expectations and plans as single valued but recognize that the economic agent knows that they may turn out to be wrong. As of a particular date, information about the future can be acquired only at a cost, albeit a cost which decreases for a particular future date as that date draws near. Planning and decision making are themselves costly activities. Therefore only what is necessary to plan will be planned, only decisions which cannot be postponed will be made, and only the information about the future necessary to those plans and decisions and only to the accuracy warranted by the cost of error will be gathered. Plans will not always be fulfilled, single-valued expectations will often turn out to be wrong, and both will be continually revised" [Nerlove (1983, p. 1252)]. We refer to the assumption that dynamic decision problems can be analyzed in terms of expectations and the impact of expectations on decisions as the separation assumption. It is clearly only an approximation, albeit an empirically and theoretically useful one. Even when the separation assumption is adopted, there is another serious nroblem which models of expectation formation and dynamic behavior share with most other models on which econometric analyses are based: they typically assume a representative economic agent whose optimizing decisions are the basis for the analysis. Not only does such an assumption raise the question so ably and concisely discussed by Kirman (1992), but another branch of the literature has emphasized the role of heterogeneity this does not mean that separation of expectations and optimizing behavior is impossible within the context of an appropriately formulated dynamic model [Nerlove (1972)]. The econometric modeling of dynamic decision making processes has recently enjoyed a resurgence of interest; see, for example Kapteyn, Kiefer, and Rust (1995), especially the paper by Miranda and Schnitkey (1995). It is, however, not clear to us whether such econometric "fine-tuning" is really desirable, notwithstanding Nerlove (1972) and more recently Nerlove and Fornari (1997). Carrying forward the research of more than two decades, Hildenbrand (1994), for example, shows that the specification of behavioral relationships at the individual level does not play a dominant role in determining the sort of relationship commonly estimated econometrically. He argues, in the context of cross-section expenditure studies, that certain invariant features of the distribution of household characteristics and attributes are much more important in determining the relationships of interest, and that these can be derived without any need to specify a precise model of microeconomic behavior. We believe that Hildenbrand's conclusions are valid generally and beyond the context of econometric analysis of household expenditure surveys. Many restrictions imposed by microeconomic theory, whether static or dynamic, are of very limited value in improving econometric estimation. Other aspects of the data-generating process are much more important. To attempt to fine-tune the econometrics by imposing such restrictions can lead to results which may be highly misleading.
M. Nerlove and D.A. Bessler
160
of expectations in the determination of aggregate outcomes [Nerlove (1983), Frydman and Phelps (1983)]. Such heterogeneity is inconsistent with the representative agent assumption. 4
2.2. Examples of the separation of expectations and constraints in dynamic decision making The device of separation of expectations from plans and decisions and the utility of such separation in both theory and empirical analysis may be illustrated by two models of agricultural supply: The first of these examples is the well-known model of agricultural supply response developed by Nerlove (1956a, 1956b, 1958c) for corn, cotton, and wheat in the U.S. The second is a more elaborate model of small ruminant production and supply in Indonesia developed by Nerlove and Soedjana (1996). 5 The importance of the second example is to show that a comparative static analysis is possible in models involving both dynamic optimization and uncertainty, even though the process of expectation formation is not specified, as long as the separation assumption is maintained. The representative agent assumption is also common to these examples.
2.2.1. The Nerlove supply model 6 Stripped to its essentials, this model for an annual crop consists o f three equations:
At - A t - I = v ( A t - A t - l ) , P? - P?-I = ~(~-i
- e,*-l),
A t = a 0 + a l P * +a2Zt + Ut,
(1) (2) (3)
where At is actual area under cultivation in t; Pt, actual price of the crop per unit in t; A t , "desired" or equilibrium area to be under cultivation in t; P , , "expected normal" price in t for subsequent future periods; Zt, other observed, presumably exogenous, factors; Ut, unobserved, "latent" factors affecting area under cultivation in t; and/3 and ~, are "coefficients o f expectation and adjustment", reflecting the responses of expectations to observed prices and observed areas under cultivation to changes in equilibrium areas.
4 See also the discussion of heterogeneity in the determination of aggregate outcomes in the preceding footnote. 5 The interesting study of Miranda and Schnitkey (1995) does not employ this separation. They assume that the two relevant stochastic variables, revenue less variable cost of milk and the market price of a heifer less the slaughter value of a replace cow, follow a first-order vector autoregression (VAR), known to the dairy farmer, the parameters of which are to be estimated along with the rest of their model. However, such a model could be interpreted in terms of rational or quasi-rational expectations under the separation assumption; see below, Section 3.4. 6 This discussion is taken from [Nerlove (1979)].
Ch. 3: Expectations, Information and Dynamics
161
The statistical problems of estimating a model such as (1)-(3), particularly of identifying relevant observed exogenous variables, not subject to expectational lags, and problems due to serially correlated disturbances, are well known. In addition, the use of area cultivated, one input in the production process to represent planned output, the problem of choosing the relevant price or prices, and other issues of specification, such as the inclusion of expected yields, weather conditions, and price and yield variances to take account of elements of risk, have been widely discussed in the literature (see, for example, inter alia [Just (1974), Askari and Cummings (1976, 1977)]). The Nerlove supply response model incorporates dynamic elements in two different ways: First, a distinction is made between a long-run equilibrium position, toward which producers are assumed to be moving, and their current position. The former is determined on the basis of a static theory of optimization, in this case the standard microeconomic theory of the firm and the assumption that the exogenous variables of the problem, in this case mainly prices, are given once and for all. Nerlove (1972, p. 225) called this the assumption of static, or stationary, expectations. The important point is that whatever these expectations are and however they are formed, the concept of a long-run equilibrium solution to the optimization problem is well defined only if it can be assumed that the values of the exogenous variables expected in the future are unchanging; it does not matter if the constant future value of each variable differs from its current value, as indeed it plausibly will. Having a well-defined notion of a long-run equilibrium position then permits us to examine the question of why producers are currently at a position different from that equilibrium. At this point the discussion usually becomes vague; one can argue in various ways (Nerlove, 1972, pp. 228-231), but perhaps the most common approach is through the introduction of adjustment costs. Rarely, however, are models explicitly introducing these costs formulated or the rationale for such costs carefully examined. 7 The dynamic element in the basic supply response models is introduced at this point without a formal theory by the simple ad hoc assumption that in each period, if we are dealing with discrete time, a fraction of the difference between the current position and the long-run equilibrium is eliminated, i.e., Equation (1) above. The second way in which dynamic elements are incorporated in the basic supply response model is through a description of expectation formation, e.g., the adaptive expectations generated by Equation (2), in which expected "normal" prices are revised each period in proportion to the difference between last period's observed price and the previous expectation. Above, we argued that static, or stationary, expectations are necessary to make the concept of a long-run equilibrium meaningful; the adaptive expectations model does not violate this principle, since it is not solely next period's price to which Pt* refers but "normal" price, i.e., an average price expected to prevail in all future periods. Nerlove (1956a, 1956b, 1958c) makes the argument that farmers rationally 7 The literature up to about 1970 is surveyed, and two models of investment behavior incorporating both separable and non-separable adjustment costs are discussed, in [Nerlove (1972, pp. 231-241)]; see also [Nerlove et al. (1979 and 1995, pp. 317-320)].
162
M. Nerlove and D.A. Bessler
should respond, not to the best forecast they can make of next period's price, but rather to some average or "normal" level; the argument rests intuitively on the idea that there are costs of adjustment. However, virtually any plausible model one can construct, with costs of rapid adjustment of, say, a durable factor of production, will generally involve response to prices in many future periods, although the weights which attach to the more distant future will usually be less than to the near future. Moreover, unless the optimization problem has a specific form, it will generally be non-optimal to behave as if one were responding to a point estimate of each future value. When the optimization problem is of this specific form, however, we say that there exist certainty equivalents to the uncertain future values of the variables to which response is occurring [Theil (1957), Malinvaud (1969)]. Such certainty equivalents are the conditional expectations of the variables to which they refer; they are minimum-mean-square-error forecasts based on the information available up to the time the forecast is made and taking into account the structure of the system generating the data. Muth (1961) has termed such forecasts "rational expectations". We will discuss rational expectations models of agricultural supply at some length below. 2.2.2. A model of small ruminant production and supply The dynamics of annual crop supply are particularly simple; their very simplicity may obscure the relation between expectations and dynamic optimizing behavior. Better examples of greater dynamic complexity may be found in the study of perennial crops, such as rubber, coffee, cocoa, palm oil or asparagus, or of livestock. The following model shows that a comparative static analysis is possible in models involving both dynamic optimization and uncertainty, even though the process of expectation formation is not specified, as long as the separation assumption is maintained. Nonetheless, it also illustrates the importance of expectations in determining dynamic optimizing behavior. Small ruminant production and supply presents an ideal case to illustrate the points made above, being neither too simple nor, because of the short gestation and maturation period of the animals, as complex as cattle and many perennial crops. The following development is based on Nerlove and Soedjana (1996), hereinafter N&S, whose primary purpose is to elucidate the role which small ruminants play as a store of value in the context of traditional Indonesian society. In their paper, details of which are not elsewhere published, they make considerable use of neoclassical monetary theory, an aspect of the analysis which we neglect here. Small ruminants in general are referred to as "sheep". N&S assume that sheep live for two periods. In the first period, they are gestating or prepubescent. In the second period, all the time that they remain in the herd, they reproduce at a rate oe > 1. At the end of the first period, which is the same as the beginning of the second period, some are sold and do not survive to reproduce. Let St = the stock of sheep at the beginning of period t; st+l = sales at the end of period t or the beginning of period t + 1.
Ch. 3." Expectations, Information and Dynamics
163
Then, the stock at the beginning of period t + 1 is St+l = oe[St - st+l].
(4)
Let C(S) = the costs of maintaining a herd of size S for one period;
Pt = the price per sheep sold expected in period t; P0 = the actual price in the current period, t = 0, at the end of which so sheep are sold. Assume that these expectations are held with certainty, or alternatively, that the structure of the problem is such as to admit of certainty equivalents. Let So be the initial herd size. The costs of maintaining this herd during the first period are sunk costs and must be borne out of revenues generated previously. Current gross revenue at the end of the initial period is posl, but the costs of maintaining the herd in the following period C(S1) must be paid from these revenues, so that net revenue in the current period is Ro = posl C(SI). In general, -
Rt = ptst+l - C(St+l),
t -~ 0, 1 . . . . .
(5)
Along the lines of neoclassical monetary theory, N&S assume that the utility function of the representative farmer is additively separable over time and a homothetically weakly separable function of the stock of sheep and current revenue (which can be taken as a Hicks-composite commodity if the prices of real commodities consumed by the farmer are assumed not to change). That is, we assume that the farmer's consumption decisions are determined by maximizing a "branch" utility function in real commodities given the revenues realized from the sale of sheep at the beginning of each period. Thus, the utility of the farmer in each period is given by (6) Given the additive temporal separability of total utility, as is well known [Barro (1974), Barro and Becker (1989), Nerlove and Raut (1997)], total utility can be expressed as
where 0 1 multiplies both # and C f to account for the fact that a sheep saved today will become c~ sheep tomorrow. The left-hand side of (1 O) is proportional to marginal cost. Average cost may decline initially for very small herd sizes because of certain fixed costs such as barns, but must rise after a certain size of herd (rather small in semi-subsistence Indonesian agriculture),
Ch. 3." Expectations,Information and Dynamics Rps.
Value
165
A
/
°cYl - PoJ
S12
$11
S~
Figure 1. Relationshipof the optimal stock of livestockto prices and costs.
and, at some point, begin to rise steeply because of the labor and other resource constraints which the farmer faces. The behavior of the right-hand side is more problematic: U22 ~< 0, so that the second term of/~ must be declining with Sl, but if expected future prices of sheep are rising fast enough, v t may not decline with $1, even if marginal future costs of increasing herd size are rising rapidly. N&S assume that this is not the case. 8 This provides the first illustration of the power of the separation assumption. The solution is graphically depicted in Figure 1. It is apparent both from Equation (10) and the figure that an increase in the current price of sheep, expectations of future prices unchanged, will lead, ceteris paribus, to a decline in the herd size next period, and thus to an increase in sales. But if an increase in the current price is accompanied by an increase in expectations of future prices, causing a rise in/z sufficient to offset the increase in Po, the current supply of sheep to the market may actually decline. (Of course, this is true irrespective of whether the stock of sheep enters the utility function directly.)
8 Thiscorresponds to the well-knowntransversalitycondition,whichis generallyassumedin dynamicoptimization problems (see [Stokey and Lucas (1989, p. 98)]. If this conditiondoes not hold and if expectations of rapidly rising future prices are not offset by rapidly rising costs of future herd size,/x may rise with S1, in which case an equilibriumof the producer would still exist in the rising part of the aC I curve, but not in the region of increasingreturns to herd size in which o~CI is falling.
166
M, Nerlove and D.A. Bessler
The rationale for such perverse supply response to price, in general, was cogently argued by Jarvis (1986) and Rosen (1986); Jarvis' empirical verification for Argentine beef cattle relied on ad hoc assumptions about expectation formation; Nerlove and Fornari (1997) provide evidence for the UIS. beef cattle industry of a positive response to current price holding expectations of future prices constant, but a negative response to increases in expected future prices holding current prices constant, using a rational expectations model of price expectation formation. The N & S result, as is the case with Rosen's result, is free of any significant restriction on the nature of expectation formation. If the ce/x - P0 curve cuts the ~ C I curve in the segment of the latter that is rising extremely rapidly, we would expect to observe hardly any supply response either to current price or to expected future prices. 9 As the foregoing model illustrates, it is unnecessary to make any specific assumption about the formation of expectations to derive useful results concerning the role of expectations in the determination of dynamic optimizing behavior. Nonetheless, in order to study such behavior econometrically, it is necessary to specify a model of the way in which expectations are formed. To this we now turn.
3. Alternative models of expectation formation 1° In this section we examine the leading models of expectation formation used in empirical time series analysis of agricultural supply and in other areas of applied economics. The justification for considering models of expectation formation in the context of a model of economic (optimizing) behavior rests in large part on the separation assumption discussed above, to which must be added the assumptions that (1) group behavior can be adequately explained by treating it as the behavior of a single representative and hypothetical decision maker (the representative agent assumption); and (2) the representative decision maker behaves as if responding to single-valued certainty equivalents (the certainty equivalent assumption). The expectations, to which economic agents are assumed to respond, are both subjective and aggregative. They are not necessarily, or even generally, directly observable. The problem in empirical analysis discussed in this
9 Many other results follow from this model. For example, N&S deduce the effects of improved access to financial institutions: Changes in the effectiveness with which local financial institutions serve the semisubsistence Indonesian farmer will, in the first instance, primarily affect U2, the direct marginal utility of holding an additional sheep in the herd. Less directly, changes in U2 will also affect/z, the value of future maximized net revenues from sheep raising. If U2 is set to zero v~, the future value of having a sheep in the herd will fall even if expectations of future prices and costs are unchanged; the term U2 in/z will be eliminated entirely. Consequently, the entire curve c~/z- P0 will shift downwards relative to the c~Ct curve. Unless, before the assumed change the curves crossed in the very nearly vertical portion of the aC t curve and still cross there, the optimal herd size will be reduced by better access to financial institutions. This situation is depicted in Figure 1 by the vertical portion of the ceCI curve. 10 This section is adapted from [Nerlove (1958c, Chapter 2), Nerlove (1961), and Nerlove and Fornari (1997)].
Ch. 3: Expectations, Information and Dynamics
167
section is to construct a hypothesis which relates these expectations to observable variables. In this section we will consider five types of models or approaches to the study of expectation formation within the context of a simple model of supply response: (a) Extrapolative; (b) Adaptive; (c) Implicit; (d) Rational and Quasi-Rational; and (e) Futures Market Based. In the next section, we consider research when data related to expectations are more directly observable, for example from surveys or experiments. One can argue that futures prices, when available, are intermediate between direct and indirect observation of expectations.11 3.1. Extrapolative
The classical approach in agricultural supply analysis (at least prior to [Nerlove (1956a, 1956b)] was to suppose that expectational variables could be directly identified with some past actual value of the variable to which the expectation refers. For example, the supply of an agricultural commodity at a future time depends on its price expected at that time. It might be assumed that this expectation is the current value of price, so that supply is simply related to lagged price. An extension of this approach, due to [Goodwin (1947)], is to suppose that expected price in period t is actual price in t - 1 plus (or minus) a fraction of the change in price from period t - 2 to t - 1 : p[ = pt-1 + ot(p~_i - p t - 2 ) ,
(11)
where p [ is the price expected in period t. Muth (1961) calls the expectations generated by (11) "extrapolative". 3.2. Adaptive
The origins of adaptive expectations are somewhat obscure. Nerlove (1956a) attributes the idea to Phillip Cagan in his 1956 Ph.D. dissertation on hyper-inflations; but later (1956b, 1958c) says that the idea is essentially Hicks'. Milton Friedman claims he got the idea from Bill Phillips of Phillips Curve fame. After an exhaustive look at empirical studies of expectations that existed before 1956, here's what Nerlove (1958c, pp. 50-53) writes: ... the main results of the ... studies examined indicate that there is widespread underestimation of actual changes and that forecasters could generally do a better job at predicting the levels of actual outcomes if they used some simple mechanical device such as a projection of the current value of the variable to be predicted. The question immediately arises as to whether entrepreneurs are really trying to forecast a particular value of an economic variable, or whether, as suggested above
11 However,for storable commodities, cash prices also reflect the same information, so that a futures price is no more and no less an expectation than the current price.
M. Nerlove and D.A. Bessler
168
they try to forecast the "normal" level of future values of the variable. As indicated above, entrepreneurs' response to a change which they consider only temporary may be very limited. True, entrepreneurs could make greater profits the more accurate their knowledge of the future; but these profits might not be much greater than those they might make if they altered their plans only in response to changes in the expected level of future values of the economic variable under consideration . . . . Hence, any model of expectation formation should take account of the fact that these expectations probably do not refer to the immediate and temporary future. We may take ... a concept of the normal as a starting point in our development of a model of expectation formation. The discussion at this point may most easily be couched in terms of prices and price expectations. If more specific information is not available, it seems reasonable to assume that the "normal" price expected for some future date depends in some way on what prices have been in the past. Expectations of "normal" price are, of course, shaped by a multitude of influences, so that a representation of expected price as a function of past prices may merely be a convenient way to summarize the effects of these many and diverse influences . . . . How should we use past prices to represent expected "normal" price? Each past price represents only a very short-run market phenomenon, an equilibrium of those forces present in the market at the time . . . . We observe, however, that entrepreneurs' expectations, if taken as forecasts of the immediate future, predict the levels of actual outcomes in the immediate future less well than would a simple naive model forecast of no change. This fact suggests that entrepreneurs do not regard any particular past price or actual outcome as overwhelmingly indicative of long-run normal conditions. If they did their expectations might do better when considered as forecasts. Continuing, Nerlove relates the idea to Hicks' definition of the elasticity of expectations: Hicks may very well have had this notion in mind when he defined "the elasticity of a particular person's expectations of the price of a commodity x as the ratio of the proportional rise in expected future prices of x to the proportional rise in its current price" (1946, p. 205). Hicks, it will be remembered, distinguished two limiting cases: an elasticity of zero, implying no effect of a change in current price upon expected future prices; and an elasticity of one implying that if prices were previously expected to remain constant, i.e., were at their long-run equilibrium level, they will now be expected to remain constant at the level of current price. By allowing for a range of elasticities between the two extremes, Hicks implicitly recognized that a particular past price or outcome may have something, but not everything, to do with people's notion of the "normal". And then the key concept of expected normal price:
Ch. 3: Expectations, Information and Dynamics
169
Past values of prices, then, affect people's notions of the "normal" level of prices; individual past prices do not exert their influence equally, however: more recent prices are a partial result of forces expected to continue to operate in the future; the more recent the price, the more it is likely to express the operation of forces relevant to "normal" price. An obvious extension of this point of view would be the representation of people's notion of "normal" price by a weighted moving average of past prices in which the weights decline as one goes back in time. Using Hicks' concept of an elasticity of expectation we can go beyond this formulation; indeed, we can derive it. Hicks' definition of the elasticity of expectation implies that prices have actually been "normal" up until the time when some change occurred. But, of course, we know that conditions are seldom if ever "normal" in the real world; and "normality" itself is a subjective matter. Let Pt* stand for people's expectation at time t of long-run "normal" price, and let Pt stand for actual price. Hicks' notion may then be expressed by saying that Pt* is last period's expected "normal" price plus some factor depending on the elasticity of expectation and last year's actual price. We will go further than this and say that the adjustment factor is proportional to the difference between actual and expected "normal" price. Intuitively this seems quite reasonable. Mathematically we may write
Pt=P[_I+fi[Pt-I--P[_1I,
O 0. Thus, the production function of the producer is =
Y = g(m)f(Xlhl(m),
X2h2(m) . . . . . X i h l ( m ) ) .
For simplicity, assume that, without any investment in innovation, hi (m) = 1, for all i ; thus, Y = f ( X 1 . . . . . X2). The producer has to determine optimal allocation of re-
216
D. Sunding and D. Zilberman
sources among inputs and research lines. In particular, the choice problem is ! max p g ( m ) f [ X l h l (m), X2h2(m), X3h3 (m), X l h l (m)] - E Xi ,mi
i=1
J wiXi - Z vimi, j=l
where wi is the price of the ith input and vj is the price of one unit of the j t h line of innovation. The first-order condition to determine use of the ith input is OF pg(m)Thi(w) Oei
- wi = 0
(3)
'v'i.
Input i will be chosen at a level where the value of marginal product of input i's effective units, pg (m)~e~' is equal to the price of input i's effective units, which is w i / h i (m). If the innovations have a positive multiplicative effect, g(m) > 1, and increase input use efficiency, hi (m) > 1, then the analysis in [Khanna and Zilberman (1997)] suggests that innovations are likely to increase output but may lead to either an increase or decrease in input use. Input use is likely to increase with the introduction of innovations in cases where they lead to substantial increases in output. Modest output effects of innovations are likely to be associated with reduced input use levels. 2 The optimal effort devoted to innovation line j is determined according to Og
1
Omi p f ( m ) + g ( m ) p Z
Ohi --Xi
i = | Omj
- vj = 0
Yj.
(4)
Let the elasticity of the multiplicative effect of innovation with respect to the level of innovation j be denoted by eg~j Omj Og g(m)' mj and let the elasticity of input i's effectivehi Ohi mj ness coefficient, with respect to the level of innovation j , be emj = amj h-~-"Using (3), the first-order condition (4) becomes -
PY
hi Siemj
egj + i=1
-
-- m j Uj = O,
(5)
_1
where Si = w i X i / P Y is the revenue share of input i. Condition (5) states that, under optimal resource allocation, the expenditure share (in total revenue of innovation line j ) will be equal to the sum of elasticities of the input effectiveness, with respect to research line j, and the elasticity of the multiplicative output coefficient with respect to this research line. This condition suggests that more resources are likely to be allocated to
2 Khanna and Zilberman (1997) related the impact of technological change on input use to the curvature of the production function. If marginal productivityof ei declines substantially with an increase in el, the output effects are restricted and innovation leads to reduced input use.
Ch. 4:
The Agricultural Innovation Process
217
research lines with higher productivity effects that mostly impact inputs with higher expenditure shares that have a relatively lower cost. 3 Risk considerations provide part of the explanation for such diversification, but whether innovations are complements or substitutes may also be a factor. When the tomato harvester was introduced in California, it was accompanied by the introduction of a new, complementary tomato variety [de Janvry et al. (1981)]. McGuirk and Mundlak's (1991) analysis of the introduction of high-yield "green revolution" varieties in the Punjab shows that it was accompanied by the intensification of irrigation and fertilization practices. The induced innovation hypothesis can be expanded to state that investment in innovative activities is affected by shadow prices implied by government policies and regulation. The tomato harvester was introduced following the end of the Bracero Program, whose termination resulted in reduced availability of cheap immigrant workers for California and Florida growers. Environmental concerns and regulation have led to more intensive research and alternatives for the widespread use of chemical pesticides. For example, they have contributed to the emergence of integrated pest management strategies and have prompted investment in biological control and biotechnology alternatives to chemical pesticides. Models of induced innovation should be expanded to address the spatial variability of agricultural production. The heterogeneity of agriculture and its vulnerability to random events such as changes in weather and pest infestation led to the development of a network of research stations. A large body of agricultural research has been aimed at adaptive innovations that develop practices and varieties that are appropriate for specific environmental and climatic conditions. The random emergence of new diseases and pests led to the establishment of research on productivity maintenance aimed at generating new innovations in response to adverse outcomes whenever they occurred. The treatment of the mealybug in the cassava in Africa is a good example of responsive research. Cassava was brought to Africa from South America 300 years ago and became a major subsistence crop. The mealybug, one of the pests of cassava in South America, was introduced to Africa and reduced yields by more than 50 percent in 198384; without treatment, the damage could have had a devastating effect on West Africa [Norgaard (1988)]. The International Institute of Tropical Agriculture launched a research program which resulted in the introduction of a biological control in the form of a small wasp, E lopezi, that is a natural enemy of the pest in South America. Norgaard estimated the benefit/cost ratio of this research program to be 149 to 1, but his calculation did not take into account the cost of the research that established the methodology of biological control, and the fixed cost associated with maintaining the infrastructure to respond to the problem. Induced innovation models such as Binswanger's (1974) are useful in linking the evolution of innovations to prices, costs, and technology. However, they ignore some
3 Binswanger(1974) provesthese assertions under a verynarrow set of conditions.
218
D. Sunding and D. Zilberman
of the important details that characterize the system leading to agricultural innovations. 4 Typically, new agricultural technologies are not used by the entities that develop them (e.g., universities and equipment manufacturers). Different types of entities have their distinct decision-making procedures that need to be recognized in a more refined analysis of agricultural innovations. The next subsection will analyze resource allocation for the development of new innovations in the public sector, and that will be followed by a discussion of specific institutions and incentives for innovation activities (patents and intellectual property rights) in the private sector. Induced innovations by agribusiness apply to innovations beyond the farm gate. In much of the post World War II period, there has been an excess supply of agricultural commodities in world markets. This has led to a period of low profitability in agriculture, requiring government support. While increasing food quantity has become less of a priority, increasing the value added to food products has become a major concern of agriculture and agribusiness in developed nations. Indeed, that has been the essence of many of the innovations related to agriculture in the last 30 years. Agribusiness took advantage of improvements in transportation and weather-controlled technologies that led to innovations in packing, storage, and shipping. These changes expanded the availability as well as the quality of meats, fruits, and vegetables; increased the share of processing and handling in the total food budget; and caused significant changes in the structure of both food marketing industries and agriculture. It is important to understand the institutional setup that enables these innovations to materialize. While there has not been research in this area, it seems that the availability of numerous sources of funding to finance new ventures (e.g., venture capital, stock markets, mortgage markets, credit lines from buyers) enables the entities that own the rights to new innovations to change the way major food items are produced, marketed, and consumed. 1.2. Political economy o f publicly f u n d e d innovations
Applied R&D efforts are supported by both the public and private sectors because of the innovations they are likely to spawn. Public R&D efforts are justified by the publicgood nature of these activities and the inability of private companies to capture all the benefits resulting from farm innovations. Studies have found consistently high rates of returns (above 20 percent) to public investment in agricultural research and extension, indicating underinvestment in these activities, see [Alston et al. (1995), Huffman (1998)]. Analysis of patterns of public spending for R&D in agriculture shows that federal monies tend to emphasize research
4 The Binswangermodel(1974) is verycloselylinked to the literature on quantifying sourcesof productivity in agriculture, For an overviewof this importantbodyof literature, whichbenefitedfromseminalcontributions by Griliches (1957, 1958) and Mundlak, see [Anfleand McGuckin (1993)].
219
Ch. 4: The Agricultural Innovation Process
PO P1 AO
/
A1 QO QI Figure 2.
on commodities that are grown in several states (e.g., wheat, corn, rice), while individual states provide much of the public support for innovation-inducing activities for crops that are specialties of the state (e.g., tomatoes and citrus in Florida, and fruits and vegetables in California). The process of devolution has also applied to public research and, over the years, the federal share in public research has declined relative to the state's share. Increased concern for environmental and resource management issues over time led to an increase in relative shares of public research resources allocated to these issues in agriculture [Huffman and Just (1994)]. Many of the studies evaluating returns to public research in agriculture (including Griliches' 1957 study on hybrid corn that spawned the literature) rely on partial equilibrium analysis, depicted in Figure 2. The model considers an agricultural industry facing a negatively sloped demand curve D. The initial supply is denoted byS0, and the initial price and quantity are P0 and Q0, respectively. Research, development, and extension activities led to adoption of an innovation that shifts supply to SI, resulting in price reduction to P1, and consumption gain Q1.5 The social gain from the innovation is equal to the area AoBoB1A1 in Figure 2 denoted by G. If the investment leading to the use of the innovation is denoted by I, the net social gain is N G = G - I, and the social rate of return to appropriate research development and extension activities is N G / I . The social gain from the innovation is divided between consumers and producers. In Figure 2, consumer gain is equal to the area PoBoBI P1. Producer gain is A o F A 1 B1
5 Of course, actual computation requires discounting and aggregation, and benefits over time, and may recognize the gradual shift in supplyassociatedwith the diffusionprocess.
D. Sunding and D. Zilberman
220
because of lower cost and higher sales, but they lose PoBoFP1 because of lower price. If demand is sufficiently inelastic, producers may actually lose from public research activities and the innovations that they spawn. Obviously, producers may not support research expenditures on innovations that may worsen their well-being, and distributional considerations affect public decisions that lead to technological evolution. 6 This point was emphasized in Schmitz and Seckler's (1970) study of the impact of the introduction of the tomato harvester in California. They showed that society as a whole gained from the tomato harvester, while farm workers lost from the introduction of this innovation. The controversy surrounding the tomato harvester [de Janvry et al. (1981)] led the University of California to de-emphasize research on mechanical innovations. De Gorter and Zilberman (1990) introduced a simple model for analyzing political economic considerations associated with determining public expenditures on developing new agricultural technologies. Their analysis considers a supply-enhancing innovation. They consider an industry producing Y units of output. The cost function of the industry is C(Y, I) and depends on output and investment in R&D where the level is I. This cost function is well behaved and an increase in I tends to reduce cost at a decreasing rate Oc/OI < 0, and O2c/OI 2 > 0 and marginal cost of output O2c/OIOI" < O. Let the cost of investment be denoted by r and the price of output by P. The industry is facing a negatively sloped demand curve, Y = D(P). The gross surplus from consumption is denoted by the benefit function B(Y) = f f P(z) dz, where P ( Y ) is inverse demand. Social optimum is determined at the levels of Y and I that maximize the net surplus. Thus, the social optimization problem is max B(Y)
C(Y,
-
I) -
Y,1
r I,
and the first-order optimality conditions are
3B OY
3C OY
-- 0 ~
P(Y)
--
OC OY'
(6)
and
OC OI
- - -
-
× =
0.
(7)
Condition (6) is the market-clearing rule in the output market, where price is equal to marginal cost. Condition (7) states the optimal investment in R&D at a level where
6 Further research is needed to understand to what extent farmers take into consideration the long-term distributional effects of research policy. They may be myopic and support a candidate who favors any research, especially when facing a pest or disease.
Ch. 4: The Agricultural Innovation Process
221
the marginal reduction in production cost because of investment in R&D is equal to the cost of investment. The function - O C/O I reflects a derived demand for supply-shifting investment and, by our assumptions, reducing the price of investment (~) will increase its equilibrium level. Condition (7) does not likely hold in reality. However, it provides a benchmark with which to assess outcomes under alternative political arrangements. De Gorter and Zilberman (1990) argued that the political economic system will determine both the level of investment in R&D and the share of the burden of financing it between consumers (taxpayers) and producers. Let Z be the share of public investment in R&D financed by producers. Thus, Z = 0 corresponds to the case where R&D is fully financed by taxpayers, and Z = 1 where R&D is fully financed by producers. The latter case occurs when producers use marketing orders to raise funds to collectively finance research activities. There are many cases in agriculture where producers compete in the output market but cooperate in technology development or in the political arena [Guttman (1978 )1. De Gorter and Zilberman (1990) compare outcomes under alternative arrangements, including the case where producers both determine and finance investment in R&D. In this case, I is the result of a constrained optimization problem, where producer surplus, P S = P ( Y ) Y - C(Y, I), minus investment cost, r I , is maximized subject to the market-clearing constraint in the output market P (Y) = OC/O Y. When there is internal solution, the first-order optimality condition for ! is OC ----
OI
-
r/ =
r,
(8)
where
rl=-Y-oyoc
1-\Oy2]l
~-
•
The optimal solution occurs at a level where the marginal cost saving due to investment minus the term 7, which reflects the loss of revenues because of price reduction, is equal to the marginal investment cost, r. The loss of revenues because of a price reduction due to the introduction of a supply-enhancing innovation increases as demand becomes less elastic. A comparison of (8) to (7) suggests that under-investment in agricultural R&D is likely to occur when producers control its level and finance it, and the magnitude of the under-investment increases as demand for the final product becomes less elastic. Below a certain level of demand elasticity, it will be optimal for producers not to invest in R&D at all. If taxpayers (consumers) pay for research but producers determine its level, the optimal investment will occur where the marginal reduction in cost due to the investment is equal to tl, the marginal loss in revenue due to price reduction. When the impact of innovation on price is low (demand for final product is highly elastic), producer control may lead to over-investment if producers do not pay for it. However, when tl > r, and expansion of supply leads to significant price reduction, even when
222
D. Sunding and D. Zilberman
taxpayers pay for public agricultural research, producer determination of its level will lead to under-investment. The public sector has played a major role in funding R&D activities that have led to new agricultural innovations, especially innovations that are disembodied or are embodied but non-shielded. Rausser and Zusman (1991) have argued that choices in political-economic systems are effectively modeled as the outcome of cooperative games among parties. Assume that two groups, consumers/taxpayers and producers, are affected by choices associated with investment in the supply-increasing innovation mentioned above. The political-economic system determines two parameters. The first is the investment in the innovation (I) and the second is the share of the innovation cost financed by consumers. Let this share be denoted as z; thus, the consumer will pay z c ( I ) for the innovation cost. It is assumed that the investment in the innovation is non-negative (I ~> 0), but z is unrestricted (z > 1 implies that the producers are actually subsidized). The net effects of the investment and finance of innovations on consumers/taxpayers' welfare and producers' welfare are A C S ( I ) -- z c ( 1 ) and A P S ( I ) - (1 -- z ) c ( 1 ) , respectively. The choice of the innovation investment and the sharing coefficients are approximated by the solution to the optimization problem m a x ( A C S ( I ) - z c ( I ) ) ~ ( A P S ( I ) -- (1 -- z ) c ( I ) ) l - u , 1,z
(9)
where ot is the consumer weight coefficient, 0 ~< o~ ~< 1. The optimization problem (9) (i) incorporates the objective of the two parties; (ii) leads to outcomes that will not make any of the parties worse off; (iii) reflects the relative power of the parties (when oe is close to one, consumers dominate decision-making but the producers have much of the power when u -+ 0); and (iv) reflects decreasing marginal valuation of welfare gained by most parties. 7 After some manipulations, the solutions to this optimization problem are presented by
ACS(I) 3~ Oil 1 --
Ogl
oaPS(1) +
oc
OI OI' ACS(1) - zc(1)
APS(I)
-- (1 -- Z)C(1)"
(10) (11)
Equation (10) states that innovation investment will be determined when the sum of the marginal increase in consumer and producer surplus is equal to the marginal cost of investment innovation. This rule is equivalent to equating the marginal cost of innovation investment with its marginal impact on market surplus (since A M S = A P S + A C S ) .
7 OPG/OI > 0, O2pG/Ol 2 < 0, OCS/Ol > 0, 02CS/OI 2 < O.
Ch. 4:
The Agricultural Innovation Process
223
Equation (11) states that the shares of two groups in the total welfare gain are equal to their political weight coefficients. Thus, if oq is equal to, say, 0.3 and consumers have 30 percent of the weight in determining the level and distribution of finance of innovation research, then they will receive 30 percent of the benefit. Producers will receive the other 70 percent. Equation (9) suggests that the political weight distribution does not affect the total level of investment in innovation research that is socially optimal, but only affects the distribution of benefits. If farmers have more political gain in determining the outcome because of their intense interest in agricultural policy issues, they will gain much of the benefit from innovation research. The cooperative game framework is designed to lead to outcomes where both parties benefit from the action they agree upon. Since both demand and supply elasticities for many agricultural commodities are relatively low, producer surplus is likely to decline with expanded innovation research. When these elasticities are sufficiently low, farmers as a group will directly lose from expanded innovation research unless compensated. Thus, in certain situations and for some range of products, positive innovation research is not feasible unless farmers are compensated. This analysis suggests a strong link between public support for innovation research and programs that support farm income. In such situations innovation research leads to a significant direct increase in consumer surplus through increased supplies and a reduction in commodity prices. It will also result in an increase in farmer subsidies by taxpayers. Thus, for a range of commodities with low elasticities of output supply and demand, consumers/taxpayers will finance public research and compensate farmers for their welfare losses. For commodities where demand is quite elastic, say about 2 or 3, and both consumers and producers ~,ain significantly from the fruits of innovation research, both groups will share in lanancing the research. When demand is very elastic and most of the gain goes to producers, the separate economic frameworks suggest that they are likely to pay for this research significantly, but if their political weight in the decision is quite important (a close to 1), they may benefit immensely from the fruits of the innovation research, but consumers may pay for a greater share of the research. While this political analysis framework is insightful in that it describes the link between public support for agricultural research and agricultural commodity programs, it may be off the mark in explaining the public investment in innovation research in agriculture, since there is a large array of studies that argues that the rate of return for agricultural research is very high, and thus there is under-investment. One obvious limitation of the model introduced above is that it assumes that the outcomes of research innovation are certain. However, there is significant evidence that returns for research projects are highly skewed. A small number of products may generate most of the benefits, and most projects may have no obvious outcome at all. This risk consideration has to be incorporated explicitly into the analysis determining the level of investment in innovation research. Thus, when consumers consider investment I in innovation research, they are aware that each investment level generates a distribution of outcome, and they will consider the expected consumer surplus gain associated with I. Similarly, producers are aware of the uncertainty involved with innovation research, and they will
D. Sunding and D. Zilberman
224
consider the expected producer surplus associated with each level in assessing the various levels of innovation research.
1.3. Policies and institutions for managing innovation activities The theory of induced innovations emphasizes the role of general economic conditions in shaping the direction of innovation activities. However, the inducement of innovations also requires specific policies and institutions that provide resources to would-be innovators and enable them to reap the benefits from their innovations. Patent protection is probably the most obvious incentive to innovation activities. Discoverers of a new patentable technology have the property right for its utilization for a well-defined period of time (17 years in the U.S.). An alternative tool may be a prize for the discoverer of a new technology, and Wright (1983) presents examples where prizes have been used by the government to induce creative solutions to difficult technological problems. A contract, which pays potential innovators for their efforts, is a third avenue in motivating innovative activities. Wright (1983) develops a model to evaluate and compare these three operations. Suppose that the benefits of an innovation are known and equal to B. The search for the innovation is done by n homogeneous units, and the probability of discovery is P (n), with
8P -->0,
02P -->0.
On
On 2
The cost of each unit is C. The social optimization problem to determine optimal research effort is max P(n)B IZ
-
nC,
and socially optimal u is determined when
OP --B ON
=C.
(12)
The expected marginal benefit of a research unit is equal to its cost. This rule may be used by government agents in determining the number of units to be financed by contracts. On the other hand, under prizes or patents, units will join in the search for the innovation as long as their expected net benefits from the innovation, P ( N ) B / N , are greater than the unit cost C. Thus, optimal N under patents is determined when
P(N) N
--B=C.
(13)
Assuming decreasing marginal probability of discovery, average probability of discovery for a research unit is greater than the marginal probability, P ( N ) / N > OP/ON.
Ch. 4: The Agricultural Innovation Process
225
Thus, a comparison of (12) with (13) suggests that there will be over-investment in experimentation under patents and prizes. In essence, under patents and prizes, research units are ex ante, sharing a common reward and, as in the classical "Tragedy of the Commons" problem, will lead to overcrowding. Thus, when the award for a discovery is known, contracts may lead to optimal resource allocation. Another factor that counters the oversupply of research efforts under patent relative to contracts is that the benefits of the innovation under patent may be smaller than under contract. Let Bp be the level of benefits considered for deriving dL~ L~ dL- = t / - ~ + (r - rl)R, the research effort under the patent system. Bp is equal to the profits of the monopolist patent owner. Let Bc be the level of benefits considered in determining tlc, the research effort under contract. If tlc is determined by a social welfare maximizing agent, Bc is the sum of consumers' and producers' surplus from the use of the innovation. In this case Bc > BN. Thus, in the case of full information about the benefits and costs, more research will be conducted under contracts if P(~) Bc Bp
~p oP
"
In many cases, the uncertainty regarding the benefits of an innovation at the discovery and patent stages is very substantial. Commercialization of a patent may require significant investment, and a large percentage of patents are not utilized commercially [Klette and Griliches (1997)]. Commercialization of an innovation requires upscaling and development, registration (in the case of chemical pesticides), marketing, and development of production capacity for products resulting from the patents. Large agribusiness firms have the resources and capacity to engage in commercialization, and they may purchase the right to utilize patents from universities or smaller research and development firms. Commercialization may require significant levels of research that may result in extra patents and trade secrets that strengthen the monopoly power of the commercializing firm. Much of the research in the private sector is dedicated to the commercialization and the refinement of innovations, while universities emphasize discovery and basic research. Thus, Alston, Norton, and Pardey (1995) argue that private-sector and public-sector research spending are not perfect substitutes. Actually, there may be some complementarity between the two. An increase in public sector research leads to patentable discoveries, and when private companies obtain the rights to the patents, they will invest in commercialization research. Private sector companies have recognized the unique capacity of universities to generate innovations, and this has resulted in support for university research in exchange for improved access to obtain rights to the innovations [Rausser (1999)].
D. Sunding and D. Zilberman
226
1.4. Factors beyond the farm gate
Over the years, product differentiation in agriculture has increased along with an increase in the importance of factors beyond the farm gate and within specialized agribusiness. This evolution is affecting the nature and analysis of agricultural research. Economists have recently addressed how the vertical market structure of agriculture conditions the benefits of agriculturalresearch, and also how farm-level innovation may contribute to changes in the downstream processing sector. One salient fact about the food-processing sector is that it tends to be concentrated. The problem of oligopsonistic competition in the food processing sector has been addressed by Just and Chern (1980), Wann and Sexton (1992), and Hamilton and Sunding (1997). Two recent papers by Hamilton and Sunding (1998) and Alston, Sexton, and Zhang (1997) point out that the existence of noncompetitive behavior downstream has important implications for the impacts of farm-level technological change. Consider a situation where the farm sector is competitive and sells its product to a monopsonistic processing sector. Let X denote the level of farm output, R be research expenditures, W be the price paid for the farm output, P be the price of the final good, and f be the processing production function. The monopsonist's problem is then max P f ( X ) - W ( X , R)X.
(14)
X
Since the farm sector is competitive, W is simply the marginal cost of producing the raw farm good. It is natural to assume that OW / O X > 0 since supply is positively related to price and 3W/OR < 0 since innovation reduces farm costs. Second derivatives of the marginal cost function are more ambiguous. Innovations that increase crop yields may tend to make the farm supply relation more elastic, and in this case, 32W/OXOR < O. However, industrialization may result in innovations that limit capacity or increase the share of fixed costs in the farm budget. In this case, O2W/OXOR > 0 and the farm supply relation becomes less elastic as a result of innovation. Totally differentiating the solution to (14), it follows that the change in farm output following an exogenous increase in research expenditures is dX dR
-(P ~
02W y
OXOR~" SOC
OW -6g)
The numerator is of indeterminate sign, while the denominator is the monopsonist's second-order condition, and thus negative. The first and third terms of the numerator are positive and negative, respectively, by the assumptions of positive marginal productivity in the processing sector, and the marginal cost-reducing nature of the innovation. This last effect is commonly termed the "shift" effect of innovation on the farm supply relation. There is also a "pivot" effect to consider, however, which is represented by the second term in the numerator. As pointed out earlier, this term can be either positive or negative depending on the form of the innovation. In fact, if public research makes the
Ch. 4: TheAgriculturalInnovationProcess
227
farm supply curve sufficiently inelastic, then a cost-reducing innovation can actually reduce the equilibrium level of farm output. Hamilton and Sunding (1998) make this point in the context of a more general model of oligopsony in the processing sector. They point out that an inelastic pivot increases the monopsonist's degree of market power and increases its ability to depress farm output. If the farm supply relation becomes sufficiently inelastic following innovation, this effect can override the output-enhancing effect of cost-reduction. Note further that the "pivot" effect only matters when there is imperfect competition downstream; the second term in the numerator disappears if the processing sector is competitive. Thus, in the case of perfect downstream competition, reduction of the marginal cost of farming is a sufficient condition for the level of farm output to increase. The total welfare change from farm research is also affected by downstream market power. In the simple model above, social welfare is given by the following expression:
SW = f Y(X(R)) P ( Z ) d Z - fooX(R) W(Z, R) dZ, do
(15)
where P(Z) is the inverse demand function for the final good. The impact of public research is then
dSW-(pOf-w)dX dR \ OX
~-
fooXOWdz. OR
This expression underscores the importance of downstream market structure. Under perfect competition, the wedge between the price of the final good and its marginal cost is zero, and so the first term disappears. In this case, the impact of farm research on social welfare is determined completely by its impact on the marginal cost of producing the farm good. 8 When the processing sector is imperfectly competitive, however, some interesting results emerge. Most importantly, if farm output declines following the costreducing innovation (which can only occur if the farm supply relation becomes more inelastic), then social welfare can actually decrease. This argument was developed in Hamilton and Sunding (1998), who describe the final outcome of farm-level innovation as resulting from two forces: the social welfare improving effect of farm cost reduction and the welfare effect of changes in market power in the processing industry. Hamilton and Sunding (1998) show that the common assumption of perfect competition may seriously bias estimates of the productivity of farm-sector research. Social returns are most likely to be overestimated when innovation reduces the elasticity of the farm supply curve, and when competition is assumed in place of actual imperfect competition. Further, Hamilton and Sunding demonstrate that all of the inverse supply functions commonly used in the literature preclude the possibility that 02 W/O XO R > O,
8 Thispointhas also beennotedrecentlyin Sunding(1996)in the contextof environmentalregulation.
228
D. Sunding and D. Zilberman
and thus rule out, a priori, the type of effects that result from convergent shifts. More flexible forms and more consideration of imperfect competition are needed to capture the full range of possible outcomes. The continued development of agribusiness is leading to both physical and intellectual innovation. Feed suppliers, in an effort to expand their market, contributed to the evolution of large-scale industrialized farming. This is especially true in the poultry sector. Until the 1950s, separate production of broilers and chickens for eggs was scarce. The price of chicken meat fluctuated heavily, and that limited producers' entry into the emerging broiler industry. Feed manufacturers provided broiler production contracts with fixed prices for chicken meat, which led to vertical integration and modem industrial methods of poultry production. These firms not only offer output contracts, but they also provide production contracts and contribute to the generation of production technology. Recently, this same phenomenon has occurred in the swine sector, where industrialization has reduced the cost of production. But agribusiness has spurred the development of another set of quality-enhancing innovations. Again, some of the most important developments have been in the poultry industry. Tyson Foods and other companies have produced a line of poultry products where meats are separated according to different categories, cleaned, and made ready to be cooked. The development of these products was based on the recognition of consumers' willingness to pay to save time in food preparation. In essence, the preparation of poultry products has shifted labor from the household to the factory where it can be performed more efficiently. In addition to enhancing the value of the final product, the poultry agribusiness giants introduced institutional technological innovations in poultry production [Goodhue (1997)]. Packing of poultry has shifted to rather large production units that have contractual agreements with processors/marketers. The individual production units receive genetic materials and production guidance from the processor/marketer, and their pay is according to the relative quality. This set of innovations in production and marketing has helped reduce the relative price of poultry and increase poultry consumption in the United States and other countries over the last 20 years. Similar institutional and production innovations have occurred in the production of swine, high-value vegetables, and, to some extent, beef. These innovations are major contributors to the process of industrialization of agriculture. While benefiting immensely from technology generated by university research, these changes are the result of private sector efforts and demonstrate the important contributions of practitioners in developing technologies and strategies.
2. Technologyadoption 2.1. Adoption and diffusion
There is often a significant interval between the time an innovation is developed and available in the market, and the time it is widely used by producers. Adoption and dif-
Ch. 4: The AgriculturalInnovation Process
229
fusion are the processes governing the utilization of innovations. Studies of adoption behavior emphasize factors that affect if and when a particular individual will begin using an innovation. Measures of adoption may indicate both the timing and extent of new technology utilization by individuals. Adoption behavior may be depicted by more than one variable. It may be depicted by a discrete choice, whether or not to utilize an innovation, or by a continuous variable that indicates to what extent a divisible innovation is used. For example, one measure of the adoption of a high-yield seed variety by a farmer is a discrete variable denoting if this variety is being used by a farmer at a certain time; another measure is what percent of the farmer's land is planted with this variety. Diffusion can be interpreted as aggregate adoption. Diffusion studies depict an innovation that penetrates its potential market. As with adoption, there may be several indicators of diffusion of a specific technology. For example, one measure of diffusion may be the percentage of the fanning population that adopts new innovations. Another is the land share in total land on which innovations can be utilized. These two indicators of diffusion may well convey a different picture. In developing countries, 25 percent of farmers may own or use a tractor on their land. Yet, on large farms, tractors will be used on about 90 percent of the land. While it is helpful to use the term "adoption" in depicting individual behavior towards a new innovation and "diffusion" in depicting aggregate behavior, in cases of divisible technology, some economists tend to distinguish between intra-firm and inter-firm diffusion. For example, this distinction is especially useful in multi-plant or multi-field operations. Intra-firm studies may investigate the percentage of a farmer's land where drip irrigation is used, while inter-firm studies of diffusion will look at the percentage of land devoted to cotton that is irrigated with drip systems.
2.1.1. The S-shaped diffusion curve Studies of adoption and diffusion behaviors were undertaken initially by rural sociologists. Rogers (1962) conducted studies on the diffusion of hybrid corn in Iowa and compared diffusion rates of different counties. He and other rural sociologists found that in most counties diffusion was an S-shaped function of time. Many of the studies of rural sociologists emphasized the importance of distance in adoption and diffusion behavior. They found that regions that were farther away from a focal point (e.g., major cities in the state) had a lower diffusion rate in most time periods. Thus, there was emphasis on diffusion as a geographic phenomenon. Statistical studies of diffusion have estimated equations of the form
Yt = K[1 + e-(a+bt)] -1,
(16)
where Yt is diffusion at time t (percentage of land for farmers adopting an innovation), K is the long-run upper limit of diffusion, a reflects diffusion at the start of the estimation period, and b is a measure of the pace of diffusion. With an S-shaped diffusion curve, it is useful to recognize that there is an initial period with a relatively low adoption rate but with a high rate of change in adoption.
230
D. Sunding and D. Zilberman
K Saturation~ Decline Takelf1
Figure3.
Time
Figure 3 shows this as a period of introduction of a technology. Following is a takeoff period when the innovation penetrates the potential market to a large extent during a short period of time. During the initial and takeoff periods, the marginal rate of diffusion actually increases, and the diffusion curve is a convex function of time. The takeoff period is followed by a period of saturation where diffusion rates are slow, marginal diffusion declines, and the diffusion reaches a peak. For most innovations, there will also be a period of decline where the innovation is replaced by a new one (Figure 3). Griliches' (1957) seminal study on adoption of hybrid corn in Iowa's different counties augmented the parameters in (16) with information on rates of profitability, size of farms in different counties, and other factors. The study found that all three parameters of diffusion function (K, a, and b) are largely affected by profitability and other economic variables. In particular, when Arc denotes the percent differential in probability between the modern and traditional technology, Griliches (1957) found that Oa/OArc, OK/OArc, and Ob/OATrare all positive. Griliches' work (1957, 1958) spawned a large body of empirical studies [Feder et al. (1985)]. They confirmed his basic finding that profitability gains positively affect the diffusion process. The use of S-shaped diffusion curves, especially after Griliches (1957) introduced his economic version, has become widespread in several areas. S-shaped diffusion curves have been used widely in marketing to depict diffusion patterns of many products, for example, consumer durables. Diffusion studies have been an important component of the literature on economic development and have been used to quantitatively analyze the processes through which modern practices penetrate markets and replace traditional ones.
Ch. 4: The Agricultural Innovation Process
231
2.1.2. Diffusion as a process of imitation
The empirical literature spawned by Griliches (1957, 1958) established stylized facts, and a parallel body of theoretical studies emerged with the goal of explaining its major findings. Formal models used to depict the dynamics of epidemics have been applied by Mansfield (1963) and others to derive the logistic diffusion formula. Mansfield viewed diffusion as a process of imitation wherein contacts with others led to the spread of technology. He considered the case of an industry with identical producers, and for this industry the equation of motion of diffusion is
Equation (17) states that the marginal diffusion at time t (OY/Ot, the actual adoption occurring at t) is proportional to the product of diffusion level Yt and the unutilized diffusion potential (1 - Y t / K ) at time t. The proportional coefficient b depends on profitability, firm size, etc. Marginal diffusion is very small at the early stages when Yt -+ 0 and as diffusion reaches its limit, Yt ~ K. It has an inflection point when it switches from an early time period of increasing marginal diffusion (02Yt/Ot 2 > 0) to a late time period of decreasing marginal diffusion (02y/ot 2 < 0). For an innovation that will be fully adopted in the long run (K = 1), - -
Ot
=
by,(1
-
r',),
the inflection point occurs when the innovation is adopted by 50 percent of producers. Empirical studies found that the inflection point occurs earlier than the simple dynamic model in (17) suggests. Lehvall and Wahlbin (1973) and others expanded the modeling of the technology diffusion processes by incorporating various factors of learning and by separating firms that are internal learners (innovators) from those that are external learners (imitators). This body of literature provides a very sound foundation for estimation of empirical time-series data on aggregate adoption levels. However, it does not rely on an explicit understanding of decision-making by individual firms. This criticism led to the emergence of an alternative model of adoption and diffusion, the threshold model. 2.1.3. The threshold model
Threshold models of technology diffusion assume that producers are heterogeneous and pursue maximizing or satisfying behavior. Suppose that the source of heterogeneity is farm size. Let L denote farm size and g(L) be the density of farm size. Thus, g ( L ) A L is the number of farms between L - A L / 2 and L + A L / 2 . The total number of farms is then N = f o g(L) dL, and the total acreage is L = f o Lg(L) dL.
232
D. Sunding and D. Zilberman
Suppose that the industry pursued a traditional technology that generated re0 units of profit per acre. The profit per acre of the modern technology at time t is denoted by Jr1 (t) and the profit differential per acre is Arct. It is assumed that an industry operates under full certainty, and adoption of modem technology requires a fixed cost that varies over time and at time t is equal to Ft. Under these assumptions, at time t there will be a cutoff farm size, Ltc = Ft lAter, upon which adoption occurs. One measure of diffusion at time t is thus Yt 1 __
fL~tC g(L) dL N
'
(18)
which is the share of farms adopting at time t. Another measure of diffusion of time t is oo
I12
fLcLg(L)dL --
_
,
(19)
L which is the share of total acres adopting the modem technology at time t. The diffusion process occurs as the fixed cost of the modern technology declines over time (Off, lOt < 0) or the variable cost differential between the two technologies increases over time (OAzrt/Ot > 0). The price of the fixed cost per farm may decrease over time because the new technology is embodied in new indivisible equipment or because it requires an up-front investment in learning. "Learning by doing" may reduce fixed costs through knowledge accumulation. The profit differential often will increase over time because of "learning by using". Namely, farmers will get more yield and save cost with more experience in the use of the new technology. The shape of the diffusion curve depends on the dynamics of farm size and the shape of farm size distribution. Differentiation of (18) obtains marginal diffusion under the first definition
oft 1
, ( L c)
Ot
N
c
at
(20)
Marginal diffusion at time t is equal to the percentage of farms adopting technology at this time. It is expressed as OLCt/ot times the density of the farm size distribution at
Lc, g(LC).
The dynamics of diffusion associated with the threshold model are illustrated in Figure 4. Farm size distribution is assumed to be unimodal. When the new innovation is introduced, only farms with a size greater than L0c will adopt. The critical size declines over time and this change triggers more adoption. The marginal adoption between the first and second year is equal to the area abLCL f. Figure 4 assumes that the marginal decline in LCis constant because of the density function's unimodality. Marginal diffusion increases during the initial period and then it declines, thus leading to an S-shaped diffusion curve. It is plausible that farm size distribution (and the distribution of other
Ch. 4." The AgriculturalInnovationProcess
233
g(L) I
L,
L
Figure 4.
sources of heterogeneity) will be unimodal and that combined with a continuous decline of LtCwill lead to S-shaped behavior. 9 The threshold model was introduced by Paul David (1969) to explain adoption of grain harvesting machinery in the United States in the nineteenth century. He argued that the main source of heterogeneity among farmers was farm size and he derived the m i n i m u m farm size required for adoption of various pieces of equipment. Olmstead and Rhode (1993) review historical documents that show that, in many cases, much smaller farms adopted some of the new machinery because farmers cooperated and jointly purchased harvesting equipment. This example demonstrates some of the limitations of the threshold model, especially when heterogeneity results from differences in size.
9 To have an S-shaped behavior, f2 yt1/ft Differentiation of (20) yields
02Y~
2 > 0 for an initial period with t < ? and f2 yt1/ft 2 < 0 for t > t'.
1 I Og(LC) t/OLC\2t~ +g{LC~" o2LClt|
Assuming unimodal distribution, let LC be associated with the model of g(L). As long as L C > L~Og(LC)/OLc < 0, then Lc < L~Og(LC)/aL c > 0. At the early periods, 02LCt/Ot2 may be small or even negative, but as t increases the marginal decfine in LC gets smaller and 02LC/ot 2 may be positive. Thus, the change of the sign of both elements of 02Y~~Or2 will contribute to S-shaped behavior.
234
D. Sunding and D. Zilberman
The threshold model also applies in other cases where heterogeneity results from differences in land quality or human capital. For example, Caswell and Zilberman (1986) argue that modem irrigation technologies augment land quality, and predicted that drip and sprinkler irrigation will be adopted on lands where water-holding capacity is below a certain threshold. They also showed that adoption of these technologies by growers who rely on groundwater will be dependent on well depth. Akerlof's (1976) work on the "rat race" suggests that differences in human capital establish thresholds and result in differences in the adoption of different technologies and practices. The threshold models shifted empirical emphasis from studies of diffusion to studies of the adoption behavior of individual farmers and a search for sources of heterogeneity. Two empirical approaches have been emphasized in the analysis of monthly cross-sectional data on technological choices and other choices of parameters and characteristics of individual firms. In the more popular approach, the dependent variables denote whether or not certain technologies are used by a farm product or unit at a certain period, and econometric techniques like logit or probit are used to explain discrete technology choices. The dependent variable for the second approach denotes the duration of technologies used by farms. (They answer the question, How many years ago did you adopt a specific technology?) Also, limited variable techniques are used to explain the technology data. Qualitatively, McWilliams and Zilberman (1996) found that the two approaches will provide similar answers, but analysis of duration data will enable a fuller depiction of the dynamics of diffusion.
2.1.4. Geographic considerations Much of the social science literature on innovation emphasizes the role of distance and geography in technology adoption [Rogers (1962)]. Producers in locations farther away from a regional center are likely to adopt technologies later. This pattern is consistent with the findings of threshold models because initial learning and the establishment of a new technology may entail significant travel and transport costs, and these costs increase with distance. Diamond's (1999) book on the evolution of human societies emphasizes the role of geography in the adoption of agricultural technologies. China and the Fertile Crescent have been source regions for some of the major crops and animals that have been domesticated by humans. Diamond argues that the use of domestic animals spread quickly throughout Asia and laid the foundation for the growth of the Euro-Asian civilizations that became dominant because most of these societies were at approximately the same geographic latitude, and there were many alternative routes that enabled movement of people across regions. The diffusion of crop and animal systems in Africa and the Americas was more problematic because population movement occurred along longitudinal routes (south to north) and thus, technologies required substantial adjustments to different climatic conditions in different latitudes. Diamond argues that there were other geographic barriers to the diffusion of agricultural technologies. For example, the slow evolution of agricultural societies in Australia and Papua New Guinea is explained by
Ch. 4:
The Agricultural Innovation Process
235
their distance from other societies, which prevented diffusion of practices from elsewhere. Geography sets two barriers to adoption: climatic variability and distance. Investment in infrastructure to reduce transportation costs (e.g., roads and telephone lines) is likely to accelerate adoption. One reason for the faster rate of technological adoption in the United States is the emergence of a national media and the drastic reduction in the cost of access that resulted from the establishment of railroads, the interstate highway system, and rural electrification. Distance is a major obstacle for adoption of technologies in developing countries. The impediment posed by distance is likely to decline with the spread of wireless communication technologies. It is a greater challenge to adopt technologies across different latitudes and varying ecological conditions. The establishment of international research centers that develop production and crop systems for specific conditions is one way to overcome this problem. 2.2. R i s k c o n s i d e r a t i o n s
The adoption of a new technology may expand the amount of risk associated with farming. Operators are uncertain about the properties and performance of a new technology, and these uncertainties interact with the random factors affecting agriculture. The number of risks associated with new technologies gives rise to several modeling approaches, each emphasizing aspects of the problem that are important for different types of innovations. In particular, some models will be appropriate for divisible technologies and others for lumpy ones, and some will explicitly emphasize dynamic aspects while others will be static in nature. Much of the agricultural adoption literature was developed to explain adoption patterns of high-yield seed varieties (HYV), many of which were introduced as part of the "green revolution". Empirical studies established that these technologies were not fully adopted by farmers in the sense that farmers allocated only part of their land to HYV while continuing to allocate land to traditional technologies. Roumasset (1976) and others argued that risk considerations were crucial in explaining these diversifications, while having higher expected yield also tended to increase risk. A useful approach to model choices associated with adoption of HYV is to use a static expected utility portfolio model to solve a discrete problem (whether or not to adopt the new technology at all); adoption can also be modeled as a continuous optimization problem in which optimal land shares devoted to new technologies and variable inputs are chosen, see [Just and Zilberman (1988), Feder and O'Mara (1981)]. To present these choices formally, consider a farmer with L- acres of land, which can be allocated among two technologies. Let i be a technology variable, where i = 0 indicates the traditional technology, and i = 1 the modem one. Let the indicator variable be 6 = 0 when the modem technology is adopted (even if not adopted on all the land), and 61 = 0 when the modern technology is not adopted. When 6 = 0, L0 denotes land allocated to traditional technology and L 1 denotes land allocated to the new variety. The
236
D. Sunding and D. Zilberman
fixed cost associated with adoption of the new technology is k dollars. Profits per acre under the traditional and modern technologies are ~r0 and 7q, respectively, and both are random variables. For convenience, assume that all the land is utilized when the traditional variety is used. Assume that the farmer is risk averse with a convex utility function U(W) where W is wealth after operation and W = W0 + H when W0 is the initial wealth level a n d / 7 is the farmer's profit. The optimal resource allocation problem of the farmer is
max EU[W0 + 3(7c0L0 + :triLl - k) + (1 - 3)7r0L] 8=0,1 LI ,L0
profits when modem ! technology is adopted J
subject to L0 + L 1 ~< T profits when adoption } does not occur
(21) Just and Zilberman (1988) considered the case where the profits under both technologies are normally distributed, the expected value of profit per acre under technology i is mi, the variance of profit per acre of technology i is a/2, and the correlation of the per acre profits of the technologies is p. They demonstrated that when the modern technology is adopted (6 = 1) on part of the land, but all of the land is utilized, the optimal land allocation to the modern technology (L~) is approximated by the function L~ (L). Formally,
qSr (ATr) + RL,
(22)
where E(ATr) = ml - m0 is the difference in expected profits per acre between the modern and traditional technology, v(ATr) = v(Tq -- Jr0) = or02+ Crl2 -- 2pal(r0 is the variance of the difference of profit per acre of the two technologies. Further, R =
ao(ao - pal) 1 Or(Arc) ao v( AJr) -- -2 Oao v ( a ~ )
is a measure of the responsiveness of v(Arc) to changes in ~0, and ~b is the Arrow-Pratt measure of absolute risk aversion, dependent upon expected wealth. Numerous adoption studies have addressed the case where the modern technology increased mean yield per acre, E(Arr) > 0, and had high variance as compared to the traditional technology, cr2 > ~ . These assumptions will be used here. First, consider the case where profits under the traditional technology are not risky, (c~02= 0). From condition A, L~ = E(Ajr)/g)a~, adoption does not depend directly on farm size (only indirectly, through the impact of I on risk aversion), and adoption is likely to increase as the expected gain from adoption E(Arr) increases and the risk of the modern technologies (a~) decreases.
Ch, 4:
The Agricultural Innovation Process
237
When cr~ > 0 and q5 is constant, Equation (22) suggests that L~ is a linear function of farm size L-. The slope of L~ is equal to R, and assuming a 2 > a 2, R = ao(ao - pal) v(Azr) is smaller than one. When the profits of two technologies are highly correlated, p > cro/al, R < O, d L ~ / d L < 0, and acreage of the modern technology declines with farm size. This occurs because the marginal increase with acreage (variance of profits) is larger than the marginal increase of expected profits that slow the growth or even reduce (when p > ao/a) the acreage of the modern and more risky technology of larger farms. Assume now that absolute risk aversion is a function of farm size (a proxy of expected wealth) denoted by 4~(L). In this case, Just and Zilberman showed that the marginal effect of increase on the area of the modern technology is dL~ Lrl dL -- t / ~ - + (r - r/)R, where 77= -4~ I L/4~ is the elasticity of absolute risk aversion and is assumed to be between 0 (/7 = 0 implies constant absolute risk aversion) and 1 07 = 1 implies constant relative risk aversion coefficient, ~b(L) • L = constant). In this more general case, L'i may be a nonlinear function of L and may have a negative slope in cases of high correlation and small t/. Optimal land allocation to the modern technology, L~, is constrained to be between 0 and L. Thus, it may be different than L 1 defined in (22). In cases with small 77 (4~ does not change much with L), the increase in risk (variance of profits) with size is much greater than the increase in expected profit with size. When L is close to zero, L~ > and thus where farm size is below a critical level, L-b,l° the modern technology should be fully adopted if it is optimal. From (22) the adoption of the modern technology is optimal if it pays for the extra investment it entails. Thus, farms below another critical size, La, cannot pay for the modern technology and do not adopt it. Figure 5 depicts some plausible relations between L~ and L. The segment Oabcd depicts the behavior of L~ when R > 0 and Lb > La. If Lb > La and R < 0, L~ is depicted by Oabce. If L-a > Lb, and R > 0, L~ is depicted by Ogh and if La > Lb and R < 0, L~ is depicted by Ogle. In the last two cases, there is no full adoption of the modern technology. Feder, Just, and Zilberman (1985) report the results of several studies that show that when adoption occurs, the full share of modern technologies declines with farm size among adopters. These findings are consistent with all the scenarios in Figure 5. - -
r
2.3. Mechanisms to address product performance and "fit risk" Adopters of new technologies, especially if embodied in high capital costs that entail significant irreversible investment, face uncertainty with respect to the performance of 10 A t L =
Lb, L~ (L)b = -Lb.
238
D. Sunding and D. Zilberman g~
1
~
e
d
m
0
La
g
L
Figure 5.
the product, its reliability, and appropriateness of their operation. When a farmer buys a piece of machinery - be it a combine, harvester, seeder, or cultivator- and it has a breakdown or major malfunction, it may cost a farmer much of his revenues. Conceptually, one may think about several solutions to address some risk, including insurance. The prevailing approach to address such risk is to form a product-backup system. To address the financial risks that are associated with the repair cost of a broken or malfunctioning product, especially in the early life of the product, manufacturers introduced mechanisms such as warranties and established dealerships equipped to repair breakdowns. Thus, the combination of a warranty agreement and a well-functioning technical support system significantly reduces the amount of reliability risk associated with new products. Significant elements of agribusinesses, such as mechanic shops, are devoted to the repair and maintenance of new capital equipment. The availability and quality of performance of this support will determine the risk farmers face in adoption decisions and, thus, their ability to carry risk. One of the main advantages of large farming operations is their in-house capacity to handle repairs, breakdowns, and maintenance of equipment. That makes them less dependent on local dealers and repair shops, and reduces their risk of having to purchase (in many cases) new products. The value of the capacity to address problems of product equipment failure swiftly and efficiently is intensified by timing considerations. In many regions, harvesting seasons are short. Leaving a wheat crop unharvested for an extra day or two may expose it to damage due to rain, hail, or pests, thereby decreasing its yield. Market prices of perishable fruits and vegetables are significantly dependent on the timing of harvest;
Ch. 4:
The Agricultural Innovation Process
239
a one-week delay in harvesting early season fruits or vegetables for shipping can reduce prices by factors of 30 to 40 percent [Parker and Zilberman (1993)]. This timing consideration increases the value of a well-functioning product system. It may provide an explanation for the maintenance of excess capacity to harvest or conduct other vital activities. Of course, the extent to which farmers maintain excess capacity depends on how well the product support system functions. The agricultural community may establish customs and other social and institutional arrangements for mutual help in a crisis situation associated with a breakdown of equipment. Adoption of new technology entails risk with respect to its appropriateness to the farm and its performance. Results of prior testing by manufacturers represent performance and conditions that may not be exactly similar to those of farmers. New technologies may also require special skills and training. Institutional arrangements to reduce the risk associated with the adoption of new technologies have been introduced. They include product information and demonstration such as educational materials in various media formats as well as hands-on demonstrations. The farmer may go to a dealership to see farm machinery in operation or the equipment may be loaned to the farmer for a supervised and/or unsupervised trial period. For new seed varieties, manufacturers will send farmers samples of seeds for examination. Many farmers will plant small trial plots. When university researchers are the providers of new seeds, extension plays a major role in demonstration. In the case of new seed varieties and equipment developed by the private sector, extension plays an important role in demonstrating efficacy in local conditions as well as making objective judgments on manufacturers' claims regarding new products. In addition to various types of extension, the reduction of risk associated with performance and the appropriateness of new technologies is addressed by arrangements such as money-back guarantees. With money-back guarantees, the farmer is given the option to return the product. In this case, obviously the price of the product includes some payment for this option [Heiman et al. (1998)]. However, the money-back guarantee agreement allows farmers longer periods of experimentation with new products. Generally money-back guarantees are not complete and a fraction of the original cost is not returned. Sometimes renting is used as a mechanism to reduce the risk associated with investment in new products. For example, when sprinkler irrigation was introduced in California, the main distributor of sprinklers in the state was a company called Rain for Rent. This company rented sprinkler equipment to farmers. Over time, the practice of renting sprinkler equipment became much less common and more new sprinkler equipment was purchased. In some cases, farmers use custom services for an initial trial with new technologies, and invest in the equipment only when they feel more secure and certain about its properties. Many of the marketing strategies, including warranties, money-back guarantees, and demonstrations that are part of businesses throughout the economy, were introduced by agricultural firms including John Deere and International Harvesting. Currently, hundreds of millions of dollars are spent on promotion and education in the use of new
240
D. Sunding and D. Zilberman
products. Unfortunately, not much research has been conducted to understand this aspect of agricultural and technological change in agriculture. It seems, however, that a large body of empirical evidence regarding geographic concentration of new technologies and geographic patterns of technology adoption may be linked to considerations of marketing and product support efforts. New technologies are more likely to be adopted earlier near market centers where dealers and product supports are easily available. Agricultural industries and certain types of technologies may be clustered in certain regions, especially in the earlier life of a new technology, and these regions will generally be located in areas that have technical support and expertise associated with the maintenance and development of the technologies. It seems that considerations of marketing and geographic locations are two areas where more research should be done.
2.4. Dynamic considerations The outcome of technology adoption is affected by dynamic processes that result in changes in prices of capital goods and input, learning by producers and users of capital goods, etc. Some of these processes have random components and significant uncertainty over time. Some of these dynamic considerations have been introduced to recent microlevel models of adoption behavior.
2.4.1. Optimal timing of technology adoption The earlier discussion on threshold models recognized that timing of adoption may vary across production units reflecting differences in size, human capital, land quality, etc. The above analysis suggests that, at each moment, decision-makers select technologies with the best-expected net benefits (or expected net present values adjusted by risk). Thus, when a new technology is available decision-makers continuously evaluate whether or not to adopt; when the discounted expected benefits of adoption are greater than the cost, the technology will be adopted. This approach may lead to suboptimal outcomes because decision-makers do not consider the possibility of delaying the technology choice to take advantage of favorable dynamic processes or to enable further learning. These deficiencies have been corrected in recent models.
2.4.2. Learning by using, learning by doing, and adoption of new technologies Consider a farmer who operates with a traditional technology and is considering adopting a new one that requires a fixed investment. The increase in temporal profit from adoption at time t increases as more experience is gained from the use of this technology. This gain in experience represents learning by doing. Let to be the time of adoption and assume that self-experience is the only source of learning by doing. The increase in operational profits in t > 0 is Azr(t -- to), Ozr/Ot > 0. Let the fixed cost of investment in firm to be denoted by K(to). The process of learning by using reduces the manufac-
241
Ch. 4: The Agricultural Innovation Process
turing cost of fixed assets and results in reduction in K (to) over time. It is reasonable to assume that the effects of both learning processes decline over time. Thus, 02rc(t -- to) OK(to) 02K(to) >0. - < 0 , - - < 0 , - Ot O(to) Ot 2
When the farmer disregards the learning processes in determining the time of adoption, adoption will occur when the temporal gain of adoption equals the extra periodical fixed cost. Let r denote discount rate and assume the economic life of the new technology is infinite. At to, A)r(O) = r K (to).
When the learning processes are taken into account, the marginal reduction in investment cost, because of learning by using, tends to delay adoption, and the marginal benefits from learning by using may accelerate the time of adoption. The optimal conditions that determine to in this more general case are
(+)
(-)
AFI(O) -- r g ( t o )
(-) ÷
(+)
OK(to) i c e e -rt Orc(t) O t ~ ÷ Jo Ot dt = 0 .
Extra profit Investment Learningby from adoption cost doing effect
Learning by using effect
In cases where the new technology increases the productivity of an agricultural crop with constant returns to scale, A H (t -- to) = Arc(t -- to)" L,
where L is acreage. In this case, both the extra profit from adoption and the learningby-using effects will increase with farm size and lead larger farms to be early adopters. Higher interest rates will tend to retard adoption because they will increase the investment cost per period and reduce the learning-by-using effect. 2.4.3. Adoption under irreversibility and uncertainty
Adoption sometimes entails irreversible investments with uncertain payoffs. Delay of an adoption decision may enable the producer to obtain more information, reducing overall uncertainty, and increasing expected discounted benefits by avoiding irreversible investment when it is not worthwhile. This observation can be illustrated by the following example that analyzes adoption decisions in a simple, two-period model. The adoption decision requires an initial investment of $100. The returns from adoption consist of $50 at the initial period, $30 with probability of .5 (low returns case),
D. Sunding and D. Zilberman
242
and $150 with probability of .5 (high returns case) in the second period. Let r be the discount rate. According to the neoclassical investment theory, adoption should occur at the initial period of the expected net benefit of this decision, and (ENPVo) is positive when
ENPVo = 50 ÷ ~ + r [0.5 • 30 ÷ 0.5 • 150] - 100 -- 1 90 ÷ r
50.
The standard expected net present value criteria will suggest adoption in the initial period when the discount rate is smaller than 0.8 (since ENPVo > 0 when 90/(1 + r) > 50 for r < 0.8). However, the farmer's set of choices includes an option to wait until the second period and adopt only in the case of high returns. The investment associated with adoption is irreversible, and waiting to observe the returns in the second period enables avoiding investment in the case of low returns. The expected net present value with this approach is
ENPV1 = 0.5 +
( 1 5 0 - 100) 25 ~l+r l+r
> 0.
When r = 0.5, ENPVo = 90/1.5 - 50 = 10, ENPV~ = 25/1.5 = 162/3, then the "wait and see" approach is optimal. This approach removes the downside risk of the lowreturn case in the second period. The value added by waiting and retaining flexibility in light of new information is called "option value" and in this example is defined below as follows:
OV = max[NPV1 - NPVo, 0] = max 50 -
l÷r'
0 .
In the case of r = 0.5, the option value is 6-2/3 and waiting to see the outcome of the second period is optimal. In the case with r < 0.3, the option value is 0 and adoption in the initial period is optimal. This example is a simple illustration of a more complex, multi-period model of adoption. Suppose a farmer employs two technologies, traditional and modern. The temporal profit from each of the technologies depends on a random variable, St. This may be the price of output or input, or it may be the value of a physical variable (climatic condition) that affects profitability. The modern technology usually generates more profits but requires a fixed investment. Let the difference in temporal profit between the two technologies in period t be AI-I(SD = 171 ( S t ) - I - I o ( S t ) . Assume that the temporal gain from adoption increases with St(OA17/OS: > 0). Let the cost of the investment in the new technology be denoted by K, and the discount rate be denoted by r. The farmer has
Ch. 4:
The Agricultural Innovation Process
243
to determine when to adopt the modern technology. Let T be the period of adoption. The farmer's optimization problem is
max T
F Azr(St) I ~Es, L(l-~ry j
i=T
K (i +r)r,
I T = 0 , 1 ..... oo1
where Es, (-) denotes expectation with respect to St. The nature of the solution depends on the assumption regarding the evolution of the sequence of random variables St. For example, suppose St = St-1 + et where all the et's are independently and identically distributed random variables whose means are zero. (If they are normally distributed, St is generated by a "random walk" process.) This approach has been very successful in the analysis of options in finance, and Dixit and Pindyck (1994) and McDonald and Siegel (1986) applied it to the analysis of capital investments. They viewed investments with unrestricted timing as "real options" since the decision about when to undertake an investment is equivalent to the decision about when to exercise an option. McDonald and Siegel (1986) considered a continuous time model to determine the time of investment. They assumed that the S evolves according to a Wiener process (which is a differential continuous version of the process described above) and used the Ito calculus to obtain formulas to determine the threshold for adoption, S. Their analysis suggests that the threshold level of S increases as the variance of the temporal random variable ef increases. Their framework was applied by Hasset and Metcalf (1992) to assess adoption of energy conservation in the residential sectors. Thurow, Boggess, and Moss (1997) applied the real option approach to assess how uncertainty and irreversibility considerations will affect adoption of free-stall dairy housing, a technology that increases productivity and reduces pollution. The source of uncertainty in their case is future environmental regulation. Using simulation techniques, they showed that when investment is optimal under the real option approach, expected annual returns are more than twice the expected annual returns associated with adoption under the traditional net present value approach. Thus, the real value approach may lead to a significant delay in adoption of the free-stall housing and occurs when pollution regulations are very stiff. Olmstead (1998) applied the real value approach to assess adoption of modern irrigation technology when water prices and availability are uncertain. Her simulation suggests that the water price leading to adoption under the real option approach is 133 percent higher than the price that triggers adoption under the standard expected net present value approach. In her simulation, the average delay in adoption associated with the real option approach is longer than 12 years. There have been significant studies of adoption of irrigation technologies and, while adoption levels seemed to respond significantly to economic incentives, adoption did not occur in many of the circumstances when it was deemed to be optimal using the expected present value criteria. Much of the adoption occurs during drought periods when
244
D. Sunding and D. Zilberman
water prices escalate drastically [Zilberman et al. (1994)]. The option value approach provides a good explanation of the prevalence of adoption during crisis situations. The analysis of adoption behavior using "real options" models holds much promise and is likely to be expanded. In many cases, not all the adoption investment is "sunk cost". Some of it can be recovered. For example, capital goods may be resold, and added human capital may increase earning opportunities. The delay caused by adoption costs and uncertainties will likely be shorter if these costs are more recoverable, and institutions that reduce irreversibilities (rental of capital equipment, money-back guarantee agreements) are apt to increase and accelerate adoption. The real option approach provides new insight and is very elegant, but it does not capture important aspects of the dynamics of adoption. It assumes that decision-makers know the distribution of random events that determine profitability when it is more likely that a learning process is going on throughout the adoption process, and adopters adjust their probability estimates as they go along. Furthermore, while adoption requires a fixed initial investment, it also may entail incremental investments, especially when the intensity of use of a new technology changes over time. Thus, a more complete dynamic framework for analyzing adoption should address issues of timing, learning, and sequential investment. Some scholars [Chavas (1993)] have introduced models that incorporate these features, but this research direction requires more conceptual and empirical work. 2.4.4. The Cochrane treadmill
A key issue in the economics of innovation and adoption is to understand the impact of technology change on prices and, in particular, the well-being of the farm population over time. When a supply-increasing innovation is adopted to a significant degree, it will lead to reduction in output prices, especially in agricultural commodities with low elasticity of demand. When it comes to adoption of a new technology, Cochrane (1979) divided the farming population into three subgroups - early adopters, followers, and laggards. The early adopters may be a small fraction of the population, in which case the impact of their adoption decision on aggregate supply and, thus, output prices is relatively small. Therefore, these individuals stand to profit from the innovation. The followers are the large share of the farm sector who tend to adopt during the take-off stage of the innovation. Their adoption choice will eventually tend to reduce prices, which reduces profits as well. This group of adopters may gain or lose as a result of innovation. Finally, the laggards (the third group) are the farmers who either adopt at the lag stage of the adoption process or do not adopt at all. These individuals may lose from technological change. If they do not adopt, they produce the same quantity as before, at low prices; and if they adopt, the significant price effect may sweep the gain associated with higher yields. Thus, Cochrane argues that farmers, on the whole, are not likely to gain from the introduction of innovation in agriculture, except for a small group of early adopters. Introduction of new technology may lead to structural change and
Ch. 4:
The Agricultural Innovation Process
245
worsen the lot of some of the small farms. The real gainers from technological change and innovation in agriculture are likely to be consumers, who pay less for their food bill. Kislev and Schori-Bachrach (1973) developed conceptual and empirical models based on Cochrane's analysis using data from Israel. They show that small subgroups of farmers are the early innovators who adopt the new technologies. When there is a wave of new technologies, these individuals, who have a higher education and other indicators of human capital, will consistently be able to take advantage of technology change and profit. The rest of the farming population does not do as well from technological change. The Cochrane results are modified in situations where agricultural commodities face perfectly elastic demand, for example, when adopting industry export goods from a small country. In this case, the impact of increased profitability associated with the introduction of a new technology will lead to an increase in land rents which may occur some time after the innovation was introduced. Thus, the early adopters, even if they are farm operators, may be able to make an above-normal profit as a result of their adoption decision, but most of the followers will not gain much from the adoption decision because their higher revenues will be reduced by an increase in rent. Laggards and nonadopters may lose because the higher rent may reduce their profits. Again, landowners will be gainers from the innovations, and not farmers who own no land. Thus, this extension of Cochrane's model reaches the same conclusion-that at least some farmers do not benefit from technological change as much as other agents in the population. Cochrane's modeling framework was used to argue that, in spite of the high technological change that occurs in agriculture and its dynamic nature, farmers may not be better off and actually some of them may be worse off from innovations. That may justify the "farm problem" that occurred in much of the twentieth century where the wellbeing of farmers became worse relative to other sectors of the population. Cochrane's basic framework was not introduced formally. Zilberman (1985) introduced the dynamics of the threshold model of adoption that identified conditions under which the quasirents of farmers decline over time. His model did not take into account the changes in structure that may be associated with innovation agriculture. When innovations are embodied in technology packages that are both yield-increasing (high-yield varieties) and labor-saving (tractors and other machinery), and agricultural demand is inelastic, then technological change will reduce quasi rent per acre and make operations in the farm sector less appealing to a large segment of the population. Thus the early adopters are likely to accumulate more of the land, increasing their farm size. Over time, structural change will result in a relatively small farm sector, and earnings per farm may actually increase as farms become much bigger. Gardner's (1988) findings show that, in relative terms, the farm population is now as well off or even better off than the nonfarm population, especially in the United States. His findings are consistent with the process of technological change that led to the accumulation of resources by small subgroups of the farm population while the rest migrated to the urban sector where earnings were better. But in addition to the gains from technological change, the adopters may also
246
D. Sunding and D. Zilberman
have benefited from a commodity program that slowed the decline in prices as well as the processes of globalization that makes demand more elastic over time. A more formal and complete understanding of the distribution and price implications of technological change over time is a challenge for further research on the economics of technology adoption. Stoneman and Ireland (1983) argue that firms producing the components of new technology recognize the dynamics of adoption; they design their production and establish technology component prices accordingly, taking advantage of the monopolistic power. Thus there is a clear linkage between the economics of innovation and adoption that should be investigated further. An understanding of these links is essential for the design of better patent policy and public research strategies. 2.5. Institutional constraints to innovation
While agricultural industries tend to be competitive, the perfectly competitive model does not necessarily apply since farmers may face a significant number of institutional constraints and policies which affect their behavior significantly and result in outcomes that are different from those predicted by the perfectly competitive model. This institutional constraint may be especially important in the area of technological change and adoption. Some of the most important constraints relate to credit as well as tenure relationships, as addressed below. Note that institutional constraints may affect the patterns of adoption of new technologies, but on the other hand, the introduction of new technologies may affect the institutional structure and operation of agricultural industries. We will concentrate on the first problem but will address both. 2.5.1. Credit
Asymmetric information between lenders and borrowers and the uncertain conditions in agriculture and financial markets have led to imperfections in the credit market, most notably credit constraints that affect adoption behavior [Hoff et al. (1993)]. In many cases, farmers use some of their own equity to finance at least part of their investments. In other cases, assets such as land or the crop itself are used as collateral for financing a new technology. The exact formulation of the credit constraint faced by farmers is quite tricky, but it is not unreasonable to approximate as a linear function of acreage. The reason is that, in many cases, land is the major asset of a farming operation. Just and Zilberman (1983) introduced a credit constraint in their static model of adoption under uncertainty. They assume that investment in the new technology is equal to k + c~L1 when ~ is investment per acre in the modern technology. The constraint on credit per acre is m dollars. Thus, the farm credit constraint is m L >>,k ÷ ~ L I . If m < c~l, there will be full adoption. However, if m > o~, the credit constraint will not bind for larger farms. Figure 6 depicts some plausible outcomes for the second case. Consider a case where R > 0 and La < Lb. Without the credit constraints, optimal allocation of land to the modern technology, as a function of farm size, is depicted by Oabcd in Figure 6. There may be several scenarios under the credit constraints.
Ch. 4."
The Agricultural Innovation Process k
L~
247 m-
L~ = - - + - - L
S
-k o~
Figure 6.
In terms of Figure 6, when credit is a binding constraint, L1 < - ~ q- m c~~ • Small farms (with sizes in the range Oa) will be non-adopters. Somewhat larger farms, in the range bh, will be credit-constrained partial adopters. Even larger farms (in the range hc) will specialize in the new technology, and farms of the largest size (corresponding to cd) will be risk diversifiers when m is smaller. Policies to remove credit constraints will be beneficial, especially to smaller farmers, and will enable some to adopt and others to extend their intensity of adoption. The credit constraints per acre may be affected by the lender's perception of the profitability of agriculture (and farmland prices that reflect the profitability). Initial subsidization of credit early in the diffusion process that will enhance adoption will provide evidence that may change (improve in the case of a valuable technology) the lender's perception of the profitability of the industry and the modem technology, and lead to a relaxation of credit constraints. It will thus facilitate further adoption. The interest rate and other financial charges may be differentiated according to size. Banks may perceive smaller farms to be more risky, so they may need to compensate for the fixed cost of loan processing, etc. II If the price of credit is higher for smaller 11 There is significant evidence in the development literature that smaller operators face a higher interest cost.
248
D. Sunding and D. Zilberman
farms, that extra hurdle will reduce the minimal farm size that is required for new technology adoption and will slow adoption by smaller-sized farms. Thus, advantageous credit conditions may be another reason larger farms adopt new technologies earlier. The reduction of institutions such as the Grameen Bank in Bangladesh and organizations such as the Bank of America in the United States, which in the beginning of the century facilitated loans to smaller operations, may be a crucial element in accelerating the process of technological change in improving adoption. The financial crisis of the 1980s has led to a realization of the significance of risk associated with emphasizing collateral considerations in loan generation. The value of assets such as land is highly correlated to the profitability of agriculture and, in periods of crises and bankruptcies, land will be less valuable as collateral. That will lead to an increased emphasis on "ability to pay" as a criterion for loan generation. Thus, farmers need to provide sufficient guarantees about the profitability of their investment and their future ability to repay a loan. This may put investment in new technologies at a disadvantage because many of them do not have a sufficient track record that will assure banks of their economic viability. Banks may lack the personnel that are able to correctly assess new technologies and their economic value [Agricultural Issues Center (1994)]. One approach to overcoming this obstacle is by credit subsidies for a new technology, which may be appropriate in situations when investments generate positive externalities. However, an alternative and more prevalent solution is the provision of finance or a loan guarantee by the input manufacturer that leads to a reduction of the financial constraints on farmers. Furthermore, it reduces the fixed cost of adoption since it reduces the cost of searching for a loan. (One of the major implications of restricted availability of credit is the higher cost of finance, even for people who eventually obtain the credit.) Indeed, some of the major automobile and heavy equipment companies have their own subsidiaries or contractual arrangements that provide financing for new purchases of equipment, and seed companies often play an important role in the provision of credit. In many cases farmers may obtain loans for credit provisions through cooperatives or government policies (see chapter on credit). 2.5.2. Tenure
There is a distinct separation between ownership and the operation of agricultural land throughout the world. About 50 percent of the farmland in the United States is operated by individuals who do not own the land, and the financial arrangements between owners and operators vary. In the development literature, there is a significant emphasis on the importance of tenure systems on technology adoption. Most of the literature takes tenure as given and assesses its impact on adoption of technologies. However, this impact depends on the arrangements as well as the nature of the technology. Furthermore, as we will argue later, the introduction of new technologies may result in new tenure relationships.
Ch. 4: The Agricultural Innovation Process
249
The simplest relationships are land rent contracts where operators pay a fixed rent to landowners. Several factors will determine how these contracts affect adoption behavior. In the case of short-term contracts, when operators are not secure in maintaining the same land for a long time, the likelihood that they will adopt a technology that requires investment in the physical infrastructure and improvement of the land is very low. In these cases, rental relationships may be a significant deterrent for the adoption of innovations. On the other hand, the fixed-rate rent will not be a major deterrent of adoption if the innovation does not require a significant modification of the physical infrastructure, or if it augments or is dependent upon the human or physical capital of the operator. For example, an operator may purchase a tractor to reduce the cost of his operation. The necessary condition for adoption in this case is that the operator rent a sufficient amount of land every year in order to recapture and repay the investment. Actually, in some cases, the existence of a well-functioning land rental market may accelerate adoption of technologies that require a significant scale of operation. In fact, some farmers may augment the land utilized by them by renting land from others, thus enabling them to adopt large equipment. This was the situation, for example, in California when the cotton harvester was introduced. Therefore, it is useful to distinguish between large operators who use rental agreements to increase the acreage under their control (the rental agreements may facilitate adoption) and small operators without land of their own. For these operators, due to the credit constraints, lack of land may be a deterrent for adoption, even for technologies that do not improve the land and related assets. 2.5.3. Complementary inputs and infrastructure
The introduction of new technologies may increase demand for complementary inputs and when the supply of these inputs is restricted, adoption will be constrained. Highyield "green revolution" varieties require increased water and fertilizer use. McGuirk and Mundlak's (1991) analysis of the adoption of high-yield varieties in the Punjab showed that adoption was constrained by the availability of water and fertilizer. Private investment in the drilling of wells, and private and public investment in the establishment of fertilizer production and supply facilities removed these constraints and contributed to the diffusion of modern wheat and rice varieties in the Punjab. The adoption of high-yield maize varieties in the Punjab was much lower than wheat and rice, mostly because of disease problems. Adoption rates in maize might have been higher if complementary disease-control technologies were available. Some of the complementary input constraints are eased or eliminated with the appropriate infrastructure. Effective research and extension programs may devise solutions to pest problems thus enabling the adoption of vulnerable varieties. Some of the modeling and analysis of diffusion [Mahajan and Peterson (1985)] suggests that the diffusion rates in regions that are farther from commercial centers are lower. To some extent this reflects barriers for professional support and more limited and costly access to complementary inputs. Improvement in transportation infrastructure may thus be useful for enhancing adoption.
250
D. Sunding and D. Zilberman
2.6. Adoption and farm policy Agriculture in developing and developed countries has been subject to government interventions that, in turn, affect technological change. Generally speaking, agricultural policies in developed countries aim to raise and stabilize agricultural incomes and, in some cases, to curtail supplies, while agricultural outputs have been taxed in developing nations. In both cases agricultural inputs have tended to be subsidized. In recent years, agriculture has been subject to new environmental policies that control and affect the use of certain inputs that may cause pollution. The following is a discussion of the impacts of different policies on technological change.
2.6.1. Price supports Just, Rausser, and Zilberman (1986) and Just et al. (1988) developed a framework, relying on the model presented in Equation (21), to analyze the impact of agricultural policies on technology adoption for farmers operating under uncertainty. They analyze various policies by tracing their impacts on price distributions of inputs and outputs as well as constraints (i.e., credit) on adoption. Price supports increase the mean of prices received by farmers and reduce their variability by setting lower price bounds. When the new technology has a yield-increasing effect (for example, high-yield variety), and if it is also perceived to have higher risk, price-support policies tend to increase its relative profitability, which leads to an increase in both the extent and intensity of adoption. McGuirk and Mundlak (1991) argue that the introduction of guaranteed markets for Punjabi food grain production by the government procurement policy (which was in essence a price support policy) enhanced the adoption of high-yield wheat and rice varieties in this region. The mechanism through which price supports impact the adoption behavior of farms of different sizes varies. Smaller farms may increase their adoption because of price supports (their impact on credit) and the reduction in the minimum size required to justify adoption. Larger farms that may be risk diversifiers will increase the share of modern technologies on their land because of the mean effect and the reduction in risk. Price supports may also enhance adoption of mechanical innovations when they increase the relative profitability of operations with a new technology and thus reduce the size threshold required for adoption. Price supports may enhance adoption also through their impact on credit. When the ability to obtain credit depends on expected incomes, price supports will increase adoption when credit is constrained.
2.6.2. Combined output price supports and land diversion policies In the United States as well as in some European countries, the subsidization of prices has been accompanied by a conditional reduction in acreage. The higher and most secure prices on at least part of the land provide incentives for farmers to adopt yieldincreasing varieties. On these lands, they raise the value of property and expected in-
Ch. 4:
The Agricultural Innovation Process
251
come, which increases their capacity to obtain credit that may enhance the adoption of all types of technologies. Specific elements of the support program vary over time. In recent years, the base for support has not been the actual yield, but the average base yield that is dependent on the average past performance of either the farmer or the region. The acreage that provides the base for entitlement to the benefits of a diversion program also depends on past performance. According to the specifics of a program, farmers might expand their yield or acreage in order to expand their entitlements in the future. Thus, adoption of highyielding technologies, or technologies that may be especially beneficial with marginal land, is more likely to occur with price supports/diversion policies. 12 The historical record that provides a base for future program entitlements may, on the other hand, provide disincentives to adopt new crops or to introduce nonprogram crops to certain areas and thus reduce the flexibility of farming. The 1996 Farm Act in the United States makes entitlements that are independent of most farming activities, including choice of crop. However, even under this bill, land that is entitled to income support is somewhat restricted in its choice of crops, and that may retard the adoption and introduction of new crops to some of the major field crop regions of the United States. Cochrane (1979) argued that the commodity programs in the United States played a major role in the adoption of mechanical and chemical innovations by reducing risk and increasing profitability per acre. The commodity programs as well as the increases in demand and prices during and after World War II led to modernization and structural change in U.S. agriculture. De Gorter and Fisher (1993) used a dynamic model to show that the combination of price supports and land diversion led to intensification of farming in the United States. Lichtenberg's (1989) work demonstrates the importance of economic incentives for the adoption of center-pivot irrigation in Nebraska and other Midwestern states, and suggests that expansion of the irrigated land base in these states benefited from the support programs of the 1970s and 1980s. 2.6.3. Output taxation
Taxation of agricultural outputs, prevalent especially in developing countries, has a disastrous effect on technological change. It reduces the incentive to adopt yield-increasing technologies, increases the scale of operation that justifies financing purchases of new equipment, and depresses the price of agricultural land, thus reducing the ability to borrow. Furthermore, with lower prices, there are incentives to apply intensively modern inputs, which are associated in many cases with the adoption of modern, high-yield varieties in developing countries. The low growth of Argentinian agriculture between 1940 and 1973 is a result of output taxation and other policies that reduced relative prices of agricultural products and slowed investments and technological change in this sector [Cavallo and Mundlak (1982)]. 12 The workof Zilberman(1984) provides a rigorous argumenton the impactof programssuch as deficiency payments and diversionpolicies on the expansion of acreage and supply.
252
D. Sunding and D. Zilberman
2.6.4. Trade liberalization and macroeconomic policies The adoption of innovations is likely to be significantly influenced by policies that affect the general economy. This may include trade and exchange rate policies as well as macroeconomic and credit policies. Macroeconomic policies that lead to high interest rates may reduce adoption because investment in new technologies is more costly. Adoption of mechanical innovations may suffer more significantly with high interest rates, while farmers may switch to technologies that are labor-intensive. Changes in international trade regimes will affect various regions differently according to their relative advantage. The opening of markets in the United States led to the introduction of high-value varieties in different communities in Central America [Carletto et al. (1996)]. This change in cropping was combined with the establishment of a new infrastructure and the construction of packinghouses and transportation facilities. Thus, when a change in trade rules seems permanent, it may lead to a complete overhaul of the infrastructure, and that may enable adoption of new crops and modernization. Favorable pricing because of trade barriers enables growers in Europe, Japan, and some parts of the United States to adopt yield-increasing varieties, to invest and develop greenhouse technologies, and to expand the capacity of different technologies, including irrigated agriculture, in situations that would not have warranted it under free trade. The growth and investment in the agricultural sector in both Argentina and Chile suffered during periods when international trade was constrained, and benefited from trade liberalization [Coeymans and Mundlak (1993), Cavallo and Mundlak (1982)].
2.6.5. Environmental policies A wide array of environmental regulations affects technologies available for agriculture. Pesticide bans provide a strong incentive for the development of alternatives at the manufacturer level and for the adoption of alternative strategies including nonchemical treatment, biological control, etc. On the other hand, the lack of availability of chemicals may retard adoption of high-yield varieties or new crops that are susceptible to a particular pest, especially in cases where nonchemical alternatives are not very effective. The elimination of DBCP (with its unique capacity to treat soil-borne diseases) in the mid-1980s in California led, on the one hand, to the abandonment of some grape acreage and a switch to other crops. At the same time, it enhanced the adoption of drip irrigation that enabled applications of alternatives in other areas.
2.6.6. Input subsidies There is a wide body of literature [Caswell (1991)] that shows that subsidized water pricing tends to retard the adoption of modern irrigation technologies. However, subsidized input led to the adoption of high-yield varieties and "green revolution" technologies in countries like India. They also increased profitability and thus have an indirect positive impact on adoption through credit effects. Similarly, subsidization of pesticides
Ch. 4: The Agricultural Innovation Process
253
and fertilizers led to the adoption of high-yield varieties and chemical-intensive technologies in developing and developed countries alike, which is also likely to result in problems of environmental pollution since the environmental side effects of agriculture are often the result of excessive residues. Alternatively, elimination of subsidies and especially taxation of chemical inputs may lead to adoption of more precise application technologies that will reduce residues and actually may increase yield [Khanna and Zilberman (1997)]. 2.6. 7. Conditional entitlements o f environmental programs
Governments have recognized that they can use entitlements to support programs conditional on certain patterns of behavior. Therefore, in recent years there have been attempts to link entitlements to income supports, policies, and other subsidization to certain patterns of environmental behavior. A program like the Environmental Quality Incentives Program (EQIP) in the United States attempts to induce farmers to adopt practices such as low-tillage and soil testing, and to reduce the application of chemicals in exchange for entitlements for some support. In some cases, the benefits of such a program are shortlived and farmers may quit using modern practices once the program benefits disappear. On the other hand, especially when it comes to new, untested technologies, elements of learning-by-doing and experience may improve the profitability of those technologies that have some environmental benefits so that farmers recognize their economic advantages. Thus, the adoption of such technologies may persist in the long run.
3. Future directions
Research on agricultural technology evolves from the technology and the institutions associated with it. At present, agriculture is undergoing a technological revolution as evidenced by the introduction of biotechnology and precision technology. We are also witnessing related processes of industrialization, product differentiation, and increased vertical integration in agriculture [Zilberman et al. (1997)]. These changes raise new issues and introduce new challenges. Several significant changes have been observed thus far from the emergence of biotechnology [Zilberman et al. (1998)]. With many past technologies, university research identified some of the basic concepts while most of the innovations were done in industries. However, with biotechnology, universities are the source of numerous new discoveries, and technology transfer from universities to industries has triggered the creation of leading products and companies. The unwillingness of private firms to develop university innovations without exclusive rights motivated the establishment of offices of technology transfer that identified buyers who would share the rights to develop university innovations. Each arrangement provides new sources of funding to universities since royalties are divided among universities, researchers, and departments. Thus far, income from technology transfer revenues has paid less than 5 percent of university research budgets. However,
254
D. Sunding and D. Zilberman
in some areas (biology and medicine) it made a difference. Most of the royalties were associated with fewer than 10 innovations [Parker et al. (1998)], reinforcing our existing knowledge that benefits to research tend to concentrate on a small number of critical innovations. Established companies were not willing to buy the rights to develop some of the most radical, yet important, university innovations and biotechnology. Thus, ofrices of technology transfer, working with venture capitalists, helped to establish new upstart companies, some of which became leading biotechnology firms (e.g., Genentech, Chit'on and Amgen). As these companies grew and became successful, some of the major multinationals bought a majority of shares in these companies. Thus, most of the activities in biotechnology have been in medical biotechnology. However, 1996 was the breakthrough year for agricultural biotechnology as millions of acres were planted with pest-resistant varieties of cotton and soybeans. In agricultural biotechnology, we see again the importance of small startups from the collaborations between university researchers and venture capitalists. Most of the startups in agricultural biotechnology have been acquired by giants like Monsanto and DuPont. The evolution of biotechnology suggests that the university is becoming a major player in industrial development, and it affects the structure and competitiveness of industries. University researchers working with venture capitalists generate new avenues of product development. Sometimes they may force some of the giant companies to change their product development strategy, and may even give up some of their monopolistic power. Other forms of contractual relationships between university researchers and industries are being established. For example, industries support certain lines of research for an exclusive option to purchase the rights for technology. Furthermore, some researchers suddenly find themselves wearing another hat, that of a partner in a technology company, and that may affect the way universities run their patterns of payments and support for researchers. Given these new realities, there is a need for both empirical and conceptual research on innovations and the relationships between public and private research. We need to better understand the existing arrangements of royalties, sharing of royalties within the university, the relationship between publications and patents, and the effect of university research and industrial structure, etc. With computers, biotechnology, and other new technologies, most of the value is now embodied in specific knowledge. The Cohen-Boyer patent once generated the largest revenues to universities. In this case, companies paid for the right to use a process for genetic manipulation. The key to biotechnology is the process of innovation (which specifies how to conduct specific manipulation) and product innovation (which specifies what type of outcomes can be controlled by which genes). New genetic engineering products will be produced by combining certain procedures and items of knowledge that are protected by certain patent rights. In principle, the developers of new products should pay the royalties to whoever owns the patents. Thus the markets for rights to different types of knowledge will emerge. A new research agenda is suggested to address the economics of intellectual property rights. In particular, it should address pricing rules for different types of intellectual property rights and the design of biotechnology products given the price structures
Ch. 4:
The Agricultural Innovation Process
255
for different processes and product innovations. An important area of understanding is the pricing of international property rights within complex international systems where protection of intellectual property rights is not always feasible and where there are significant disparities in income. The research in intellectual property rights will also have implications on the issues of biodiversity and compensation for developing countries for genetic materials that are embodied in their natural resources. Other related issues include the incentives for and integration of research to develop basic foods; the alleviation of starvation in the poorest countries; how new emerging industrial orders in agriculture and biotechnology can provide appropriate technologies to these countries; defining the role of international research institutes and other public entities (e.g., the United Nations and global organizations) in conducting research aimed at the poorest countries; and what type of payment arrangement should exist between research units focused on developing countries and commercial firms in the more developed nations. Materials and chemicals that were previously produced by chemical procedures may be produced through modified biological organisms. First, biotechnology in agriculture will produce alternative forms of pest control and pest-resistant varieties but, over time, it will produce higher quality food products and new products such as pharmaceuticals and fine chemicals, see [Zilberman et al. (1997)]. With biotechnology the value added of seeds will increase to include some of the rent that was accrued to chemicals. Pesticide manufacturers ~ilready have become major players in biotechnology and are taking over seed companies in order to obtain a channel to market their products. Often the owners of the rights to patents try to capture some of the rent through contracting; thus, biotechnology will provide both the incentives to enhance contractual arrangements and vertical integration in agriculture. Some of the recent mergers and acquisitions in agricultural biotechnology can be explained by attempts to obtain rights to intellectual property and access to markets [Rausser et al. (1999)]. Finally, biotechnology causes firms with agricultural characteristics (for example, dairies, livestock operations, and even field crop operations) to produce products in areas that are not traditionally agricultural (pharmaceutical, oils, coloring). As the borderline between agriculture and industry becomes fuzzier, new models replace the competitive models as the major paradigm to assess agriculture. The new product lines and the new types of industrial organization that may occur with biotechnology will raise environmental concerns and management issues. Biotechnology, thus far, has had a good track record, but it could have a negative potential. The design of the regulatory framework will significantly affect the structure of biotechnology industries and their impact. A more restrictive registration process, for example, may lead to a more concentrated biotechnology. Thus, it will become a research and policy challenge to modify the registration process and to balance the risks and benefits associated with biotechnology through monitoring over time. The optimal design of intellectual property rights agreements in biotechnology will become another issue of major concern. Patent rights that are too broad will lead to concentration in industries. It may stymie competition but may encourage a small number of firms to invest heav-
256
D. Sunding and D. Zilberman
ily in new products. Biotechnology patent protections that are too narrow may prevent significant investment in a costly research line. Over the last 30 or 40 years, precision technologies have evolved that adjust input use to variation over space and time and reduce residues. The use of precision technologies is still in its infancy. The development of computer and satellite technology suggests a new, vast potential, but it has had limited use thus far. However, new products are continuously being introduced, and some types of precision technologies will play a major role in the future of agriculture. One challenge in improving precision technology will be to develop the software and management tools that will take advantage of new information. That will present a significant challenge to researchers in farm management. Other issues involve the development of institutions that take advantage of network externalities associated with knowledge and that accumulate and distribute information that is pertinent to farm management. The pricing of knowledge will also become a major issue of research within the context of precision farming. Another important issue associated with precision farming is the potential for improving environmental quality. The adoption of precision farming may be induced by environmental regulation. The link between environmental regulation, research, development, and the adoption of new products needs to become clearer and provide insight to improve institutions and incentives. Most of the research on technology and innovation thus far has been done within regional bounds, but one of the main challenges of the future is to analyze issues of research and development within an international context. We need to better understand issues of technology transfer and intellectual property rights within nations. In some cases we need to better understand the mechanisms of collaboration between nations to address either global problems or to take advantage of increases in returns to scale. International food research centers and some existing binational research and development arrangements have become very prominent. 13 These types of arrangements may become more important in the future and should be further investigated. Furthermore, the relationship between the private and the public sectors in research and development should be viewed in a global context. A multinational corporation may change the research activities and infrastructure between nations in response to changes in economic conditions, and the activities of such private organizations depend both on national and international public sector policies. International aspects of research and development are especially important in light of trade agreements such as GATT and NAFTA, and there is very little knowledge on how international trade agreements affect research and development. However, this type of knowledge is crucial because R&D is becoming a key element in the evolution of agricultural industries. An important issue to address, of course, is the development of research infrastructure on global problems, for example, private global climate change. Thus far, this research has been conducted by individual nations without much coordination of finance, finding, and direction. As we recognize our interdependence and 13 For evaluation of the Binational Agricultural Research Development (BARD) fund between Israel and the United States, see [Just et al. (1988)].
Ch. 4:
The Agricultural Innovation Process
257
the importance of issues such as global management of natural resources, fisheries, and biodiversity, we need to determine what type of mechanism we should use to enhance efficiency and research in knowledge development on a global basis. In addition to an abundance of new research topics on innovations that should be addressed in the future, there are new research techniques and paradigms that seem very promising for the future. The new evolution in finance examines investments within the context of dynamics, and uncertainty should be further incorporated to assess the economics and management of research. Research activities should be evaluated as part of the management portfolio and financial activities of firms and concerns. The use of financial tools will provide new avenues for pricing research products and international property rights. However, tools, while very useful, have limits of their own. We need to better understand what kinds of processes, in terms of technology and economic and physical forces, give rise to the stochastic processes that are used in financial management. We need to better understand the dynamics of uncertain events and how they affect markets. Research agendas that link general equilibrium modeling with financial tools are an important challenge to economics in general but will be very important in the area of agricultural research and development. Much of the research has emphasized technical innovations but it may be just as important to understand institutional innovations. What are the reasons for the emergence of institutions such as futures markets, farmer cooperatives, product quality warranties, etc.? To what extent are these institutions induced by economic conditions? How do human capital and political structures affect the emergence of institutions? Zilberman and Heiman (1997) suggest that economic research contributed to the emergence of institutional innovations (e.g., Keynesian macroeconomic policies, emission, etc.). But this topic needs to be studied in-depth which will enable better assessment of investments in social science research. Research on the emergence of institutions will benefit if we have a better understanding of how institutions actually work and the main features that characterize them. Innovative activities are critically dependent on human capacity to make decisions and learn. The assumption of full rationality that characterizes many economic models is unrealistic. It will be useful to borrow the modeling approach from psychology and other behavioral sciences, and develop models of learning, adoption, and other choices that recognize bounded rationality. Thus far, there is much successful research in other areas, in particular, on uncertainty, and such direction will be very important in the study of innovation and technology. Technological innovation and institutional change have a profound effect on the evolution of the agricultural sector. The agricultural economic literature on innovation clearly documents that innovations do not occur randomly, but rather that incentives and government policies affect the nature and the rate of innovation and adoption. Both the generation of new technologies and their adoption are affected by intentional public policies (e.g., funding of research and extension activities), unintended policies (e.g., manipulation of commodity prices), and activities of the private sector. One of the challenges of designing technology policies in agriculture is to obtain an optimal mix of
258
D. Sunding and D. Zilberman
public and private efforts. Design of these policies will require improved understanding of the economics of complex processes of innovation, learning, and adoption in a myriad of institutional and technological settings. Economists have made many notable advances through their research on innovation and adoption, but there remains much to be discovered.
References Agricultural Issues Center (1994), "Financing agriculture in California's new risk environment", in: S.C. Blank, ed., S. Weber, technical ed., Proceedings of a Conference on December 1, 1993 in Sacramento, California (Agricultural Issues Center, University of California, Davis, CA). Akertof, G. (1976), "The economics of caste and of the rate race and other woeful tales", Quarterly Journal of Economics 90:591-617. Alston, J.M., G.W. Norton and P.G. Pardey (1995), Science under Scarcity: Principles and Practice for Agricultural Research Evaluation and Priority Setting (Cornell University Press, Ithaca, NY). Alston, J., R. Sexton and M. Zhang (1997), "The effects of imperfect competition on the size and distribution of research benefits", American Journal of Agricultural Economics 79(4): 1252-1265. Antle, J.M., and T. McGuckin (1993), "Technological innovation, agricultural productivity, and environmental quality", in: G.A. Carlson, D. Zilberman and J.A. Miranowski, eds., Agricultural and Environmental Resource Economics (Oxford University Press, New York). Ball, V.E., J.-C. Bureau, R. Nehring and A. Somwam (1997), "Agricultural productivity revisited", American Journal of Agricultural Economics 79(4): 1045-1063. Berck, E, and J.M. Perloff (1985), "The commons as a natural barrier to entry: Why there are so few fish farms", American Journal of Agricukural Economics 67(2):360-363. Binswanger, H.P. (1974), "A microeconomic approach to induced innovation", Economic Journal 84(336):940-958. Binswanger, H.P., and J. McIntire (1987), "Behavioral and material determinants of production relations in land abundant tropical agriculture", Journal of Economic Development and Cultural Change 36( 1):73-100. Bosernp, E. (1965), Conditions of Agricultural Growth (Aldine Publishing Company, Chicago). Brown, L.R., G. Gardner and B. Halweil (1999), "Beyond Malthus. Nineteen dimensions of the population challenge", in: L. Starke, ed., The Worldwatch Environmental Alert Series (W.W. Norton & Company, New
York). Carletto, C., A. de Janvry and E. Sadoulet (1996), "Knowledge, toxicity, and external shocks: The determinants of adoption and abandonment of non-traditional export crops by smallholders in Guatemala", Working paper 791 (Department of Agricultural and Resource Economics, University of California, Berkeley). Caswetl, M. (1991), "Irrigation technology adoption decisions: Empirical evidence", in: A. Dinar and D. Zilberman, eds., The Economics and Management Water and Drainage in Agriculture (Khiwer Academic Publishers, Boston). Caswell, M.E, and D. Zilberman (1986), "The effects of well depth and land quality on the choice of irrigation technology", American Journal of Agricultural Economics 68(4):798-811. Cavallo, D., and Y. Mundlak (1982), "Agriculture and economic growth in an open economy: The case of Argentina", Research Report 36 (International Food Policy Research Institute, Washington, DC). Chavas, J.-P. (1993), "On sustainability and the economics of survival", American Journal of Agricultural Economics 75(1):72-83. Cochrane, W.W. (1979), The Development of American Agriculture: A Historical Analysis (University of Minnesota Press, Minneapolis). Coeymans, J.E., and Y. Mundlak (1993), "Sectoral growth in Chile: 1962-82", Research Report 95 (International Food Policy Research Institute, Washington, DC).
Ch. 4:
The Agricultural Innovation Process
259
David, EA. (1969), "A contribution to the theory of diffusion", Memorandum no. 71 (Stanford Center for Research in Economic Growth). de Gorter, H., and E.O. Fisher (1993), "The dynamic effects of agricultural subsidies in the United States", Journal of Agricultural and Resource Economics 18(2):147-159. de Gorter, H., and D. Zilbennan (1990), "On the political economy of public good inputs in agriculture", American Journal of Agricultural Economics 72(1):131-137. de Janvry, A., E Leveen and D. Runsten (1981), "The political economy of technological change: Mechanization of tomato harvesting in California", Working paper 177 (Department of Agricultural and Resource Economics, University of California, Berkeley). Diamond, J. (1999), Guns, Germs and Steel (W.W. Norton and Company, New York). Dixit, A., and R. Pindyck (1994), Investment Under Uncertainty (Princeton University Press, Princeton). Evenson, R., and Y. Kislev (1976), "A stochastic model of applied research", Journal of Political Economics 84(2):265-281. Feder, G., R.E. Just and D. Zilberman (1985), "Adoption of agricultural innovations in developing countries: A survey", Economic Development and Cultural Change 33(2):255-298. Feder, G., and G.T. O'Mara (1981), "Farm size and the adoption of green revolution technology", Economic Development and Cukural Change 30:59-76. Gardner, B. (1988), The Economics of Agricultural Policies (Macmillan Publishing Company, New York). Goodhue, R. (1997), Agricultural complementarities and coordination: Modeling value differentiation and production contracting, Ph.D. Dissertation (Department of Agricultural and Resource Economics, University of California, Berkeley). Griliches, Z. (1957), "Hybrid corn: An exploration in the economics of technological change", Econometrica 25(4):501-522. Griliches, Z. (1958), "Research costs and social returns: Hybrid corn and related innovations", Journal of Political Economy 66(5):419-431. Guttman, J.M. (1978), "Interest groups and the demand for agricultural research", Journal of Political Economy 85(3):467-484. Hamilton, S.E, and D.L. Sunding (1997), "The effect of farm supply shifts on concentration and market power in the food processing sector", American Journal of Agricultural Economics 79:524-531. Hamilton, S.E, and D.L. Sunding (1998), "Returns to public investments in agriculture with imperfect downstream competition", American Journal of Agricultural Economics 80(4):830-838. Hasset, K.A., and G.E. Metcalf (1992), Energy Tax Credits and Residential Conservation Investment (NBER, Cambridge). Hayami, Y., and V.W. Ruttan (1985), Agricultural Development: An International Perspective (Johns Hopkins University Press, Baltimore). Heiman, A., J. Zhao and D. Zilberman (1998), "Modeling money-back guarantees as financial options", Mimeograph (Department of Agricultural and Resource Economics, University of California, Berkeley). Hoff, K., A. Braverman and J. Stiglitz (1993), The Economics of Rural Organization: Theory, Practice and Policy (Oxford University Press, New York, NY). Huffman, W.E. (1998), "Finance, organization and impacts of U.S. agricultural research: Future prospects", Paper prepared for conference "Knowledge Generation and Transfer: Implications for Agriculture in the 21st Century", University of California, Berkeley, June 18-19, 1998. Huffman, W.E., and R.E. Just (1994), "Funding, structure, and management of public agricultural research in the United States", American Journal of Agricultural Economics 76(4):744-759. Just, R., and W. Chern (1980), "Tomatoes, technology, and oligopsony", Bell Journal of Economics 11:584602. Just, R.E., G.C. Rausser and D. Zilberman (1986), "Modelling the effects of policy on farmers in developing agriculture", International Journal of Development Planning Literature 1(3):287-300. Just, R.E., and D. Zilberman (1983), "Stochastic structure, farm size, and technology adoption in developing agriculture", Oxford Economic Papers 35(2):307-328.
260
D. Sunding and D. Zilberman
Just, R.E., and D. Zilberman (1988), "The effects of agricultural development policies on income distribution and technological change in agriculture", Journal of Development Economics 28:193-216. Just, R.E., D. Zilberman, D. Parker and M. Phillips (1988), "The economic impacts of BARD research on the U.S.", Report prepared for the Commission to Evaluate BARD, June, 1988. Khanna, M., and D. Zilberman (1997), "Incentives, precision technology and environmental quality", Ecological Economics 23(1):25-43. Kislev, Y., and N. Schori-Bachrach (1973), "The process of an innovation cycle", American Journal of Agricultural Economics 55(1):28-37. Klette, T.J., and Z. Griliches (1997), "Empirical patterns of firm growth and R&D investment: A quality ladder model interpretation", Working paper 5945 (National Bureau of Economic Research, Cambridge, MA). Lehvall, R, and C. Wahlbin (1973), "A study of some assumptions underlying innovation diffusion functions", Swedish Journal of Economics 75:362-377. Lichtenberg, E. (1989), "Land quality, irrigation development, and cropping patterns in the northern High Plains", American Journal of Agricultural Economics 71 (1): 187-194. Mahajan, V., and R.A. Peterson (1985), Models for Innovation Diffusion (Sage Publications, Beverly Hills, CA). Mansfield, E. (1963), "The speed of response of firms to new techniques", Quarterly Journal of Economics 77:290-311. McDonald, R., and D. Siegel (1986), "The value of waiting to invest", Quarterly Journal of Economics 101:707-728. McGuirk, A., and Y. Mundlak (1991 ), "Incentives and constraints in the transformation of Punjab agriculture", Research Report 87 (International Food Policy Research Institute, Washington, DC). McWilliams, B., and D. Zilberman (1996), "Time of technology adoption and learning by doing", Economics of Innovation and New Technology 4:139-154. Mundlak, Y. (1997), "Agricultural production functions: A critical survey", Working paper (The Center for Agricultural Economic Research, Rehovot, Israel). Norgaard, R.B. (1988), '"the biological control of cassava mealybng in Africa", American Journal of Agricultural Economics 70(2):366-371. Olmstead, A.L., and E Rhode (1993), "Induced innovation in American agriculture: A reconsideration", Journal of Political Economy 101(1): 100-118. Olmstead, J. (1998), Emerging markets in water: Investments in institutional and technological change, Ph.D. Dissertation (Department of Agricultural and Resource Economics, University of California, Berkeley). Parker, D., and D. Zilberman (1993), "Hedonic estimation of quality factors affecting the farm-retail margin", American Journal of Agricultural Economics 75(2):458-466. Parker, D., D. Zilberman and E Castillo (1998), "Office of technology transfer: Privatizing university innovations for agriculture", Choices: 19-25. Rausser, G. (1999), "Private/public research: Knowledge assets and future scenarios, Invited fellows address", Annual meeting of the American Agricultural Economics Association, Nashville, TN, August 10, 1999. Ransser, G., S. Scotchmer and L. Simon (1999), "Intellectual property and market structure in agriculture", Work in progress (Department of Agricultural and Resource Economics, University of California, Berkeley). Rausser, G., and E Zusman (1991), Political-Economic Analysis: Explanation and Prescription (Cambridge University Press, New York). Rogers, E. (1962), Diffusion of Innovations (Free Press of Glencoe, New York). Roumasset, J.A. (1976), Rice and Risk: Decision-Making among Low-Income Farmers (North-Holland, Amsterdam). Schmitz, A., and D. Seckler (1970), "Mechanized agriculture and social welfare: The case of the tomato harvester", American Journal of Agricultural Economics 52(4):569-577. Schultz, T.W. (1964), Transforming Traditional Agriculture (Yale University Press, New Haven, CT).
Ch. 4:
The Agricultural Innovation Process
261
Stoneman, R, and N. Ireland (1983), "Technological diffusion, expectations and welfare", Oxford Economic Papers 38:283-304. Sunding, D. (1996), "Measuring the marginal cost of nonuniform environmental regulations", American Journal of Agricultural Economics 78:1098-1107. Thurow, A.P., W.G. Boggess and C.B. Moss (1997), "An ex ante approach to modding investment in new technology", in: D. Parker and Y. Tsur, eds., Decentralization and Coordination of Water Resource Management (Kluwer Academic Pubfishers). United States Bureau of the Census (1975, September), Historical Statistics of the United States. Colonial Times to 1970, Parts l&2 (United States Department of Commerce, Washington, DC). United States Bureau of the Census (1980, October), Statistical Abstract of the United States 1980, 101st Edition (United States Department of Commerce, Washington, DC). United States Bureau of the Census (1998, October)), Statistical Abstract of the United States 1998, 118th Edition (United States Department of Commerce, Washington, DC). Wann, J., and R. Sexton (1992), "Imperfect competition in multiproduct food industries with application to pear processing", American Journal of Agricultural Economics 74(4):989-990. Wright, B.D. (1983), "The economics of invention incentives: Patents, prizes, and research contracts", The American Economic Review 73(4):691-707. Zilberman, D. (1984), "Technological change, government policies, and exhaustible resources in agriculture", American Journal of Agricultural Economics 66(5):63d~640. Zilberman, D. (1985), "Technological change, government policies and exhaustible resources in agriculture", American Journal of Agricultural Economics 66(5):634-640. Zilberman, D., and A. Heiman (1997), "The value of economic research", American Journal of Agricultural Economics 79(5):1539-1544. Zilberman, D., D. Sunding, R. Howitt, A. Dinar and N. MacDougall (1994), "Water for California agriculture: Lessons from the drought and new water market reform", Choices:25-28. Zilberman, D., D. Sunding and M. Khanna (1997), "The changing nature of agricultural markets: Implications for pri~atization of technology, information transfer, and the role of land-grant research and extension", in: S. Wolf, ed.", Privatization of Information and Agricultural Industrialization (CRC Press, Boca Raton, FL). Zilberman, D., C. Yarldn and A. Heiman (1998), "Agricultural biotechnology: Economic and international implications", Mimeograph (Department of Agricultural and Resource Economics, University of California, Berkeley).
Chapter 5
S T R U C T U R A L C H A N G E IN A G R I C U L T U R A L PRODUCTION: ECONOMICS, TECHNOLOGY AND POLICY JEAN-PAUL CHAVAS
Taylor Hall, University of Wisconsin, Madison, W1
Contents
Abstract Keywords 1. Introduction 2. The structure of agricultural production 3. Farm structure 3.1. Farm size and retums to scale 3.2. Economies of scope and diversification 3.3. Technology and farm organization
4. Entry-exit decisions and resource mobility in agriculture 4.1. Capital mobility 4.2. Labor mobility 4.3. Markets and trade
5. Concluding remarks Acknowledgement References
Handbook of Agricultural Economics, Volume 1, Edited by B. Gardner and G. Rausser © 2001 Elsevier Science B. V All rights reserved
264 264 265 266 267 267 271 272 277 277 279 279 282 282 282
264
Z-R Chavas
Abstract Over the last few decades, the structure of agricultural production around the world has been changing. An economic analysis of the factors influencing this evolution is presented. Special attention is given to the role of technology and resource mobility. Linkages with changes in market conditions are also evaluated.
Keywords agricultural production, structure, technology, resource mobility J E L classification: Q11
Ch. 5:
Structural Change in Agricultural Production
265
1. Introduction The process of food production has changed significantly over time and over space. Changes have been influenced by the dynamic interactions between improved technologies and increasing human population [Boserup (1965)]. Over the centuries, the production process has evolved from simple forms of food gathering (e.g., hunting and fishing) to complex biotechnologies (e.g., genetic engineering). Hunting and fishing activities remain important sources of food in some parts of the world, and extensive production systems (e.g., pastoralism) still play significant roles in food production where population density is low and/or land productivity is low. However, intensive forms of production are now commonly found around the world. These intensive forms have typically been associated with high population densities, productive land, and rapid technological progress. The evolving organization and structure of agricultural production remains a subject of considerable interest. Historically, land rights and relations have evolved in response to changing population density, market access, and agrarian policy [Boserup (1965), Binswanger et al. (1993), Binswanger and Deininger (1997)]. At the microeconomic level, various institutional forms can support food production, from territorial rights associated with hunting and fishing, to collective farms (e.g., the Israeli kibbutz), to private farms. Private farms include large commercial farms relying extensively on hired labor as well as family farms relying mostly on family labor. Around the world, the current prevalence of the family farm as a socioeconomic unit of agricultural production (where it is often difficult to distinguish between production unit and household consumption unit) is particularly noteworthy. The evolution of farm structure is part of a complex evolution of the farm sector and its role in a global economy. The main function of the farm sector is to feed a growing world population. The world population reached 6 billion people in 1999, up from 5 billion people in 1987. Feeding this growing population is a significant challenge, suggesting a strong and increasing demand for food. In this context, it may be surprising to see that the average real price of food has been declining over the last few decades. This has been possible only because of a large increase in food production and remarkable productivity gains. This stresses the importance of technical change in agriculture. Another notable characteristic of the food sector is the instability of its markets. Part of the instability is due to weather effects, which affect farm production, farm prices, and farm income. Part of the instability is also due to the low price elasticity of demand for food and the perishability of a number of food commodities. An inelastic food demand means that food prices can react sharply to small changes in food supply. This suggests significant risk in anticipating agricultural prices. The instability of agricultural markets and farm income can raise questions about whether market prices always provide appropriate guides to efficient resource allocation in the food sector [e.g., Innes and Rausser (1989), Newbery and Stiglitz (1981)]. This seems particularly relevant in a period of market liberalization, where the role of government in agriculture is declining around the world, with greater emphasis being given to markets and trade.
266
J.-P. Chavas
2. The structure of agricultural production
Since the beginning of the twentieth century, the spread of mechanization, increased land productivity due to technical progress (e.g., the "green revolution"), and rural migrations toward cities have transformed the system of agricultural production around the world. The transformation has taken many forms. First, migration from rural areas toward urban jobs has been associated with the growth of the industrial and service sector, and with a sharp increase in farm labor productivity due in large part to mechanization. In situations of slow economic development, few urban jobs and a slow growth in the industrial sector have restricted the labor migration flow and reduced the demand for farm mechanization. Alternatively, in situations of rapid economic growth, significant labor migrations have reduced the proportion of the active labor force employed in agriculture. Taking place over several decades, this process has transformed farming into a sector employing only a small portion of the active population. In developed countries, such changes have induced a trend toward mechanization and significant increases in farm size. The product mix produced by farmers has also changed. In general, farms have evolved toward greater product specialization. In developed countries, this can be seen today through the development of large, specialized animal production units in broiler, dairy or pork production (which contrast with the more traditional mixed crop-animal farms). Agricultural sectors around the world are increasingly relying on trade and market mechanisms as a means of guiding resource allocation in agriculture. This coincides with a decline of food self-sufficiency motive as a guiding force for the organization and structure of farming, at both the micro level and the national level. As trade for food and fiber developed, the role of agricultural markets has become more important both in developed and developing countries. At the national level, this means less reliance on government programs. At the farm level, economic survival pushes managers toward implementing efficient production systems adapted to local conditions, toward developing marketing skills that can take advantage of market opportunities, and toward risk management strategies that can effectively deal with weather risk and changing market conditions. Finally, the increasing role of contracts in agriculture is worth emphasizing. For example, the broiler sector has exhibited high growth and significant productivity gains over the last 40 years. It has also been associated with the development of vertical integration, where coordination between different stages of the marketing channel is done mostly through contracts. The use of contracts as a control and coordination mechanism is also commonly found in vegetable production, and increasingly in pork production.
Ch. 5:
Structural Change in Agricultural Production
267
3. Farm structure 3.1. F a r m size a n d returns to s c a l e
Issues related to the structure of agriculture and to the survival of the family farm have long been subjects of interest and controversy [see, e.g., Allanson (1992), Gale (1993), Goetz and Debertin (1996), Hearn et al. (1996), Lianos and Pafliarou (1986), Weiss (1998)]. At the center of this debate is the relationship between farm size and economic efficiency: are large farms more efficient than small farms? Is it possible to identify an "optimal" farm size? The nature of returns to scale in production can help shed some light on these issues. Returns to scale reflects the relationship between average production cost and firm size. Increasing (decreasing) returns to scale corresponds to an average cost (per unit of output) 1 being a decreasing (increasing) function of output. And constant returns to scale means that average cost is unaffected by firm size. Alternatively, finding that larger firms exhibit a lower (higher) average cost identifies the presence of economies (diseconomies) of scale. In crop production, it often appears relevant to consider land as a fixed factor. Then, returns to scale can be alternatively measured in terms of the properties of the average return per unit of land: increasing (constant, decreasing) returns to scale corresponds to the average return per unit of land being an increasing (constant, decreasing) function of farm acreage. In this context, the average return per acre is the Ricardian rent, measuring the return to land after all other factors of production have been remunerated [e.g., see Chavas (1993)]. 2 Under free entry and exit, competitive firms producing under increasing returns to scale implies negative profit, giving incentives for firms to either exit the industry or expand. And competitive firms producing under decreasing returns to scale implies positive profit, providing incentives for new firms to enter the industry. Thus, under perfect resource mobility, industry equilibrium is expected to include only firms producing in the region of constant returns to scale (which exhibits neither increasing nor decreasing returns to scale). This has stimulated much research trying to identify the shape of the average cost function as it relates to farm size. Alternatively, in the absence of perfect resource mobility, power relations can become closely linked to land rights and the structure of agricultural production [e.g., De Janvry (1981), B inswanger et al. (1993), Binswanger and Deininger (1997)]. For example, Binswanger et al. argue that the historical emergence of large farms in many developing countries was based on power relations and economic distortions, where the international competitiveness of these farms was often maintained by subsidies involving significant social costs. Such situations motivated agrarian reforms redistributing land with an attempt to improve both equity and efficiency. I In a multi-outputframework,the relevant function is the ray-averagecost function, i.e., the cost of production per unit of a factor proportionallyrescaling all outputs [see Banmol (1982)]. 2 Thismeans that land rent should not be lxeated as a cost in cost of production studies.
268
Z-PChavas
In developing countries, there is debate about the inverse relationship often observed between farm size and productivity [e.g., Rao and Chotigeat (1981), Eswaran and Kotwal (1986), Binswanger et al. (1993)]. The argument is that, compared to large farms, small family farms face lower labor cost because of lower cost of labor supervision. Then, in situations of unequal land distribution, land reform can in principle generate a more egalitarian access to land while increasing farm productivity and efficiency [e.g., by combining "underused" labor from small farms and the landless with "underused" land on very large farms; see Berry and Cline (1979)]. However, small farms may face higher capital cost (e.g., due to credit rationing and capital market imperfections) if large farms have better access to the capital markets. In such a situation, it is possible for the relationship between farm size and productivity to be U-shaped, large farms enjoying a credit cost advantage while small farms enjoy a labor cost advantage [Binswanger et al. (1993)]. In agriculture of developed countries, the empirical evidence suggests that the average cost function has a typical L shape: average cost tends to decline for small farm sizes, and then reach a lower plateau for average to large farm sizes [e.g., Hall and Leveen (1978)]. This suggests three points. First, economies of scale seem to exist for small farms. Second, there is no strong evidence that diseconomies of scale exist for large farms. Third, there is a fairly wide range of farm sizes where average cost is approximately constant [e.g., Kislev and Peterson (1996)]. This has focused some attention on the "minimum efficient" farm size, i.e., the smallest farm size that can capture the benefits of economies of scale. Knowing this minimum efficient size is particularly relevant for the evaluation of the efficiency of farm structure and land reform policy. One problem is that there is no clear consensus on what the "minimum efficient" farm size is. For example, Hall and Leveen's (1978) analysis suggests that in California this minimum may be around 100 acres of land. But there is also evidence that small farms can be scale-efficient in developed countries [e.g., Garcia et al. (1982)] as well as in developing countries [e.g., Yotopoulos and Lau (1973), Kalirajan (1981)]. For example, Yotopoulos and Lau, and Kalirajan provide evidence that, in India, small farms (fewer than 10 acres) are at least as efficient as large farms. How can we reconcile these apparent inconsistencies? First, farmers have the option of choosing among different technologies, each one adapted to particular farm sizes. The typical situation is that, for a given technology, average cost tends to decrease with size, up to some capacity beyond which average cost increases. As farm size increases, a switch can take place from one technology to another better adapted to larger sizes (e.g., through capital investment and mechanization), so that the region of decreasing returns to scale is often not observed. Also, the minimum average cost of each technology may be fairly constant across technologies. This implies that the lower-bound envelope of the minimum average cost across technologies (the "long-run average cost" function) is rather flat. This is illustrated by Matulich (1978), in the context of studying the relationship between average cost and herd size in U.S. dairy farms. This suggests that, while increasing returns to scale may well be present for a given technology, the situation of constant returns to scale may be
Ch. 5:
Structural Change in Agricultural Production
269
approximately satisfied across technologies for a wide range of farm sizes. This would help explain why there is empirical evidence of increasing returns and constant returns to scale appearing to coexist in agriculture. Also, it helps explain why farm size can vary over such a wide range, both within a country and across countries. This indicates that, as long as farms have access to a technology adapted to their size, there may not be great efficiency gains from changing farm sizes or from land redistribution schemes. The land redistribution programs recently implemented in South Africa or in the former Soviet Union (FSU) have been motivated by both efficiency and equity concerns. This suggests that, provided that they can be implemented without adverse effects on farmers' access to markets or technology, land reform programs can improve wealth equity while maintaining or even enhancing (e.g., due to better incentives under decentralized management in the FSU) agricultural productivity. However, avoiding these adverse effects while redistributing land can be difficult. As a result, the success of land reform policies can vary significantly across countries [e.g., see Lerman (1999), for the recent FSU experience]. Second, the empirical estimation of returns to scale often depends on the measurement of cost. In agriculture, the measurement of the cost of family labor is problematic. Family labor is often valued at its opportunity cost [e.g., Hall and Leveen (1978)]. However, measuring precisely this opportunity cost may be difficult. Also, there are some questions about whether opportunity cost is the appropriate value of family labor. Microeconornic theory suggests that family labor has a "shadow value" which can depend on both its opportunity cost, and on household preferences with respect to time allocation. The latter becomes important when household farm work generates direct utility to the household (in a way similar to leisure in the neoclassical household model). For example, this would happen whenever family members enjoy working on the farm. In this case, the shadow price of family labor is equal to its opportunity cost [e.g., the wage rate in off-farm work), minus the unit value of "enjoying farm work". Note that the neoclassical agricultural household model [e.g., Singh et al. (1986), Benjamin (1992)] implicitly assumes that the shadow value of "enjoying farm work" is zero (farm work then being valued at its opportunity cost). However, there is empirical evidence against the hypothesis that "enjoying farm work" has zero value [see Lopez (1984), for Canadian agriculture]. This is true for "hobby" farms, where agricultural activities are also seen as "leisure" activities. It also seems to characterize a number of part-time farmers. These arguments suggest that, in general, the shadow value of family labor is not always equal to its opportunity cost. This is particularly relevant to the extent that, while many large commercial farms may approximately satisfy the assumptions of the neoclassical agricultural household model, "hobby" farmers and part-time farmers typically have small farms. This suggests that the valuation of family labor may in fact change with farm size: ceteris paribus, the shadow value of labor on some small farms may be lower than on larger farms because of the enjoyment of farm work by "hobby" farmers and some part-time farmers. This also means that the opportunity cost of labor is an upward-biased estimate of the shadow price of family labor on some small farms. In
270
Z-R Chavas
this case, finding high average production cost on small farms may simply reflect this measurement bias (rather than the existence of increasing returns to scale). Besides technology, many other factors can also influence the choice and efficiency of farm size. They include transaction costs, market imperfections, access to markets, and pecuniary economies. In developing countries, access to markets may vary across farm sizes [e.g., credit rationing is more prevalent on small farms; see Binswanger et al. (1993)]. In general, pecuniary economies are said to exist when larger farms pay lower prices for their inputs (due to lower transaction cost and/or stronger bargaining power), thus lowering their average production cost. And for similar reasons, large farms may receive higher prices for their outputs. Then, pecuniary economies would give larger farms some economic advantage and provide an incentive for increased farm size. When paid by farmers, transaction costs are parts of the cost of production (e.g., monitoring costs, transportation costs, information costs). Also, they can contribute to higher input prices (when paid by farm input suppliers) and lower farm output prices (when paid by food traders and processors). In either case, they tend to reduce farm profitability. Some transaction costs may be higher on large farms (e.g., monitoring cost of hired labor), thus giving some cost advantage to smaller farms [e.g., Eswaran and Kotwal (1986), Binswanger et al. (1993)]. Alternatively, information costs about prices or technology may be higher on smaller farms, thus giving some economic advantage to larger farms and providing incentives to increase farm size. And, as it improves information processing in decision making, higher quality of human capital (e.g., due to education or experience) has been found to be positively related to farm size [Sumner and Leiby (1987)]. Also, tax policy can affect farm size and structure [e.g., Gardner and Pope (1978), Lowenberg and Boehlje (1986)]. Tax policy is often designed to stimulate capital investments (e.g., through investment tax credit or depreciation allowances that reduce taxable income). The associated reduction in taxes and increase in after-tax income is typically greater on capital-intensive farms. To the extent that capital-intensive farms tend to be larger, this means that tax policy can favor larger farms and thus provide an incentive for increasing farm size. Finally, risk exposure can influence the size and structure of farms. This is relevant since risk markets are typically incomplete in agriculture, implying that most farmers face significant price risk (due to biological lags in the production process) as well as production risk (due to weather effects and pest problems). Being in general risk averse [e.g., Lin et al. (1974), Binswanger (1981), Newbery and Stiglitz (1981), Innes and Rausser (1989), Chavas and Holt (1996)], farmers are made worse offby being exposed to risk. In this context, a risk premium has been used as a measure of the implicit cost of private risk-bearing [Pratt (1964)]. Under some conditions, the average risk premium is expected to increase with farm size [Chavas (1993)]. This suggests that risk exposure gives some economic advantage to smaller farms and provides a disincentive for increasing farm size. Alternatively, larger farms may have access to better risk management strategies that can help reduce their risk exposure. These strategies include diversification strategies and the development of flexible plans that can deal better with
Ch. 5: Structural Change in Agricultural Production
271
unforeseen contingencies (e.g., by investing in forms of capital that have multiple uses). They also include financial and marketing strategies (e.g., hedging, contracts, access to capital and financial markets) that can redistribute risk toward agents who are better informed and/or have a better ability to bear risk. In general, it appears that larger farms are more likely to develop (compared to smaller farms) under conditions of reduced risk exposure and/or more refined risk management schemes. In addition, there is significant uncertainty about product quality in agriculture. For example, pesticide contamination and biotechnology have raised consumer concerns about food safety. This has stimulated the use of contracts as a way to improve food quality. Also, it has increased the prospects for product differentiation and market segmentation in agricultural markets. For example, some farms have been able to capitalize on the growing demand for "organic" food. By using production techniques that are perceived by consumers to produce higher quality and safer products, they can sell their products at higher prices on differentiated markets. This requires establishing separate marketing channels, often a significant challenge. When feasible, this has allowed some small farms (that are typically more labor-intensive and less capital-intensive) to survive and prosper even while facing relatively high production costs. Finally, compliance with environmental rules and regulations is increasingly important in agriculture. This is motivated by situations of pollution and externalities where farming has adverse impacts on the environment (e.g., nitrate contamination of groundwater). The associated costs can affect the choice of size and location of production units. These effects depend on the environmental externalities generated, the nature of the regulations, and the abatement technology available. In some cases, large farm operations may increase pollution problems by concentrating the pollutants in a few locations (e.g., as in livestock production). Then, environmental regulations would likely have a greater impact on large production units. This may favor smaller farms. Alternatively, it may be that larger farms have access to better abatement technology, which would improve their ability to manage agricultural externalities. 3.2. Economies o f scope and diversification
Farms are typically multi-product firms. Most produce more than one output, either implementing crop rotation practices or using an integrated crop-livestock production system. Yet the extent of farm specialization varies both over time and across space. In general, there is a tendency for commercial farms to be more specialized than subsistence farms, with an overall trend toward increased specialization. The fact that most farms are multi-product firms suggests that the benefits of diversification are significant in agriculture. These benefits take two forms: the presence of economies of scope reflecting the reduced cost associated with producing multiple outputs, and the risk-reducing effects of diversification. Economies of scope in agricultural activities appear to be significant [e.g., FemandezCornejo et al. (1992), Chavas and Aliber (1993)]. Crop rotations generate well-known benefits. They allow different crops to better exploit the fertility of the soil. For example,
272
~-PChavas
corn planted after soybean benefits from the soybean's ability to fix nitrogen. Also, crop rotations contribute to lowering pest populations, thus reducing the need for pesticides. Finally, integrated crop-livestock systems can involve forage production that helps improve land fertility and reduce soil erosion, while manure can ameliorate soil quality and increase crop yields. As argued above, risk and risk aversion provide incentives for farmers to reduce their risk exposure. To the extent that different activities are influenced differently by weather conditions or pest problems, diversification can be an effective way of reducing farmers' risk exposure. There is empirical evidence that risk reduction is a significant motivation for farm diversification [e.g., Lin et al. (1974)]. Both economies of scope and the risk benefits associated with farm diversification suggest strong incentives for farms to be multi-product enterprises. But this does not explain the historical trend toward more specialized farms. Such a trend indicates that there are also significant benefits to specialization. Such benefits come mainly from improved productivity. Typically, a task is better performed by a specialist than by a general manager. For example, a veterinarian is expected to better manage animal health problems on a farm than a general farm manager. But specialized management may become profitable only on larger firms. Often, the benefits of specialization can be obtained only beyond some minimal scale of operation. This suggests the existence of an important trade-off between farm size and diversification. As farm size increases, the benefits of specialization and the associated enhanced productivity rise, which can counterbalance the benefits of diversification mentioned above. The net effect is that economies of scope tend to decline with farm size. This is supported by empirical evidence of a negative relationship between economies of scope in agriculture and farm size [e.g., Fernandez-Cornejo et al. (1992), Chavas and Aliber (1993)]. This provides an economic rationale for why larger farms tend to be more specialized than smaller farms, as the former are in a better position to capture the benefits of specialization. It also suggests that the trend toward more specialized farm production systems is in large part motivated by productivity improvements.
3.3. Technology and farm organization Over the last century, agriculture has undergone two remarkable changes: rapid technological change (both in developing and developed countries), and significant reduction in farm labor (mostly in developed and newly industrialized countries). These two factors are not unrelated. First, technical progress was a necessary condition for the decrease in farm labor: without it, feeding the growing urban population would not have been possible. Second, the evolving labor market has had some feedback effects on the nature of technical change in agriculture. Over the last few decades, productivity growth has been the principal factor responsible for economic growth of agriculture in developed countries [Capalbo and Antle (1988), Ball (1985), Ball et al. (1997)]. For example, over the last four decades, U.S. agriculture has seen an average increase in output of 1.9 percent a year, and an increase
Ch. 5:
Structural Change in Agricultural Production
273
in productivity of 1.9 percent a year [Ball et al. (1997)]. This indicates that technical progress (i.e., significant improvements in land and labor productivity) contributed to most of the increase in farm output. Such remarkable results apply to most developed countries [see, e.g., OECD (1995)]. On average, productivity growth in agriculture has been larger than in many other sectors. For example, Jorgenson and Gollop (1992) found that the growth rate of U.S. agricultural productivity has been four times larger than the corresponding rate in the rest of the economy. This stresses the importance of agricultural technical change in developed countries. However, the extent and nature of agricultural productivity growth in developing countries has been less uniform. Over the last three decades, land productivity and labor productivity have increased significantly in most countries [Pardey et al. (1991), Craig et al. (1997)]. However, sub-Saharan Africa has seen stagnation in its agricultural labor productivity [Craig et al. (1997)]. In developed countries, the twentieth century has seen significant economic growth in the non-farm sector, which increased non-farm employment and raised urban wages. This created some disparity between farm and non-farm income and produced incentives for a large labor migration from farms to urban areas [Schultz (1945)]. It significantly reduced the amount of both family labor and hired labor in agriculture. The decrease in hired labor resulted in the typical farm being a family farm with little or no hired labor. And, given that total farmland has been fairly constant in most developed countries, the decrease in family labor has implied a rise in average farm size over time. This also stimulated the adoption of labor-saving technology in agriculture (e.g., mechanization), yielding large increases in farm labor productivity. It illustrates the existence of feedback effects of resource scarcity on technical change. More generally, these feedback effects have been associated with the "induced innovation" hypothesis [Binswanger (1974), Hayami and Ruttan (1985)]. This hypothesis states that relative resource scarcity tends to guide technological change toward using additional inputs that are plentiful and inexpensive, while saving on scarce and expensive inputs. This is consistent with labor-saving technological change being stimulated by higher wages. This is also consistent with fertilizer-using technological change found in North American, European, and Asian agriculture in the 1960s and '70s [Binswanger (1974), Hayami and Ruttan (1985)]. 3 It involved the development of high-yielding varieties (through genetic selection) of corn, wheat, and rice that were particularly responsive to nitrogen fertilizer. The incentive to develop and adopt these new varieties came in part from technological progress in the nitrogen fertilizer industry, which reduced the market price of nitrogen fertilizer. This combination of low-cost fertilizer with highyielding varieties contributed to large crop yield improvements in developed agriculture, and to the success of the "green revolution" in developing countries. Note that the period since the mid-1970s has seen higher prices for energy, fertilizers, and pesticides. There is empirical evidence suggesting that this period also saw some 3 However,note that thereis also empiricalevidencesuggestingsomeinconsistenciesbetweenthe induced innovationhypothesisand technical change in agriculture [e.g., Chavas and Cox (1997a)]. This stressesthe complexityof the processof technicalchange.
274
j.-l~ Chavas
changes in U.S. agricultural technology toward becoming more "input-saving" for these inputs [Chavas and Cox (1997b)]. Again, being consistent with the induced innovation hypothesis, this illustrates that the nature of technical change appears to be sensitive to relative resource scarcity. Over the last few decades, some agricultural technologies have been identified as contributing to pollution of the environment (e.g., groundwater pollution by nitrates) and degradation of the ecosystem (e.g., pesticide contamination). New technologies are currently being developed in an attempt to reduce these adverse effects of agriculture. They include the development of nitrogen-fixing corn and pest-resistant varieties. These emerging technologies offer new prospects to improve the current management of the ecosystem. The process of technical change has been found to have large economic effects both within agriculture and within society [e.g., Griliches (1960), Schmitz and Seckler (1970), Huffman and Evenson (1993), OECD (1995)]. The current use of genetic engineering and biotechnology in both crop and animal production gives good prospects for continuing technical progress in agriculture. Typically, the adoption of a new technology is a slow diffusion process [e.g., Griliches (1957)]. At first, a few early adopters can benefit economically from the increased productivity it generates. Eventually, as a majority of producers adopt it, the new technology contributes to higher farm output and lower food prices. As a result, consumers gain significantly from technical progress. At the same time, the farms that are late adopters typically face difficult economic conditions: high production costs accompanied by lower food prices. This is Cochrane's (1958) "treadmill effect": in the presence of rapid technical progress, any farmer who does not quickly adopt new technology is threatened with declining profit. This puts considerable pressure on farm managers to remain informed about emerging technologies and their adaptation to local agro-climatic conditions. In general, the early adopters are likely to have good managerial skills. This means that technical change would tend to favor good managers. This "management bias" has important implications. For example, if specialization tends to be associated with superior management, then technical change would favor specialized production systems. This indicates that the distribution of the benefits from technical progress can vary greatly across firms within an industry. Notably, most of the new agricultural technology did not originate from the farm. Rather, it typically came from some combinations of private and public institutions that made significant investments in agricultural research and development (R&D). Historically, the payoff from both private and public R&D investments in agriculture has been high. On average, their estimated rate of return has been in the range of 20 to 30 percent in the U.S. [e.g., Griliches (1960), Hayami and Ruttan (1985), Chavas and Cox (1992, 1997a), Huffman and Evenson (1993)]. For both private and public R&D, there is evidence of significant lags between the timing of investment and its effects on farm productivity, the lag varying between 10 and 30 years. The empirical evidence suggests that private R&D investments appear to generate their returns in the intermediate run (after about 8-15 years), while public R&D investments seem to pay off in the longer run (after 15-25 years) [e.g., Huffman and Evenson (1993), Chavas and Cox
Ch. 5:
Structural Change in Agricultural Production
275
(1992, 1997a)]. This is consistent with the 17-year legal patent protection, and the fact that private research tends to be more "applied". In contrast, public research tends to be more "basic", with longer-term and more uncertain payoff. However, the relative role of public versus private agricultural research is changing. In U.S. agriculture, investments in private research have increased faster than in public research. As a result, the share of public research has declined from 50 percent in 1981 to 45 percent in 1996 [Frisvold et al. (1998)]. This move toward the privatization of agricultural research is observed in many countries around the world [OECD (1995)]. With the current developments in biotechnology, it involves a redefinition of the relationships between private research and public research, as they promise to influence technical progress in agriculture in the twenty-first century. It is worth emphasizing that the rate of technical progress has varied across industries and across regions. As discussed above, over the last few decades, most countries have exhibited large agricultural productivity growth [e.g., OECD (1995), Pardey et al. (1991), Craig et al. (1997)]. This is the main factor explaining the trend toward lower food prices. However, one significant concern relates to the current situation in Africa. Over the last three decades, sub-Saharan Africa has been in large part bypassed by the "green revolution". And current agricultural R&D investments indicate that it is not likely to benefit greatly from new biotechnology. This suggests that the prospects for large agricultural productivity growth in sub-Saharan Africa are not very good. This creates significant challenges to technology and economic development policies in this part of the world. As discussed above, part of the increase in farm productivity over the last few decades has been associated with increased specialization. In many developed regions (e.g., Western Europe, U.S.A.), at the beginning of the twentieth century, most farm households were small and greatly diversified. Being strongly motivated by food selfsufficiency motives, they attempted to produce most of the household food consumption needs. This changed with the growth of agricultural markets, which facilitated the development of specialization in agriculture at the farm level, the regional level, as well as the national level. Greater specialization reduced the scope of activities and increased the need for market exchange for each farm and each region. It allowed farm managers to focus their skills on just a few enterprises, thus improving their production control and efficiency. It also allowed farm and food marketing firms to become better organized spatially, thus contributing to lower transportation and marketing costs. As a result, farms and regions evolved toward more specialized production systems that exploited their comparative advantage reflecting local agro-climatic conditions. As they became better integrated in the market economy, they received the benefits from market exchange and trade. This contributed to more efficient and more productive agriculture at the farm, regional, national, as well as world levels. This process is still in progress as regions and nations negotiate politically with each other over the distribution of the benefits from trade. While the role of agricultural markets has for the most part been increasing over time, vertical coordination in some sectors has come to depend on contracts. This is particu-
276
Z-PChavas
larly true for highly perishable products such as vegetables, where product quality and timing of economic decisions are closely linked. In those sectors, contractual relationships between producers and food processors typically exist, which stipulate the quality, quantity, and timing of production [Marion (1986)]. By improving product quality and timeliness, contracts can contribute to improving production and marketing efficiency in the food sector. Contractual relationships have also developed in some animal production. Starting in the 1950s, the broiler industry evolved quickly toward vertical integration. This was associated with production contracts, greater specialization, and rapid productivity gains [Lasley et al. (1988)]. A similar process is underway now in pork production, and to some extent in beef production. Why is this move toward greater integration taking place in agriculture? At least three contributing factors have been proposed: efficiency gains, productivity gains, and the exercise of market power. First, efficiency gains would be obtained in the presence of economies of scope across the production systems being integrated. But, in his investigation of the U.S. pig sector, Azzam (1998) did not uncover evidence of vertical economies of scope between feeder-pig production and finishing. Second, it is often believed that integration can help stimulate productivity. The rapid productivity gains of the broiler industry under vertical integration is an illustrative example [Lasley et al. (1988)]. Third, the possible role of market power as a motivating force behind integration has generated both interest and concerns [e.g., Marion (1986), Azzam (1996), McCorriston et al. (1998)]. Azzam (1996) found some empirical support for the hypothesis that monopsony provided an (inefficient) incentive that contributed to the backward integration of the U.S. beef slaughter industry into the live cattle market. In general, farmers approach their input and output markets as price takers. However, they can face marketing firms that are large and in a position to exercise market power. This raises questions about the effects of market concentration on the organization and performance of the food sector [Marion (1986), Huang and Sexton (1996), Cotterill (1997)]. Although a discussion of these issues is beyond the scope of this chapter, it seems appropriate here to mention the role of agricultural cooperatives. Cooperatives can be prevalent in particular sub-sectors (e.g., as in the case of the U.S. dairy subsector) [Marion (1986)]. Cooperatives can be interpreted as an institutional response to market imperfections. Often, a cooperative projects its member either forward or backward in a marketing channel. It can therefore accomplish many of the same purposes as vertical integration [Sexton (1986)]. Some of the motivations for cooperative formation include improving product quality and avoiding monopoly or monopsony situations [Marion (1986)]. In this context, cooperatives have an efficiency-enhancing role: they can help improve vertical coordination in the agricultural sector. Alternatively, cooperatives can be used as a means of increasing the bargaining power of farmers facing imperfectly competitive markets. When applied to agricultural marketing, cooperatives can generate significant price enhancements through their exercise of bargaining power. Under strong bargaining power, this would increase members' income, but can also lead to inefficient and non-competitive outcomes. However, under free entry, one may
Ch. 5: StructuralChange in Agricultural Production
277
expect such inefficiencies to be unsustainable in the long term, unless some form of supply control is implemented.
4. Entry-exit decisions and resource mobility in agriculture In our earlier discussion of economies of scale, we assumed free entry and exit, i.e., perfect resource mobility. We now examine the role of imperfect resource mobility in agriculture. The typical family farm is heavily influenced by the life cycle of the farm household manager. Two phases of this life cycle are particularly important: the beginning of the cycle when a young manager decides to work on a farm; and the end of the cycle when an older manager decides to retire from farming. In between, with a few exceptions, 4 the continuation of the family farm is often not an issue. Thus, some of the most important decisions made by a farm household manager are long-term decisions that are not subject to frequent renegotiation. This suggests rather low mobility of farm labor in the short term. Similarly, land rights typically remain under the control of the same manager over extended periods of time. Finally, at least part of farm capital is usually "specialized", meaning that it has few alternative uses. An example is a milking parlor that cannot be moved easily and has no alternative use but the milking of cows. This indicates that agriculture is a sector characterized by restricted resource mobility, at least in the short run. In other words, the dynamic adjustments of land, capital, and agricultural labor tend to take place over many years [e.g., Schultz (1945), Brandow (1977)]. This reduced resource mobility can be traced in large part to special characteristics of agricultural production. Land and climate are specific to particular locations and cannot be moved. As a result, many agricultural adjustments involve spatial adjustments in other factors of production, in particular farm capital and farm labor. Yet agricultural investments in human and physical capital can also be location-specific. When there are significant costs of moving capital or labor over space, this generates a situation of "asset specificity" which affects the dynamic process of resource allocation in agriculture. This is the issue of "asset fixity" analyzed by Johnson and Quance (1972). 4.1. Capital mobility
A situation of asset fixity can be linked to the existence of sunk investment costs. An investment is sunk if the unit value of investment is higher than the unit value of disinvestment. This happens when the purchase price of capital is larger than its salvage value. For example, the salvage value of a milking parlor is typically close to zero, implying that the investment in a milking parlor is almost entirely sunk. The existence of 4 A notable exception includes situations of foreclosure and bankxuptcy,where large debt and severe financial stxess can force the farm household manager out of agriculture.
278
~ - ~ Chavas
sunk cost can be linked to transaction costs and/or market imperfections. In the case of a milking parlor, the lack of alternative uses and the high cost of moving are the main reason why its salvage value is so low. Sunk costs imply that an investment decision cannot be reversed costlessly. In general, there is an economic incentive for decision makers to avoid facing sunk costs. In situations of risk, this means that sunk costs provide an incentive to avoid reversing any decision, i.e., to keep capital in its current utilization. As analyzed by Dixit (1989), Chavas (1994), and Dixit and Pindyck (1994), this has three implications. First, under sunk costs, there is a zone of "asset fixity" where investments fail to respond to small changes in economic incentives [Johnson and Quance (1972)]. This can be interpreted as a "market failure", where changes in relative prices may not help guide the process of resource allocation at least in the short run. And it can lead to the segmentation of markets [e.g., Shiha and Chavas (1995)]. Second, asset fixity provides a disincentive to exit an activity. In the 1950s and 1960s, this generated a situation where agricultural resources were relatively slow to exit U.S. farming even in the face of persistently low return. Third, asset fixity interacts with uncertainty to provide a disincentive to invest. In other words, sunk costs and risk can create "barriers to entry". Vasavada and Chambers (1986) presented empirical evidence supporting a form of asset fixity and the presence of sluggish adjustments to price changes for labor and capital in U.S. agriculture. And the interaction of sunk costs and uncertainty can adversely affect market participation decisions and thus the functioning of markets [e.g., De Janvry et al. (1991), Goetz (1992)]. Advances in farm technology made capital highly productive and attracted capital into agriculture. In the longer term, capital investments have greatly stimulated labor productivity. High capital requirements have also made entry into farming more difficult. This has generated some concerns about the survival of the family farm [e.g., Gale (1993), Weiss (1998), Goetz and Debertin (1996), Allanson (1992)]. Weiss presents some Austrian evidence supporting an emerging bimodal structure of farm sizes: small part-time farmers and large farms surviving, with mid-size farms decreasing in relative number. The role of off-farm income in sustaining small farms has been documented [e.g., Hearn et al. (1996), Lianos and Parliarou (1986)]. It suggests that, in the absence of off-farm income, many prospective young farmers may find it economically unattractive to support a family on a mid-size farm. Finally, it is often suggested that government policies (e.g., government programs, tax policy) have contributed to increases in farm size [e.g., Lowenberg and Boehlje (1986), Goetz and Debertin (1996)]. There is evidence that the benefits from government farm programs are often not equitably distributed: the majority of the associated income transfers tend to go to large farms and relatively wealthy families [e.g., Sumner (1990)]. However, it is not clear how this affects the return per unit of land between small farms and large farms. Furthermore, distinguishing empirically between the effects of government policies and those of technical progress is difficult. As a result, the exact role of government policies in explaining the trend toward larger farms in developed countries remains somewhat unclear [e.g., Gardner and Pope (1978), Sumner (1990)].
Ch. 5: StructuralChange in Agricultural Production
279
4.2. Labor mobility
Individuals on farms have the option of choosing between farm work and non-farm employment. However, except when located near urban areas, choosing non-farm employment often requires moving to an urban area. As mentioned above, rural migration to cities has been an important aspect of structural change in agriculture through most of this century. Migration decisions depend on the nature of labor demand outside agriculture. For example, during the 1950s and 1960s, expanding industrial production created many urban job opportunities in developed countries. This was also a period when average household income was typically higher in urban areas. This stimulated rural migration. The persistence of this income gap over several decades points to "farm labor specificity". At least two factors contribute to this specificity: (1) investments in farm human capital are partially sunk whenever some farm skills have few alternative uses outside the farm sector; and (2) migration decisions involve significant information and transactions costs that are also sunk. This has generated a rather slow adjustment process in the farm labor market. However, over several decades, this process can still provide massive labor shifts across sectors (as observed in developed and newly industrialized countries). In developed countries, the last two decades have seen most of the employment growth in the service sector. In the U.S., the income gap between farm versus urban households has been reduced (due in part to a leveling-off or a decline in real wages in urban areas). As a result, the income incentive to migrate from rural to urban areas is currently not as strong as it was in the 1950s or 1960s. This suggests that the decision to become a farmer versus working in the non-farm sector has become more complex over the last two decades. After decades of rural migrations to cities, the remaining active farm population is quite small. The fact that farm production increased in the face of such a sharp reduction in farm labor stresses the large labor productivity gains in agriculture. Given that in developed countries farming currently employs only a few percent of the active population, the prospects for important rural migration are now limited. As a result, there is a new focus on the role of non-agricultural activities in rural areas. Also, the concerns have shifted from exit issues to entry issues in agriculture [e.g., Gale (1993)]. What institutions are training and preparing the farmers of tomorrow? What is being done to reduce some of the adverse effects of risk and asset specificity in agriculture? With the rising importance of human capital, the structure of agriculture is slowly evolving toward units of production, stressing the role of technological and managerial skills. 4.3. Markets and trade
Over the last few decades, there has been a great increase in the role of agricultural markets in resource allocation. The 1980s and 1990s have seen an increased reliance on markets and a decreased role of government in agriculture. Structural adjustment policies advocated in the 1980s by the IMF and the World Bank have enhanced the
280
Z-RChavas
role of agricultural markets in guiding the allocation of agricultural resources in many developing countries. Following decades of extensive involvement of government in the U.S. farm sector [e.g., Brandow (1977)], the Federal Agricultural Improvement and Reform (FAIR) Act of 1996 has set the stage for less government involvement in U.S. agriculture. And after decades of limited progress, GATT and WTO trade negotiations in the 1990s have contributed to reducing trade barriers in world agriculture. The increased role of markets has been associated with increased resource mobility, especially for capital and finance. Over the last few decades, the international capital market has become very active, large, and fluid. It has significant implications for economic policy and trade. First, by arbitraging financial returns across countries, the international capital market has restricted the effectiveness of monetary policy conducted by any country. Second, exchange rates are now often more sensitive to international capital flows than they are to changes in the balance of trade. In this context, it is not clear that exchange rates always provide proper signals to evaluate the comparative advantage of production in a particular country. Also, the fluidity in the international capital market means a high volatility in exchange rates, which creates fluctuating import and export prices. As discussed earlier, agricultural production faces significant price risk and production risk. Also, decrease in government involvement has contributed to increased price uncertainty for farmers. What can be done to reduce some of the adverse effects of sunk costs and risk? Good information about market conditions and superior technological and managerial skills seem crucial. Also, various risk management schemes are available. They can be interpreted as private and public safety nets designed to reduce exposure to downside risk. They include the use of insurance against production uncertainty, and of options and futures contracts to reduce price risk. But problems of asymmetric information (moral hazard and adverse selection) have hampered the development of insurance markets. Hedging using futures markets is an effective way to reduce the short-term effects of price risk. For example, traders commonly hedge on exchange rate futures to eliminate the price risk generated by fluctuating foreign currencies. However, the short maturity of most futures contracts means that their usefulness in managing long-term risk is limited. As a result, the use of futures and options markets cannot eliminate the adverse effects of price risk on long-term investments. Various government schemes can also help. They include food aid to developing countries, price support programs that reduce the prospect of facing declining prices, government subsidy of insurance premium, and government disaster payments. All contribute to decreasing downside risk and thus reducing the negative effects of sunk costs and uncertainty on investment incentives. Finally, production and marketing contracts can also help when they redistribute risk and possibly mitigate the adverse influence of risk on resource allocation. However, the associated benefits may not be broadly shared since only the contracted parties receive them. While new technologies are playing a significant role feeding a growing population, they are also raising new questions about food quality. This is illustrated by the current debate about "organic" food and bioengineered crops and livestock. The evaluation of
Ch. 5:
Structural Change in Agricultural Production
281
food quality raises difficult issues both domestically and in international trade, especially when consumer perceptions differ from scientific opinions. The problem is that there is no universal evaluation of what constitutes "safe" food. There is a concern that food produced from new technologies may have some long-term adverse effects on human health (or on the environment), effects that are difficult to observe in the short term (e.g., the case of BST technology in the dairy sector). As a result, we are entering a new era where it is increasingly difficult to treat food items as standard products. This creates new opportunities for product differentiation in the food sector. It also generates significant challenges for developing marketing systems that respond effectively to consumer demand. It seems that we are slowly evolving toward a marketing system of differentiated food products. The role of government is to provide minimum standards of food safety to protect human health against well-documented hazards, and enforce them in both domestic and international markets. Beyond that, market niches are developing for "higher quality" products that command some price premium. Even in the absence of strong scientific evidence, some consumers are willing to pay a premium for food products they perceive to be "safer". With appropriate information (e.g., labeling), consumers are in a position to choose among products of differing quality based on their own evaluation of relative food safety. Conn'acts can play an important role in establishing quality and product differentiation (e.g., in the case of "organic" food). They work best when producers and consumers are in close geographic proximity. This provides new economic opportunities for some farms to develop direct marketing schemes to reach local consumers. To the extent that large farms may find it more difficult to differentiate their products, this may give some economic advantage to smaller farms. More generally, product differentiation will require establishing vertically integrated marketing systems providing quality control and appropriate labeling throughout the marketing channel. Developing such systems remains a formidable task, with significant implications for the future organization and structure of the food system. For international trade, the challenges are even more significant. The temptation is always strong to use food safety concerns to promote protectionism. Trade disputes over food quality will likely become more common. This involves the World Trade Organization (WTO) as well as national courts. WTO deals with global rules of trade between nations, interpreting trade agreements and commitments, and trying to settle trade disputes generated by countries' trade policies. And national courts are involved in settling private as well as public trade disputes. In a world of differentiated products, there is a need for institutional innovations to safeguard and improve the efficiency of international transactions [Casella (1992)]. Traders need to have access to a dispute resolution process acceptable to merchants of different national backgrounds. Judges in national courts are often unfamiliar with the "usage of trade" and the technicalities of specific transactions. This has stimulated international arbitration schemes (e.g., the International Chamber of Commerce in Paris). As a result, a body of law is developing through the published deliberations of arbitrators, deliberations taken as precedents in successive decisions. This can facilitate the process toward further international integration.
282
~ - ~ Chavas
5. Concluding remarks Rapid technological progress and expanding trade have been major factors influencing agriculture. National food security policies were common among many nations in the 1950s and 1960s. It meant only limited competition for many farmers around the world and limited benefits from specialization. The current liberalization of agricultural markets throughout the world means that farmers now face stiffer competition and stronger incentives to specialize. This can be difficult for many farmers who face economic and financial hardship. But this also provides new opportunities for farms, regions, and nations to identify their comparative advantage, exploit it to remain competitive, and contribute to increasing world food supply. A key issue is the nature of resource mobility and its variations across farms, regions, and nations. The farms, regions, or nations that face lower resource mobility will likely see depressed farm income. Alternatively, the ones with human capital, technological and managerial skills, and higher resource mobility will prosper. The challenge is to develop private institutions and government policies that can assist in the evolving production structure and adjustment process in agriculture. Acknowledgement I would like to thank two anonymous referees for useful comments on an earlier draft of the paper.
References Allanson, E (1992), "Farm size structure in England and Wales 1939-89", Journal of Agricultural Economics 43:137-148. Azzarn, A.M. (1996), "Testing the monopsony-inefficiency incentive for backward integration", American Journal of Agricultural Economics 78:585-590. Azzam, A.M. (1998), "Testing for vertical economies of scope: An example from US pig production", Journal of Agricultural Economics 49:427-433. Ball, V.E. (1985), "Output, input and productivity measurement in US agriculture, 1948-79", American Journal of Agricultural Economics 61:475-486. Ball, V.E., J.-C. Bureau, R. Netu'ing and A. Somwaru (1997), "Agricultural productivity revisited", American Journal of Agricultural Economics 79:1045-1063. Baumol, W.J., J.C. Panzar and R.D. Willig (1982), Contestable Markets and the Theory of Industry Structure (Harcourt B.J., New York). Benjamin, D. (1992), "Household composition, labor markets and labor demand: Testing for separation in agricultural household models", Econometrica 60:287-322. Berry, A., and W. Cline (1979), Agrarian Structure and Productivity in Developing Agriculture (Johns Hopkins University Press, Baltimore). Binswanger, H.E (1974), "The measurement of technical change biases with many factors of production", American Economic Review 64:964-976. Binswanger, H.R (1981), "Attitudes toward risk: Theoretical implications of an experiment in rural India", Economic Journal 91,867-890.
Ch. 5:
Structural Change in Agricultural Production
283
Binswanger, H.R, and K. Deininger (1997), "Explaining agricultural and agrarian policies in developing countries", Journal of Economic Literature 35:1958-2005. Binswanger, H.R, K. Deiuinger and G. Feder (1993), "Agricultural land relations in the developing world", American Journal of Agricultural Economics 75:1242-1248. Bosernp, E. (1965), The Conditions of Agricultural Growth (Allen and Unwin, London). Brandow, G.E. (1977), "Policy for commercial agriculture, 1945-71", in: L. Martin, ed., Survey of Agricultural Economics Literature (University of Minnesota Press, Minneapolis). Capalbo, S.M., and J.M. Antle (1988), Agricultural Productivity: Measurement and Explanation (Resources for the Future, Washington, DC). Casella, A. (1992), "On market integration and the development of institutions: The case of international commercial arbitrage", European Economic Review 40:583-591. Chavas, J.-R (1993), "The Ricardian rent and the allocation of land under uncertainty", European Review of A~gicultural Economics 20:451-469. Chavas, J.-E (1994), "On production and investment decisions under sunk cost and temporal uncertainty", American Journal of Agricultural Economics 76:114-127. Chavas, J.-R, and M. Aliber (1993), "An analysis of economic efficiency in agricukure: A nonparametric approach", Journal of Agricultural and Resource Economics 18:1-16. Chavas, J.-R, and T.L. Cox (1992), "A nonparametric analysis of the influence of research on agricultural productivity", American Journal of Agricultural Economics 74:583-591. Chavas, J.-R, and T.L. Cox (1997a), "An analysis of the source and nature of technical change: The case of U.S. agriculture", Review of Economics and Statistics 79:482-492. Chavas, J.-E, and T.L. Cox (1997b), "Production analysis: A nonparametric time series application to U.S. agriculture", Journal of Agricultural Economics 48:330-348. Chavas, J.-E, and M.T. Holt (1996), "Economic behavior under uncertainty: A joint analysis of risk preferences and technology", Review of Economic and Statistics 78:329-335. Chavas, J.-R, R.D. Pope and H. Leathers (1988), "Competitive industry equilibrium under uncertainty and free entry", Economic Inquiry 26:331-344. Cochrane, W.W. (1958), Farm Prices: Myth and Reality (University of Minnesota Press, Minneapolis). Cotterill, R.W. (1997), "The food distribution system of the future: Convergence toward the US or UK model?", Agribusiness 13:123-135. Craig, B.J., RG. Pardey and J. Roseboom (1997), "International productivity patterns: Accounting for input quality, infrastructure and research", American Journal of Agricultural Economics 79:1064-1076. De Janvry, A. (1981), The Agrarian Question and Reformism in Latin America (Johns Hopkins University Press, Baltimore). De Janvry, A., M. Fafchamps and E. Sadoulet (1991), "Peasant household behavior with missing markets: Some paradoxes explained", Economic Journal 101:1400-1417. Dixit, A.K. (1989), "Entry and exit decisions under uncertainty", Journal of Political Economy 97:620-637. Dixit, A.K., and R.S. Pindyck (1994), Investment under Uncertainty (Princeton University Press, Princeton). Eswaran, M., and A. Kotwal (1986), "Access to capital and agrarian production organization", Economic Journal 96:482-498. Fernnandez-Cornejo, J., C.M. Gempesaw II, J.G. Elterich and S.E. Stefanou (1992), "Dynamic measures of scope and scale economies: An application to German agriculture", American Journal of Agricultural Economics 74:329-342. Frisvold, G., K. Fuglie and C. Klotz-Ingram (1998), "Growth of private agricultural research", Choices, Second Quarter. Gale, H.E (1993), "Why did the number of young farm entrants decline?", American Journal of Agricultural Economics 75:138-146. Garcia, R., S.T. Sonka and M.S. Yoo (1982), "Farm size, tenure, and economic efficiency in a sample of Illinois grain farms", American Journal of Agricultural Economics 64:119-123. Gardner, B.D., and R.D. Pope (1978), "How is scale and sa'ucture determined in agriculture?", American Journal of Agricultural Economics 60:295-302.
284
J.-P. Chavas
Goetz, S.J. (1992), "A selectivity model of household food marketing behavior in sub-Saharan Africa", American Journal of Agricultural Economics 74:444-452. Goetz, S.J., and D.L. Debertiu (1996), "Rural population decline in the 1980s: Impacts of farm structure and federal farm programs", American Journal of Agricultural Economics 78:517-529. Griliches, Z. (1957), "Hybrid corn: An exploration in the economics of technical change", Econometrica 25:501-522. Griliches, Z. (1960), "Research costs and social returns: Hybrid corn and related innovations", Journal of Political Economy 42:1411-1427. Hall, B.E, and E.E Leveen (1978), "Farm size and economic efficiency: The case of California", American Journal of Agricultural Economics 60:589400. Hayami, Y., and V.W. Ruttan (1985), Agricultural Development: An International Perspective (Johns Hopkins University Press, Baltimore). Hearn, D.H., K.T. McNamara and L. Gunter (1996), "Local economic structure and off-farm labour earning of farm operators and spouses", Journal of Agricultural Economics 47:28-36. Huang, S.-Y., and R.J. Sexton (1996), "Measuring returns to an innovation in an imperfectly competitive market: Application to mechanical harvesting of processing tomatoes in Taiwan", American Journal of Agricultural Economics 78:558-571. Huffman, W.E., and R.E. Evenson (1993), Science for Agriculture: A Long Term Perspective (Iowa State University Press, Ames, IA). Innes, R.D., and G.C. Rausser (1989), "Incomplete markets and government agricultural policy", American Journal of Agricultural Policy 71:915-931. Johnson, G.L., and L.C. Quance (1972), The Overproduction Trap in U.S. Agriculture (Johns Hopkins University Press, Baltimore). Jorgenson, D.W., and EM. Gollop (1992), "Productivity growth in U.S. agriculture: A postwar perspective", American Journal of Agricultural Economics 74:745-750. Kalirajan, K. (1981), "The economic efficiency of farmers growing high-yielding, irrigated rice in India", American Journal of Agricultural Economics 63:566-570. Kislev, Y., and W. Peterson (1996), "Economies of scale in agriculture: a reexamination of the evidence", in: J.M. Antle and D.A. Sumner, eds., Papers in Honor of D. Gale Johnson (University of Chicago Press, Chicago). Lasley, EA., H.B. Jones Jr., E.H. Easterking and L.A. Christensen (1988), "The U.S. broiler industry", ERS Agr. Econ. Rep. No. 591 (USDA, Washington, DC). Lerman, Z. (1999), "Land reform and farm restructuring: What has been accomplished to date?", American Economic Review 89:271-275. Lianos, T.E, and D. Parliarou (1986), "Farm size smacture in Greek agriculture", European Review of Agricultural Economics 13:233-248. Lin, W., G.W. Dean and C.V. Moore (1974), "An empirical test of utility vs. profit maximization in agriculture production", American Journal of Agricultural Economics 56:497-508. Lopez, R.E. (1984), "Estimating labor supply and production decisions of self-employed farm producers", European Economic Review 24:61-82. Lowenberg, D.J., and M. Boehlje (1986), "The impact of farmland price changes on farm size and financial structure", American Journal of Agricultural Economics 68:838-848. Marion, B.W. (1986), The Organization and Performance of the U.S. Food System (Lexington Books, Lexington, MA). Matulich, S.C. (1978), "Efficiencies in large-scale dairying: Incentives for further structural change", American Journal of Agricultural Economics 60:642~546. McCorriston, S., C.W. Morgan and A.J. Rayner (1998), "Processing technology, market power and price transmission", Journal of Agricultural Economics 49:185-201. Newbery, D.M.G., and J.E. Stiglitz (1981), The Theory of Commodity Price Stabilization: A Study in the Economics of Risk (Clarendon Press, Oxford). OECD (1995), Technological Change and Structural Adjustments in OECD Agriculture, Paris.
Ch. 5:
Structural Change in Agricultural Production
285
Pardey, RG., J. Roseboom and J.R. Anderson (1991), Agricultural Research Policy (Cambridge University Press, New York). Pratt, J. (1964), "Risk aversion in the small and in the large", Econometrica 32:122-136. Rao, V., and T. Chotigeat (1981), "The inverse relationship between size of land holding and agricultural productivity", American Journal of Agricultural Economics 63:571-574. Schmitz, A., and D. Seckler (1970), "Mechanized agriculture and social welfare: The case of the tomato harvester", American Journal of Agricultural Economics 52:569-577. Schultz, T.W. (1945), Agriculture in an Unstable Economy (McGraw-Hill, New York). Sexton, R.J. (1986), "The formation of cooperatives: A game-theoretic approach with implications for cooperative finance, decision making and stability", American Journal of Agricultural Economics 68:214-225. Shiha, A., and J.-E Chavas (1995), "Capital market segmentation and U.S. farm real estate pricing", American Journal of Agricultural Economics 77:397-407. Singh, I., L. Squire and J. Strauss (1986), Agricultural Household Models: Extensions, Applications and Policy (Johns Hopkins University Press, Baltimore). Sumner, D.A. (1990), "Targeting and the distribution of program benefits", in: K. Allen, ed., Agricultural Policy in a New Decade (Resources for the Future, Washington, DC). Sumner, D.A., and J.D. Leiby (1987), "An econometric analysis of the effects of human capital on size and growth among dairy farms", American Journal of Agricultural Economics 9:465-470. Strauss, J. (1986), "Does better nutrition raise farm productivity?", Journal of Political Economy 94:297-320. Vasavada, U., and R.G. Chambers (1986), "Investment in U.S. agriculture", American Journal of Agricultural Economics 68:950-960. Weiss, C.R. (1998), "Size, growth and survival in the Upper Austrian farm sector", Small Business Economics 10:305-312. Yotoponlos, EA., and L.J. Lau (1973), "A test of relative economic efficiency: Some further results", American Economic Review 63:214-223.
Chapter 6
LAND INSTITUTIONS AND LAND MARKETS KLAUS DEININGER and GERSHON FEDER
World Bank, Washington, DC
Contents
Abstract 1. Introduction 2. Property rights in land 2.1. The emergence of land rights 2.2. Benefits and costs of individualized property rights 2.2.1. Benefits from individual land rights 2.2.2. Tenure security 2.2.3. Transferability 2.2.4. Credit access 2.2.5. Costs
3. Land markets: Functioning and efficiency implications 3.1. Key determinants of land market participation 3.1.1. Economies of scale 3.1.2. Labor supervision cost 3.1.3. Credit market access 3.1.4. Portfolio composition 3.1.5. Transaction costs 3.2. Land sales markets 3.3. Land rental markets
4. Policy issues 4.1. Clarification and adjudication of property rights 4.2. Improving the functioning of land sales and rental markets 4.3. Redistributive land reform
5. Conclusion: Areas for further research 5.1. Security of land rights 5.2. Improving the functioning of land markets 5.3. Land redistribution
References
Handbook of Agricultural Economics, Volume 1, Edited by B. Gardner and G. Rausser © 2001 Elsevier Science B.V. All rights reserved
288 289 290 290 295 295 296 298 299 300 302 303 304 304 305 306 307 307 309 313 314 316 318 321 321 322 323 324
288
K. Deininger and G. Feder
Abstract
Assignment of land rights affects equity and efficiency, determining among other things households' ability to generate subsistence and income, their social and economic status, incentives to exert effort and make investments, and access to financial markets and consumption-smoothing mechanisms. The chapter discusses costs and benefits of the transition towards individualized land rights. It reviews how characteristics of the agricultural production process, credit access, portfolio risk, and transaction costs affect functioning of land sales and rental markets. Policy conclusions are drawn concerning the transition from communal to individualized land rights, award of formal titles, improved functioning of land sales and rental markets, and redistributive land reform. J E L classification: Q15
Ch. 6:
Land Institutions and Land Markets
289
1. Introduction In agrarian societies land is not only the main means for generating a livelihood but often also for accumulating wealth and transferring it between generations. The way in which land rights are assigned therefore determines households' ability to produce their subsistence and generate marketable surplus, their social and economic status (and in many cases their collective identity), their incentive to exert non-observable effort and make investments, and in many cases also their ability to access financial markets or to arrange for smoothing of consumption and income. Given this context, markets to exchange rights to land temporarily or permanently can provide a low-cost means to effect transactions that would bring this factor of production to its most productive use. The institutions governing the functioning of land markets will affect the transaction cost associated with such exchanges, the magnitude and distribution of the benefits generated by them, and the incentives for rational economic agents to undertake efficiency-enhancing transfers and land-improving investments. Furthermore, since land is one of the best collateral assets available, clear property rights and greater ease of their exchange are likely to affect the emergence and efficiency of financial markets. This implies that land markets have an essential role in the broader process of economic development. In this chapter we first examine the way in which property rights in land evolve in an ideal and undistorted environment. We view the emergence of land rights as an endogenous response to increased scarcity of land and the associated incentives for land-related investment, and then discuss other factors - such as further increases in population density, better access to markets, or the introduction of improved technology to exploit the land - that would lead to increased productivity of agricultural cultivation, as well as endogenous technical change. We note that, historically, there have been few cases where such an uninterrupted evolution has been followed. We then briefly sketch the conditions required for as well as the deviations from this ideal path. With this in mind, we discuss factors affecting the costs and benefits of individualized land rights and examine empirical evidence for their magnitude. The implications of tenure security for investment incentives are highlighted. Having clarified the concept of property rights in land, we turn to land sales and rental markets. We consider the main factors affecting participation in those markets, in particular characteristics of the agricultural production process, labor supervision cost, credit access, the risk characteristics of an individual's asset portfolio, and the transaction costs associated with market participation. These factors will affect land sales and rental markets differently; in particular, even if owner-operated farms are more productive than wage-labor-operated ones, the sales market will not necessarily shift land to them. This implies that, in environments where financial markets are imperfect, land market operation needs to be considered within a broader perspective focusing on access to other markets and the availability of alternative assets. We note that, in general, land rental markets would be less affected by these problems because renting out does not preclude the landlord from utilizing land as a collateral to access credit which could then
290
K. Deininger and G. Feder
be passed on to the tenant in an interlinked contract. Removing obstacles - often government regulations or imperfections in other markets - that prevent smooth functioning of land rental markets and taking measures that enhance potential tenants' endowments and bargaining power can considerably increase both the welfare of the poor and overall efficiency of resource allocation. There are also many instances where sales markets are regulated in a manner which hampers incentives for socially optimal behavior. In addition to reducing tenure insecurity, governments can in these situations improve the efficiency of resource use by avoiding interventions limiting rental and sales markets. Finally, in a number of countries, a highly unequal land ownership distribution implies inefficient and inequitable resource use which the land sales or rental markets are not able to smoothly transform into a more efficient and equitable allocation. Based on these issues we draw policy conclusions concerning the transition from communal to individualized land rights and the award of titles, steps that might be used to improve the functioning of land sales and rental markets, and the scope for redistributive land reform.
2. Property rights in land 2.1. The emergence o f land rights
The process of gradual individualization of property rights in land can be conceived as an induced institutional response to higher shadow prices of land to encourage longerterm investments in land, as in the pioneering analysis by Boserup.1 At the earliest stages of development, even before the establishment of sedentary agriculture, tribes of hunters and gatherers assert control over certain locations where they collect food and engage in hunting. As population density increases, forest fallow systems, and then communal property right systems emerge. Under these arrangements, the general right to cultivation of a piece of land is an inseparable and in principle inalienable element of tribal membership. Cultivation rights are assigned to individuals on a temporary basis, normally as long as the cleared plot is cultivated. Once cultivation has ended (due to exhaustion of soil fertility), the plot falls back to the lineage and the family either selects a new plot (if land is abundant) or has a plot allocated by the chief of the tribe. Tile fact that land is held by the community or lineage rather than the individual facilitates periodic redistribution of at least part of the land among community members based on population growth, serving as a social safety net and preventing the emergence of a class of permanently landless individuals. Tenure security in a general sense is very high, i.e., individual members enjoy secure and inheritable general rights to cultivatable land which can be reactivated even after a period of absence. l It is well understood that this idealized process has rarely been followedin actual history (Boserup herself devotes more than one chapter to the issue of coercion and the description of feudal systems). It is, nonetheless, useful to illustrate the main underlyingfactors.
Ch. 6:
Land Institutions and Land Markets
291
As the relative scarcity of land increases, the pledging or intra-community rental of land emerges. This practice, whereby land that is not used can temporarily be pledged to another family, with the stipulation that it has to be returned upon request, facilitates the productive use of land in case the original owner is unable to undertake cultivation. It is distinctly different from permanent land transactions and is generally not allowed to involve people from outside the community. 2 It also does not uniformly apply to all land - unimproved land lying fallow at any given time continues to be at the free disposal of the community, for example, for grazing by domestic animals owned by any family with cultivation rights. Variations of such communal tenure systems, where parcels are re-allocated from time to time in order to accommodate population growth and grazing land is left for communal use, are common in many parts of the developing world, such as China, large parts of Africa, and Mexico. What are the factors driving this process of successively increasing precision in the definition of property rights to land? The most frequent explanation is that a virtuous cycle of technical change and investment is set in motion by a combination of increasing population density, technical progress, commercial integration, and reduction of risk. Boserup was the first to point out the fact that, historically, higher population density was the driving force behind an endogenous process of better definition and enforcement of property rights, changing arrangements for the organization of production, and higher levels of investment. The Boserupian framework of changes in the relative scarcity of land and the associated introduction of labor-saving technology can, for example, explain systematic changes in the strength of women's land rights [Platteau (1996)]. Under land abundance and predominance of shifting cultivation, agriculture tends to be female-dominated, polygyny is widespread, and women enjoy high status as workers as well as childbearers. Marriage is accompanied by the transfer of bridewealth to the bride's family and, in case of the husband's death, women retain land rights either in their native or in their new village. With increased land scarcity and adoption of the plough, the importance of women in agricultural production tends to decline and bridewealth, as well as other customary safeguards to protect widowed and isolated women, disappears. Instead, women receive, upon marriage, pre-mortem inheritance, which - if it remains the property of the wife - establishes a tba'eat point in intra-household bargaining and provides economic security in the case of divorce or death of the husband. The diffusion of exogenous technical change and/or expansion of trade generally has an investment-increasing effect similar to the one caused by increased population density. By increasing the stream of incomes that can be derived from a unit of land, technical change and trade expansion increase incentives for better definition of property rights in land. Indeed, establishment of tree crops, and the associated heavy investment
2 Indeed, the distinguishing characteristic of communal tenure systems is not a lack of general tenure security but the fact that property rights are not permanently linked to a specific plot, implying the existence of restrictions on the transferability of land fights (especially to individuals who are not members of the community).
292
K. Deininger and G. Feder
in clearing and leveling of land, was generally undertaken only where institutional innovations had enhanced tenure security adequately so that individuals could be sure to reap the benefits from such investments. Similarly, the transportation revolution caused by the steamship in the late nineteenth century led not only to the incorporation of hitherto unexplored countries and states into global trade but also increased the demand for individualized ownership of land. For example the opening of Thailand to international rice trade through the Bowering treaty of 1826 induced a quantum increase in the demand for rice land in the Thailand plains, and brought about the introduction of a formal land registration system [Feeney (1988)]. Another important factor furthering the evolution of individual property rights to land is the reduction of risk to income and consumption. The three major avenues for this to come about are (i) the development of markets for output, capital, and insurance, (ii) technical progress that allows for diversification, reduction of the covariance of yields, and the probability of crop failure, and (iii) the emergence of access to noncovariate streams of off-farm income. It has long been noted that group ownership of land (or joint communal production) can be viewed as an "insurance policy" to eliminate the threat of permanent asset loss or to reduce vulnerability to idiosyncratic consumption shocks. However, the scope for using communal land ownership to insure against non-idiosyncratic shocks is limited by the weather-induced covariance of agricultural production. Especially when collective production on arable land is required to obtain these benefits, 3 households prefer individual ownership once alternative and less costly mechanisms to insure against covariate risks become available [see Key et al. (1998), for the case of Mexican farming communities] .4 Because monitoring of effort in agricultural production is difficult and costly, collectives where individuals are not residual claimants to profits are highly inefficient forms of agricultural production [Deininger (1995)]. However, contrary to widespread misconceptions, communal tenure systems are generally n o t based on collective production. Instead, production on arable plots is normally undertaken by individuals who are residual claimants to output, implying that, on arable plots, incentives for effort supply by individual cultivators are likely to be appropriate. Inefficiencies may persist with regard to decisions concerning the use of communal areas such as forests and pasture, or the disincentive to invest, derived from the inability to claim ownership rights to specific plots. In an analysis of Mexican farming communities (@dos), McCarthy et al. (1998) provide empirical evidence for the existence of collective action problems regarding the use of pasture and forest, but not of individually managed plots.
3 Groupownershiphas often been prevalent where risk is high and where factors such as remoteness, environmental hazard, or presence of external enemies imply that superior insurance mechanisms are not available [Ellickson (1993)]. 4 The potential usefulness of communalland ownershipas a device for consumption-smoothingis inversely related to the incidence of locally covariate climatic shocks. It is thus not surprising that, at comparablelevels of population density, communaltenure systems have provento be more durable in environments where such risks are lower.
Ch. 6:
Land Institutions and Land Markets
293
Communal resource ownership is often motivated by the ability to provide benefits in the form of easier provision of public goods, arrangements to enhance equity, or the ability to take advantage of synergies that would be difficult to realize under fully individualized ownership. Examples include risk reduction through diversification in highly variable environments [Nugent and Sanchez (1993)], the utilization of economies of scale to break seasonal labor bottlenecks [Mearns (1996)], and investment in community-level infrastructure [Boserup (1965), Dong (1996)]. 5 As long as effective means of governance and accountable institutions at the local level are available, these systems can be very effective - especially in situations where there is need for community-level investment. For example, under the medieval open field system, cultivation decisions were made collectively but monitoring-sensitive tasks were carried out on an individual basis. This allowed utilizing economies of scale in fencing, harvesting, shepherding, and risk diversification through strip-cropping without compromising the advantages of individual effort supply [McCloskey (1975, 1991), Townsend (1993), Blarel et al. (1992)]. The usufructuary rights given under communal tenure systems do not impose large losses as long as population density is low and land relatively abundant, payoffs for making long-term investments is low, and definition of individual property rights in land is costly. However, even though individuals have the right to cultivate specific plots (a measure that avoids the efficiency losses due to collective production), the lack of permanent rights that is implied by the periodic redistribution of plots may decrease incentives to make long-term land-related investments under communal arrangements. A similar effect comes through the limitation of land transfers to members of the community and the inability to utilize land as a collateral for credit. Improved access to markets, infrastructure, and financial intermediation are alternative ways to provide the benefits - in terms of insurance, diversification, and access to funds for investment- associated with communal forms of land ownership. At the same time these exogenous factors increase the costs - in terms of investment disincentives and foregone land transactions with outsiders - associated with traditional land ownership systems. This implies that, with economic development, the relative attractiveness of communal systems will decrease and, at some point, it would be economically rational for a community to allocate permanent and fully tradable ownership rights to individuals [see Wilson and Thompson (1993) for Mexico], completing the transition from a communal to an individualized tenure system. However, instead of following a smooth evolution along the lines outlined above, the transition to individual property rights historically has in the large majority of cases been affected by exogenous interventions. As population growth increases the relative
5 An interesting case to illustrate this is made by Ellickson (1993) who compares different settlements (Jamestown, Plymouth, Salt Lake City, and the Bermudas) to suggest that, while many frontier settlements started out with group ownership and production to utilize economies of scale in defense and other activities, the length of time during which group ownership is maintained can be related to the riskiness of the environment, the frequency of social interaction, and the hierarchy structure of decision-making.
294
K. Deininger and G. Feder
scarcity of land, one observes a general increase in boundary conflicts and social tension. 6 In the absence of strong and representative community-level institutions, this often leads to appropriation of property rights to the communal resources by powerful individuals, and abuses of power and land-grabbing by local chiefs and headmen. 7 These phenomena are often seen as a major cause of environmental degradation and increased social tension and inequality that leaves out the poor and vulnerable. History demonstrates that regions with potential for agricultural or non-agricultural exports were generally characterized by the appropriation of large tracts of land through imperialist, colonial, or other overlords who either replaced local chiefs and elders, or tried to co-opt them to enforce their rule. These changes undermined traditional tenure systems, the associated structures of accountability, and thus the institutional underpinning of the organic evolution of such systems [Downs and Reyna (1993), Feder and Noronha (1987)].s Furthermore, once they realized that access to labor rather than land was the most limiting factor, overlords generally introduced distortions in other markets to reduce the reservation utility of independent farmers and to assure a supply of labor for export production in mines or for the newly established estates. In addition to reducing the reservation utility that cultivators could obtain from independent cultivation, such restrictions have contributed to widespread rural poverty and retarded development of competitive markets in rural areas, often laying the basis for continued rural-urban dualism. In more recent times, governments have, through implicit and explicit taxation, drained the rural sector of resources that could have fueled a process of increased market integration and technology development, while at the same time higher rates of population growth vastly increased the need for new technology and better infrastructure [Schiff and Vald6s (1995)]. The associated lack of markets and technological opportunities has, in a number of cases, contributed to a situation akin to the "involution" that had earlier been diagnosed for Asian systems [Geertz (1968)], with far-reaching implications for the structure of resource ownership rights. For example in Rwanda, with very high population density (787 persons per kin2), traditional systems of land allocation have become defunct and fail to provide even the most basic services they were designed for [Andre and Platteau (1996)]. As traditional limitations on land sales have been discarded, speculative land purchases by individuals with access to non-covariate
6 Zimmerman and Carter (1996a, 1996b) show that incorporating agent heterogeneity,risk, and subsistence constraints can facilitate a more differentiatedassessment of the welfare impact and productivity impact of a given institutional innovation (e.g., the adoption of marketable land rights) on different groups of producers. 7 For example, despite extremely low levels of population density in Zambia, almost 50 percent of small producers feel that their security of tenure is insufficient and are willing to pay (a mean amount of US $ 40) for getting secure ownership rights [Deininger et al. (1998)]. Low-cost means of increasing tenure security and reducing encroachmentfrom outside throughbetter accountabilityand issuance of communitytitles could possibly increase welfare and tenure security. 8 This was independent of whether the intervention was associated with the elimination of traditional tenure systems in favor of individualizedrights to the selected group, as in many parts of Central and Latin America, or the use of local chiefs and dignitaries as intermediariesfor the central power, as in African countries.
Ch. 6: Land Institutions and Land Markets
295
off-farm income lead to a rapid disequalization of landholdings. 9 While costly land disputes consume productive energy, environmental degradation continues unabated and the return to an idealized notion of "communal property rights" is unlikely to be a feasible option. To judge, however, what alternative arrangements would be feasible, it is necessary to consider in more detail the costs and benefits associated with different tenurial arrangements. Drawing together the evidence on costs and benefits associated with more secure and fuller property rights arrangements, three conclusions emerge. First, where population density is sufficiently high, increased tenure security - not necessarily equivalent to formal title - has an important impact on increased investment. Second, there is some evidence that a higher degree of transfer rights provides additional incentives for investments and for more efficient use of family labor. Finally, the ability to use land as collateral to increase access to medium- and long-term formal credit markets is of importance if foreclosure is feasible. Studies that compared the financial costs and economic benefits of titling programs suggest that high rates of return are possible but that, unless measures to reduce the transaction costs associated with administering credit to smallholders are undertaken, the benefits associated with titles may not accrue equally to all types of farmers.
2.2. Benefits and costs o f individualized property rights The main benefits from well-defined and secure individual property rights relate to (i) greater incentives for (and lower costs of) long-term resource conservation and the associated increased demand for investment; (ii) improving transferability (temporary or permanent) of land to cultivators who have the resources to make better use of it an issue that depends on the presence of economies of scale and the disincentives to rental; and (iii) the ability to use land as collateral in formal credit markets, a benefit that is more significant where formal title exists and land transactions are actually feasible. These benefits need to be weighed against two main types of costs: the administrative and logistical expense associated with definition of boundaries, enforcement of rights, and resolution of disputes among claimants, and the increased risk of losing a safety net provided by communal control of land.
2.2.1. Benefits from individual land rights Improved tenure security brought about by individualized land rights will be associated with static and dynamic benefits. Even without having full long-term security of tenure, individual cultivation rights that entitle an individual to residual claimancy of profits
9 It is of interest to note that about 65 percent of sales are classifiedas distress sales - the incidence of which is not restricted to the lowest landholding group - and an additional 17 percent of lands are sold to cover litigation expenses, often arising from land disputes.
296
K. Deininger and G. Feder
generated on a plot mark the difference between collective and private forms of cultivation. The transition from collective to private cultivation has historically been associated with large increases in productivity, as for example in the case of China [McMillan et al. (1989), Lin (1992), Lin et al. (1994)]. However, equally important benefits from betterdefined long-term property rights would come about in an intertemporal setting where higher security of tenure would increase the incentives for long-term investments, the incidence of productivity-enhancing transfers, and the supply of credit to make such investments. These aspects are elaborated upon below. 2.2.2. Tenure security
Conceptually, insecurity associated with the lack of well-defined property rights can be understood as a random probability of loss of future income due to conflicting challenges. Eliminating such a threat through informal institutions (customary tenure) or formal institutions (land titles) will clearly increase the subjective payoff from productivity-enhancing, long-term investments, and thus the owner's willingness to undertake them. While the theoretical expectation is straightforward and easily formalized [see, for example, Feder et al. (1986), Besley (1995)], the critical question, and much empirical debate, has focused on the magnitudes of such effects in different settings. The analysis of different types of land rights in Africa is complicated by the need to take into account the potential endogeneity of investment [Besley (1995)]. The reason is that there may be certain types of investments - from marking of boundaries to planting of trees and hedges, and building of houses or sheds - that may be undertaken with the primary purpose of establishing implicit property rights to land rather than of increasing productivity [Brasselle et al. (1997)]. Depending on how such actions affect the probability of land loss and whether or not there are community rules to provide (partial) compensation for such investments when a plot reverts to the community, it is easy to construct scenarios where communal tenure systems may increase rather than decrease the amount of land-related investment undertaken [Sjaastad and Bromley ( 1997 )]. 10 The key result from a number of studies that have investigated the investmentenhancing effect of tenure security is that, under formal as well as informal regimes, tenure security - as measured by the extent of rights possessed by the owner - significantly affects farmers' investment decisions. Especially where investments are laborintensive but involve few cash outlays, the unambiguous conclusion is that higher levels
10 Using comparative statics from a simple model it can be shownthat communal as compared to individual tenure is more desirable from the individual's point of view as the discount rate increases; the productivity increase generated by investment is smaller compared to rent; the initial probability of eviction is low; and the probability of recovering investment even after eviction is high. A combination of these factors may cause individuals under indigenous tenure to commitresources to land improvementbeyondwhat wouldbe the case under individual resource ownership.
Ch. 6:
Land Institutions and Land Markets
297
of tenure security - even if they are not associated with high levels of transferability and are defined only at an informal level - do indeed provide an important incentive for increased investment. 11 Evidence from one of three study areas in Ghana indicates that greater tenure security at the plot level significantly increases the probability that individuals will plant trees and undertake a wide range of other investments such as draining, irrigating, and mulching [Besley (1995)]. The fact that field-specific rights but not mean household rights can be shown to be significant suggests that plot-level tenure security, rather than credit supply effects accruing to the household as a whole, is likely to be at the root of this relationship between tenure security and investment. Results from China confirm the importance of tenure security for investment. Comparing plots planted with the same crop within the same household but under different tenure regimes, it is found that farmers tend to apply more manure and labor, and to obtain significantly higher yields, on plots that are privately owned and therefore more secure [Rozelle et al. (1996)]. This is the case even though the possible impact of greater tenure security on crop choice (e.g., shifting to orchards instead of growing maize) is not accounted for. Similarly, Yao (1996) finds that higher levels of tenure security in Chinese villages have a strong and very significant investment-enhancing impact (e.g., application of green manure). 12 Analysis of the impact of higher tenure security through land titling in the Brazilian A m a z o n yields similar results [Alston et al. (1995, 1996)] and there is considerable amount of more anecdotal evidence on a positive association between availability of title and farm output or investment [see Binswanger et al. (1995) for references]. On the other hand, in Niger, a more land-abundant setting, different degrees of tenure security between plots with full private ownership and plots held under usufruct do not give rise to statistically significant differences in application of manure, a medium-term yield-improving investment [Gavian and Fafchamps (1996)]. In this context, farmers apply significantly lower amounts of manure on rented as compared to owned plots, but there is no significant difference between parcels held under full private ownership and those held under "traditional" usufruct. The conclusion is that apparently tenure security on the latter is high enough for farmers to expect to be able to reap the benefits from their (medium-term) investment. At a more general level, it indicates that, in order to determine whether specific property rights arrangements are conducive to higher levels
11 This does not necessarily imply that actions to increase tenure security are warranted or even needed [Plattean (1996)]. 12 At first glance this would seem to be at variance with the findingby Feder et al. (1992) where, for a similar sample from four Chinese provinces, neither short-term nor long-term tenure security (captured by farmers' perception about the possibility that their land may be reallocated before the expiration of the current 15-year contract) had any perceivableimpact on investment. One can reconcile the two findingsby noting that Feder et al.'s study considers non-attached investment (machinery,livestock, and construction) which should be made independently of individual plots' tenure security and affected more by access to working capital (which indeed emerged as an important determinant of investment).
298
K. Deininger and G. Feder
of investment, more detailed study is necessary and generalizations are unlikely to be helpful. What is instead required is a more differentiated judgment that takes account of the time horizon of the investment, the opportunity cost of the resources used, and the size and distribution over time of the expected payoff associated with the investment. 2.2.3. Transferability
Land markets tend to be highly localized. As a consequence, the ability to transfer land between users may be of limited importance in early stages of development when there is little heterogeneity of skills across the population and non-agricultural opportunities are limited. However, the importance and value of being able to transfer use or ownership rights to land increase with economic development, specialization, and better development of other markets. In this case, the transfer of land from those who have lower productivity to those who are able to make more productive use of the land improves the overall resource allocation. The demand for such exchanges increases further as the rural economy becomes more integrated geographically, facilitating transactions between individuals who are not members of the same community. Such situations generally involve larger problems of asymmetric information and greater benefits from more formal systems of land ownership recording. If the ability to liquidate investments (through land transfers) increases the incentive to undertake such investments, higher levels of transfer rights, and the greater ability to affect transfers which is entailed in formal land rights systems, will not only improve resource allocation but will also be associated with higher levels of investment and labor use by individual cultivators. The only data that allow testing of this hypothesis come from China, where one observes variability in systems of transfer rights in different communities [Carter and Yao (1998)]. Results suggest that higher levels of transfer rights increase investment (e.g., application of green manure). In addition, evidence from China indicates that higher levels of transfer fights also induce a better allocation of the household's labor endowments in response to, for example, outside employment opportunities. Households with higher levels of transfer rights apply less labor on their farm and devote more time to more remunerative off-farm activities [Yao (1996)], thereby contributing to equalization of factor ratios within a village and increasing overall efficiency. More indirect support for an important efficiency-increasing (but not investment-enhancing) impact of higher transfer rights is provided by Rozelle et al. (1996), who find that an increase in off-farm opportunities narrowed the difference between labor spent on (transferable) private and (non-transferable) communal plots. 13
13 Evidence is not uniform: for Ghana, the hypothesis that sales and rental rights do not have a significant impact on investment decisions can not be rejected [Besley (1995)]. This suggests that the prospect of being able to transfer land more easily through sales and rental markets in the future is, in this environment,not an important consideration in individuals' decision to effect land-related investment.
Ch. 6:
Land Institutions and Land Markets
299
2.2.4. C r e d i t a c c e s s
In addition to inducing investment, secure land ownership is likely to increase the supply of credit from the formal credit system to undertake such investment. The reason is that, because of its immobility and virtual indestructibility, land with secure, clearly defined, and easily transferable ownership rights is an ideal collateral. The provision of a collateral - facilitated by possession of formal land title - is generally a necessary condition for participation in formal credit markets for medium- and long-term credit. In fact, there is evidence of titles facilitating access to informal (but impersonal) credit markets as well [Siamwalla et al. (1990)]. Existence of well-documented and transferable property rights and of institutional arrangements to facilitate the low-cost transfer of land is likely to make an important contribution to the development of financial markets. However, while use of titled land as collateral can, under the condition that foreclosure is feasible, reduce a bank's default risk and thereby enhance credit supply, it will have little impact on the transaction costs associated with administering credit to small producers in rural areas. In environments where these costs are high, the improved creditworthiness brought about by possession of land title may therefore not be enough to facilitate access to formal credit by small farmers. Unless complementary measures to reduce transaction costs and ensure access to credit by this group are undertaken alongside with individualized property rights through titling, the benefits from titling programs m a y accrue only to medium and large landowners. The importance of the credit supply effect associated with provision of land title is supported by evidence from Feder et al.'s (1986) study in Thailand, where farmers' opinions and econometric evidence point towards improved credit supply as the main benefit from titling. Land ownership titles induced higher investment in farming capital (attached investments and other capital); 14 titled land had significantly higher market values and higher productivity per unit. In three of the four provinces covered, households' credit supply had been significantly enhanced by the availability of title. By contrast, and in line with the above, title was found to have little impact on either investment or farm income where formal credit markets were not available [Atwood (1990), Carter and Wiebe (1990), Migot-Adholla et al. (1991), Pinckney and Kimuyu (1994)]. 15 Additional evidence from a study based on panel data from Paraguay indicates that titling had a positive income or productivity-enhancing effect through credit market benefits for at least some groups of farmers. Due to a strong impact of formal title on both
14 Problems of endogeneity and self-selection are circumvented by drawing samples from squatter villages in areas nominally under public ownership (where titles could not be awarded) and private areas where all residents already had obtained titles. 15 Pender and Kerr (1996) show that for India land ownership has little impact on credit supply, a fact that is attributed to severe non-price rationing. Nonetheless, land values for titled land are on average about 15 percent higher than for untitled land, suggesting that possession of formal title reduces the probability of land loss for potential buyers.
300
K. Deininger and G. Feder
credit supply and investment demand, the benefits from title are relatively large (about 10 percent of farm income), and significantly higher than the cost of titling. However, the impact of awarding titles was strongly size-differentiated. Estimates indicate that producers with fewer than 20 hectares remained rationed out of the credit market and therefore did not benefit at all from the credit-supply effect of title [Carter and Olinto (1996)]. This differential impact suggests that, in environments where other markets (such as credit markets) entail distortions which put smaller and poorer farmers at a disadvantage, individual property rights on equity, and - in the medium to longer term - on the direction and nature of land transfers between different size classes of producers, could imply greater inequity. Whether, in the presence of heterogeneity in endowments, small producers will benefit from such policies depends critically on the ability to reduce, together with titling, transaction costs and policy-induced distortions that limit access to credit markets. 2.2.5. Costs
The most obvious cost associated with formal definition of property rights in land is the expenditure needed to physically demarcate and delineate plots, to establish and maintain accurate records of land ownership, and to enforce these rights and resolve whatever disputes might arise. 16 These costs are borne by individual land owners in situations (for example, frontier settlement) where public enforcement of property rights is absent and individuals make defensive investments such as guards, fences, and other demarcation devices to demonstrate the legitimacy of their claims to property and to defend such rights against possible intruders [Mueller (1997)]. It has been shown that the privately "optimal" amount of spending by individuals on means of protection will be inefficient from a social point of view [Feder and Feeney (1991), De Meza and Gould (1992)]. Furthermore, the defensive activities undertaken often have little social value and may generate negative externalities, an issue that has been emphasized with respect to the Brazilian Amazon where the need to demonstrate "productive" land use to establish ownership claims has been linked to increased deforestation [Binswanger and Elgin (1988), Southgate et al. (1991)]. Even where they are not associated with externalities, defensive activities that are often undertaken in speculative attempts to secure "ownership" of large tracts of land can lead to complete dissipation of the rents to be had ]Allen (1991)]. 17 Given the undesirable impacts of private rights enforcement, public provision - in the form of land records, police, and a judiciary - would therefore be preferable in all
16 Note that the number of disputes is itself endogenous, depending on the type of property rights system chosen. 17 Spontaneouscollectiveaction to limit the dissipation of resource rents associated with individualized defense of property rights has been observed in a number of cases where group sizes were small [Umbeck (1977)].
Ch. 6:
Land Institutions and Land Markets
301
situations except ones characterized by very low levels of population density [Malik and Schwab (1991)]. This is indeed observed throughout human history. The specific form in which land records are established will still depend on the relative costs and benefits from such an activity - something that depends partially on the technology and infrastructure available for record keeping. 18 At initial stages of human development, assignments of property rights appear to have been handled orally by the community (with community functionaries holding public sessions at the gate, for example). However, the benefits from keeping written records seem to have been so great that, across a large number of cultures, officially validated land records were among the first documents to appear once a written language was developed. In addition to establishing unambiguous ownership rights, written records allow verification of ownership status of land at low cost, thus reducing the scope for asymmetric information about ownership and quality of land, and making land sales and rentals cheaper to implement. 19 This reduction of transaction costs increases the liquidity of the land market and can bring the number of efficiency-enhancing transactions closer to the optimum, i.e., helping to transfer more land from less productive to more productive individuals. A second type of social cost associated with fully individualized property rights relates to the fact that, at low levels of development, communal land ownership may perform an important insurance function that would be eliminated by establishing fully individualized property rights in land. 2° Furthermore, it has long been known that in cases where other markets are highly incomplete, land sales markets may not automatically transfer land to more productive users. In such situations, individualizationof land rights could be doubly disadvantageous [see Platteau (1996) for references]. On the one hand it could pave the way for the emergence of sales markets that deprive traditional communities of their source of livelihood (often without adequate compensation), thus generating social unrest and violence and eliminating an important form of insurance. On the other hand, where land rights are introduced in such an environment, productivity will not necessarily increase, as availability of land rights could induce concentration
18 Ellickson (1993) notes that historically the establishmentof formal land rights is closely related to the emergence and widespreaduse of writtenlanguage;in manyculturesrecords of land transactionswere among the firsttexts to be officiallyrecorded. 19 See, fur example, the Indian Arthsastra from the fourth century B.C., as well as references in the Bible relating to the period 600 B.C. 20 Jodha (1990) provides evidenceon the importanceof access to the commonsas a safety net for the poor. Based on panel data from China, Burgess (1997) finds that the equitable allocationof land use rights under communaltenurehas an effect similarto a lump sum transferthat provides insuranceagainstlow nutritional outcomes in a way that is more incentive--compatiblethan an ex post redistribution.The fact that land ownership has a more significantimpact on improvingnutritionthan on incomecan be explainedby the fact that, with imperfect rural grain markets, considerablecash outlays would be required to achieve a similar effect through marketpurchases of grain. The presence of equity benefitsfrom periodic redistributionof land rights in China would be consistentwith peasants' strong support for the system of periodic redistribution[Kung (1995)].
302
K. Deininger and G. Feder
of landholdings by a privileged minority of wealthy individuals who - for example by having access to non-covariate sources of income - axe in a position to accumulate land for speculative purposes without making productive use of this asset. 21 Historical evidence indeed suggests that, especially in situations where other markets are not well developed or where policy-induced distortions affect the functioning of land markets, increased transferability of land may deprive the poor of an important social safety net. The importance of the insurance aspect is confirmed by the fact that, even where societies have made the transition to individualized land rights, they have often maintained land-related social safety nets to provide insurance for the poor. One example of a mechanism to do so is to allow continuing uses of communal pastures and forest areas of low productive value as well as a universal right to collect leftovers after the harvest or to graze animals on harvested fields. Another example is the provision for periodic redistribution of at least part of the land available to the community. 22 Such redistribution of cultivation rights could decrease productive efficiency by attenuating incentive to make plot-specific investments. The fact that societies have been willing to incur these efficiency losses suggests that the subjective valuation of the benefits in terms of avoiding widespread landlessness, social destitution, and discontent, has been high. This implies that where land is an important asset for poor and marginal groups, both social and efficiency aspects associated with land rights need to be accounted for in assessing the potential benefits from individualizing land tenure arrangements.
3. Land markets: Functioning and efficiency implications If there are differences in individuals' skills and endowments of different factors of production, markets should help in optimizing factor proportions employed and thus increase overall efficiency of resource allocation. This section aims to outline the main determinants that would affect participation in the land sales or the land rental market, and based on this to elaborate on links and differences between these two markets, in terms of their impact on equity and efficiency of resource allocation. The productivity advantage of small farmers who rely predominantly on family labor rather than on less motivated hired workers who have to be supervised would imply that, in the absence of imperfections in other markets, a functioning land market should facilitate efficiency- and equity-enhancing transfers from large to small producers, or from ones with lower management skills to better operators. However, land sales transactions could be efficiency-decreasing if, for example due to policy-induced credit
21 Note that this is historically well-founded, as the many examples in Binswanger et al. (1995) demonstrate. 22 If incentive smactures and enforcement mechanisms to ensure that such provisions are actually implemented at the local level are non-existent, the provision for regular redistribution can actually give way to arbitrary behavior and rent extraction by local leaders. For a theoretical and empirical discussion of these issues, see Turner et al. (1998).
Ch. 6: LandInstitutions and Land Markets
303
market distortions, large owners' advantage in accessing credit would offset the productivity advantage of owner operators; or if, due to the inability to insure, significant land holdings are not part of poor people's optimal asset portfolio. 23 Thus, before actions to activate the land market are undertaken, careful empirical investigation of the functioning of financial markets and insurance mechanism, and possibly steps to improve their functioning, might be in order. Even if imperfections in markets for credit and insurance reduce the scope for the land sales market to bring about improved land allocation through land transfers from large to small producers, such allocation should- in a frictionless world - be facilitated through the land rental market. One possibility would be an interlinked contract whereby the landlord uses the credit access provided by land ownership to provide the tenant with working capital as part of the rental contract. High transaction costs - part of them related to government regulation - reduce the extent of land rental transactions in a number of countries. Examining the implication of regulations in more detail would be of importance as removing unjustified interventions is likely to go a long way towards improving resource allocation in agricultural systems characterized by very unequal land distribution. Most rental markets in developing countries involve some form of share tenancy. While this arrangement does not lead to full efficiency, it is a second best solution given risk and imperfect capital markets. The sections below elaborate these points and review relevant evidence. 3.1. Key determinants o f land market participation
The shadow price of land for different types of agents is determined by the agricultural production function, the households' inherent managerial ability, and by possible imperfections in labor, credit, and land markets that are common in rural areas. If credit and land rental markets were perfect, the supervision costs associated with the use of hired labor would make smaller farms more productive, and would lead households to lease in or lease out the amount of land required to maintain a uniform ratio of family labor endowment to operated area, irrespective of the land ownership distribution [Feder (1985)]. However, imperfections in other markets may change this, with implications for the functioning of land rental and sales markets. For example, in the presence of credit market imperfections, if supply of working capital depends on the amount of land owned, the optimal size of the operational holding will vary systematically with size of the owned holding even if land rental markets were perfect. While the magnitude (and direction) of this effect would depend on the elasticity of output with respect to effective labor and of labor effort with respect to supervision, it can overwhelm the productivity advantage of family farmers and give rise to a positive relationship between
23 Indeed, there is descriptiveevidenceindicating that in environmentswith imperfectcredit market access, e.g., in Africa, land salesmarketsresultin an efficiency-reducingtransferof land fromsmallto largeproducers [Collier (1989)].
304
K. Deininger and G. Feder
owned farm size and productivity. In addition to this, capital and insurance market imperfections may also affect the production activities of poor producers - possibly leading them to pursue less risky but also less productive activities. Below we review the factors which affect the productivity of farmers, and thus determine their demand for land. 3.1.1. Economies o f scale
The presence or absence of economies of scale would systematically affect the shadow price of land for different farm-size classes. Possible economies o f scale could arise from the presence of indivisible factors of production or cost elements leading to an initial range of farm size where the average cost of production declines with farm size. In cases where other markets function reasonably well, optimal farm sizes tend not to exceed the scale at which family labor is fully occupied (utilizing seasonal hired labor for specific tasks), 24 There are few agricultural activities in which significant economies of scale in the production process exist. 25 Some economies of scale are associated with the processing and marketing of many agricultural products, but this does not have important implications for the unit cost of farming operations as long as competitive markets for outputs and inputs exist. Alternatively, access to such markets is sometimes arranged through cooperatives. Only for a few "plantation crops" such as sugarcane, bananas, or tea could the need for immediate large-scale processing or marketing transmit economies of scale from the processing stage to production. To reap the economies of scale associated with the former, production of these crops is generally organized on a scale that corresponds to the optimum scale of the processing factory. 26 3.1.2. Labor supervision cost
Constant returns to scale would imply that the size of agricultural operations has little impact on productivity. However, the need to supervise hired labor would confer a productivity advantage on owner-operated farm units. The fundamental reason for this is the presence of agency costs [Jensen and Meckling (1976)], which result from the need to manage wage labor and enforce effort in large-scale operations. The lack of incentives for wage workers to exert effort, and the consequent need to supervise labor or to offer incentive contracts, has received considerable attention in industrial
24 A large number of empirical studies [e.g., Olson-Lanjouw(1995) for India, Feder et al. (1989) and Burgess (1997) for China, Olinto (1995) for Paraguay] are indeed unable to reject the hypothesis of constant returns to scale in agricultural production. 25 Exceptions are limited to cases of highly specialized machinery, specialized livestockproduction, or plantation crops where economies of scale are transmitted from the marketing to the production stage. 26 However,the supervision advantagesof owner-operators have in many cases motivated large processors to contract production out to smallholders under outgrower or contract farming schemes, often providing credit in kind as well as technical assistance [Glover (1990)].
Ch. 6:
Land Institutions and Land Markets
305
organization literature [Jensen and Meckling (1976)], and is recognized to have profound implications for the organization of production and for the optimal size of the firm [Calvo and Wellisz (1978), Eswaran and Kotwal (1985a, 1985b)]. The cost of supervision is particularly large in agricultural production due to spatial dispersion of the production process and the need to constantly adjust to micro-variations of the natural environment. Family members are residual claimants to profits and thus have higher incentives to provide effort than hired labor. 27 They share in farm risk, and can be employed without incurring hiring or search costs. These attributes underlie the general superiority of family farming over large-scale wage operations, manifested empirically in an inverse relationship between farm size and productivity. A large number of studies based on aggregate, or cross-sectional, and panel data have confirmed the existence of the inverse farm-size productivity relationship for all but the smallest farm size classes [Berry and Cline (1979), Carter (1984), Benjamin (1995), Newell et al. (1997), Kutcher and Scandizzo (1981), Olinto (1995), Burgess (1998), Udry (1997)]. 28 Thus, unless there are other countervailing forces, one would expect land markets to transfer land from large to small producers. We turn now to a discussion of these countervailing effects. 3.1.3. Credit m a r k e t access
A reason for observing few land market transfers from large to small producers is that it is difficult for small farmers to obtain credit and insurance. 29 This has two implications. On the one hand, credit market imperfections that increase the shadow price of credit for small producers would reduce small farmers' competitiveness in the land sales market, possibly outweighing the supervision cost advantage they enjoy. Also, if there are individuals with non-agricultural income who value land for other than productive reasons, land prices will exceed the net present value of agricultural profits, making it difficult to acquire land in the sales market with the expectation of paying off the debt from agricultural profits alone without recourse to equity. Asymmetric information and moral hazard lead generally to quantity rationing in credit markets [Stiglitz and Weiss (1981)]. Formal credit markets can overcome the problem of asymmetric information by utilizing a collateral requirement. However, the costs of and political impediments to foreclosure on smallholders' land are often quite significant. This is part of the generally high transaction costs associated with providing credit to small producers. In informal credit markets, close familiarity and social control
27 Empirical evidence confirmsthat family labor is more productivethan hired labor, and that the intensity of supervision by family members affects the performance of hired labor [Frisvold (1994)]. 28 Bhalla and Roy (1988) and Benjamin (1992) have shown that cross-section analyses [e.g., Berry and Cline (1979), Carter (1984), Newell et al. (1997), Kutcher and Scandizzo (1981)] tend to overestimate the productivity advantage of smaller farms if soil quality is not specificallyaccounted for. 29 Due to the covarianceof production risks, crop insurance is very difficult to obtain and forwardmarkets to insure against price risk are often unavailable to small producers due to high transaction costs.
306
K. Deininger and G. Feder
is used to select promising clients or projects. This is quite costly as the scope for effective supervision is limited. Furthermore, informal lenders have only limited scope to diversify covariate risks, and they typically do not provide much long-term credit. Interest rates on informal loans are thus high. Thus, both limited availability of credit and high cost of borrowing would prevent those who do not have accumulated savings from acquiring land. 3o Credit market imperfections can thus offset small farmers' supervision cost advantage. For the case of Sudan, for example, yields for virtually all crops are lower for poor (small) farmers and higher for rich (large) farmers, thus turning the farm-size productivity relationship upside down. Furthermore, the land rental market leads to land transfers from poor and labor-abundant smallholders to rich and relatively labor-scarce households [Kevane (1996)]. The reason is that capital market imperfections combined with reasonably functioning land and labor markets and a technology that is not supervisionintensive make it more attractive for small credit-constrained households to rent out land and work for a wage than to engage in owner-cultivation without capital inputs. By contrast, in panel data from Burkina Faso an inverse farm size-productivity relationship was observed even though a positive presence of correlation between yields and cash inflows from non-agricultural employment suggests the presence of capital market imperfections [Udry (1996)]. The conclusion is that imperfections in land, labor, credit, and insurance markets have to be analyzed together. Efforts at land redistribution that do not simultaneously address credit market imperfections may be costly and ineffective. 3.1.4. Portfolio composition
Small producers' inability to access formal markets for credit and insurance often forces them to adopt costly insurance substitutes, one of which is the adjustment of crop and asset portfolios to a low return-low risk combination. 31 In order to ensure satisfaction of a minimum subsistence requirement during periods of distress, credit-constrained producers could hold a portfolio of less risky but also less productive assets than that of unconstrained producers. In particular, smallholders may demonstrate a lower demand for land than that which would seem to be justified by their potential productive advantage. Zimmerman and Carter (1996b) use parameters from Burkina Faso to show that, starting from an egalitarian distribution of land, production risk together with covariance of land prices leads to successive concentration of land via sales from more productive small producers to relatively less productive large farmers. This illustrates
30 The difficultyof land acquisition through borrowingby would-besmallholders,in spite of their productivity advantage,has been highlighted by Binswangerand Elgin (1988) and Carter and Mesbah (1993). Furthermore, they point out that by exhausting access to credit for land acquisition, the abilityto borrowfor working capital is eliminated. 31 Examplesare providedby Rosenzweigand Wolpin (1993), Dercon (1996), Dercon and Krishnan (1996), and Rosenzweigand Binswanger(1993).
Ch. 6: Land Institutions and Land Markets
307
that improving the functioning of land sales markets will not necessarily lead to better resource allocation if other markets' distortions are not tackled. 32 3.1.5. T r a n s a c t i o n costs
A further factor that might prevent land markets from achieving a first-best allocation is the transaction cost associated specifically with land sales. It has often been observed [see, for example, B alcazar (1990), Carter and Zegarra (1995)] that, especially in countries with a dualistic distribution of land ownership, land s a l e s markets are highly segmented in the sense that, despite a considerable frequency of land transactions within farm size groups, land sales across farm-size class-boundaries are virtually absent. One explanation is that transaction costs of subdividing large farms to many smallholders are high. Similarly, the fact that certain costs (e.g., formal registration) associated with land transactions are independent of the size of the purchase creates indivisibilities that would either discourage small land transactions or drive them into informality where such costs are not incurred. W h i l e the discussion of costs associated with land rentals in the literature is less extensive, government regulations appear to have reduced the amount of land leasing below what would take place otherwise. Even in countries that avoided the imposition of explicit restrictions on tenancy (which, as discussed below, were associated with significant efficiency losses), the threat of expropriative land reform in many countries implied that renting out land to more productive smaller producers exposed the landlord to a considerable risk of losing ownership rights in the course of land reform. To prevent this from happening, many landlords appear to have evicted tenants altogether, resorting instead to mechanization, cattle ranching, or cultivation using a hired labor force [De Janvry and Sadoulet (1989)]. The implications for land rentals, although they have not been rigorously quantified in any of the cases, appear to have been considerable. 3.2. L a n d s a l e s m a r k e t s
The discussion of the previous section implies that non-agricultural uses of land as well as credit market imperfections tend to drive the equilibrium price of land above the capitalized value of the income stream from agricultural profits. This would imply that fully mortgage-based land acquisition by the poor will not be possible. In addition, policy distortions will tend to increase the wedge between the price of land and the capitalized value of the income from agricultural production. Use of land as an inflation hedge, as
32 The fact that study of land markets cannot be divorced from the functioning of other markets has been emphasized by Basu (1986) in a model of "interim" land transactions that explicitly serve as a credit substitute. In this context, the supply of land for sale would increase with the probability of being able to buy back the land, the attractiveness of other (financial) assets as compared to land, and the need for liquidity. Sengupta (1997) draws out the implications of limited liability on contract choice within a more general set of contractual options.
308
K. Deininger and G. Feder
well as credit subsidies and tax advantages that allow the use of agricultural activities as a tax shelter, are examples [Gunjal et al. (1996), Brandao and de Rezende (1992), Just and Miranowski (1989), Feldstein (1980)]. To the degree that such distortions confer disproportionate benefits to larger landholders (as in the case of tax advantages, which are generally of no relevance to the poor), this would further bias the operation of the land sales market against redistributing land to landless or marginal landowning households who could have a productivity advantage as family farmers. Analysis of land market transactions and offer and asking prices in Paraguay indicates the presence of a large gap between willingness to sell and willingness to pay, 33 significant differences in such prices across farm sizes, and very distinct regional patterns of land market performance depending on whether or not other markets exist and how well they function. 34 A similar conclusion is implied by the observation that the degree to which financial markets were accessible to small producers was (together with the initial distribution of assets and the characteristics of the production system) one of the key factors that determined the response of land accumulation patterns to agro-export booms in Guatemala and Chile ]Carter and Barham (1996)]. Exposure to undiversifiable residual risk causes farmers to resort to liquidation of their assets during periods of severe crisis, a phenomenon commonly referred to as distress sales. This implies that the covariance of weather risks for the farming population causes land prices to be low (due to insignificant effective demand and high supply) during bad crop years, with the consequence that individuals who had to sell off land during crises may not be able to repurchase land during subsequent periods of recovery [Bidinger et al. (1991)]. Distress sales have not only played a major role historically in shaping more concentrated land ownership patterns, but are also linked in the literature to the elimination of traditional mechanisms for coping with risk [Kranton and Swamy (1997), Brockett (1990)]. 35 The link between unmitigated production risk and distress sales is highlighted by Cain (1981) who examines the implications of different insurance mechanisms on distress sales and the land ownership distribution between 1960 to 1980 for predominantly agricultural villages in India and Bangladesh. These villages faced very high production risks but were characterized by distinct differences in mechanisms of risk insurance: In Maharashtra, India, an employment guarantee scheme operated throughout the period
33 Willingness to sell was significantly higher than was willingness to pay to purchase land, but the gap decreased with farm size (from 50 percent for the smallest farms, to 20 percent for medium-sized units). This could be an indication of labor market imperfections, i.e., the value given to land as a source for selfemployment, in addition to small farmers' unwillingness to be bought out. 34 In Paraguay, land markets ffmctionreasonably well in traditionally settled zones in the country's interior, but not at the frontier where the labor cost advantage of family farms appears to be overshadowedby capital market imperfections [Carter and Zegarra (1996)]. This suggests that the productivity advantage of small farmers would manifest itself in the land purchase market only if land market reform were combined with improved access to capital markets. 35 Distress sales have been important in China [Shih (1992)], in early Japan [Takekoshi(1967)], in the Indian Punjab [Hamid (1983)], and in Latin America following the abolition of communal tenure [Brockett (1990)].
Ch. 6: LandInstitutions and Land Markets
309
and attained participation rates of up to 97 percent of all households during disasters. Such schemes were absent after the major flood episodes in Bangladesh. Thus, 60 percent of land sales in Bangladesh were undertaken to obtain food and medicine, undoubtedly due at least in part to the lack of other insurance mechanisms. A b o u t 60 percent of the currently landless lost their land since 1960, and the Gini coefficient of landownership distribution increased from 0.6 to almost 0.7. This contrasts sharply with the Indian villages, where land sales to finance consumption expenditures accounted for only 14 percent of sales and were incurred mainly by the rich to meet social obligations. On the other hand, 64 percent of land sales were undertaken in order to generate capital for productive investment (digging of wells, purchase of pump sets, and children's education), and the land sales market actually contributed to a slight equalization of the land-ownership distribution. This suggests that in this case the poor were able not only to avoid distress sales, but were able, through access to cash-generating employment, to acquire some land as rich households liquidated agricultural assets to be able to pursue non-agricultural investment, Survey data on land transactions from India indicate that purchases of land are almost all undertaken by individuals with access to sources of income which are not correlated with agricultural production, and that borrowing to finance agricultural land acquisition is virtually non-existent [Sarap (1990)]. 3.3. Land rental markets
As the discussion above illustrates, land sales markets will not necessarily lead to an optimal allocation of land in the presence of credit and insurance market imperfections. However, improved resource allocation can be achieved through land tenancy contracts even when other markets are incomplete. Analysis shows clearly that land rental markets serve an important function in equalizing returns to non-tradable factors of production such as family labor and bullocks [Skoufias (1991)]. 36 Given the huge diversity o f tenancy arrangements, we need first to explain the wide range of tenancy contracts that is empirically observed in developing countries. This gives rise to the second issue, namely, the implications of these contracts for the efficiency of resource allocation. Assume a constant returns to scale production function Q = OF(e, h), where Q is output, e is effort, h is number of tenants, and 0 is a stochastic element. Then the range of contracts can be summarized as follows. The landlord's income is y = h [ ( 1 - ~ e ) Q - / 3 ] , and the representative tenant's income is Y = c~Q ÷ / 3 . The fixed rent contract is given by {~ = 1,/~ < 0}, the pure wage contract is represented
36 Land rental transactions to circumvent imperfectionsin credit markets have been important in West Africa in the past [Robertson (1982)], and continue to be observed in a number of developing countries where credit markets are absent or credit is highly rationed. Usufruct mortgage is still reported to be common in Bangladesh [Cain (1981)], Java [Morooka and Hayami (1989)], and Thailand [Fujimoto (1988)]. In the Philippines, tenancy transactions emerged as a credit substitute in response to limitations on the transferability of land [Nagarajan et al. (1991)1.
310
K. Deininger and G. Feder
by {ol --- 0,/3 > 0}; and the share contract is given by {0 < e~ < 1 }, with the sign and magnitude of/3 a function of the landlord's choice of c~ and the tenant's reservation utility level [Otsuka et al. (1992)]. Under conditions of certainty and the assumption that tenants' effort can be monitored and enforced, the specific choice of contract type does not matter as all contracts lead to equivalent outcomes [Cheung (1969)]. If the assumption of perfect effort enforceability is dropped, and agents are assumed to be risk neutral, only the fixed rent contract is optimal. The reason is that in all other cases tenants receive only a fraction of their marginal product, something that would induce them to exert less than the optimal amount of effort (where the marginal disutility is equal to the full marginal benefit from this action). Any type of contract other than fixed rent would result in undersupply of effort by the producer (tenant or worker), which would lower total production. Indeed, fixed-rent tenancy is widespread in all developed countries, such as the U.S. and Canada, where about one-third of the agricultural land is cultivated by tenants. The fact that virtually all of this land is rented under fixed-term contracts suggests that such an arrangement would be a relatively efficient way of achieving optimal operational holding sizes in economies with well-functioning credit, risk, and labor markets. However, where markets for credit and insurance are highly incomplete and where the rural landless class is large, as is the case in most developing countries, adoption of a fixed rent contract where rent is paid up-front (i.e., independent of the output from production) may not be feasible or optimal from the perspective of all parties to the transaction. In such a situation, two main reasons, risk-sharing and limited tenant wealth, could mitigate against adoption of the fixed rent contract and in favor of a sharecropping c o n t r a c t s Although it would reduce the incentive to exert effort, a share contract provides the possibility of partly insuring a risk-averse tenant against fluctuations in output. Where, in risky environments, a risk-averse tenant faces significant uninsured risk, a share contract may well provide the tenant with higher expected utility and thus be adopted despite the lower aggregate productivity involved. In fact, it can be shown that in this case, the Pareto optimal outcome will always require a trade-off between the risk-reducing properties of the fixed-wage contract, under which the tenant's residual risk is zero, and the incentive effects of the fixed-rent contract, which would result in optimal effort supply but no insurance [Otsuka et al. (1992)]. Given risk aversion and incomplete intertemporal markets, a one-period contract is a second-best solution. Part of this shortcoming can be eliminated by state-contingent side payments in the context of a repeated game. 38 37 There is a third rationale for adoption of the share contract, namely that imperfectinformation on tenants' unobservable characteristics, such as ability, causes landlords to use sharecropping contracts as a screening device where the tenants' acceptanceof certain types of contracts provides a signal for their productive ability [Newbery and Stiglitz (1979)]. Data from India indicate that landlords observe tenants' ability quite well [Olson-Lanjouw (1995)], suggesting that such signaling may not be the main reason for the adoption of sharecropping. 38 Sadotdet et al. (1997, 1994) observe that close kinship relations provide sufficient assurance to landlords to provide implicit insurance to their tenants, thereby avoiding the inefficiencyof the share contract.
Ch. 6:
Land Institutions and Land Markets
311
Limited tenant wealth increases the landlord's risk when a fixed-rent contract does not involve a front-end payment. In case of a disaster (such as a bad climatic shock), tenants with insufficient wealth are likely to default on the rent payment, implying that landlords will tend to enter into fixed-rent contracts only with tenants who are wealthy enough to pay the rent under all possible output realizations. If tenants are poor, it will be optimal for the landlord to choose a share, rather than a fixed-rent contract [Shetty (1988)]. In a one-period game this would imply that landlords would rank tenants by wealth, choosing to enter into contracts only with the wealthiest tenants. Empirical evidence reported by Quibria and Rashid (1984) confirms such behavior. By implication, the efficiency of any particular tenancy contract is increasing in tenant wealth, and the overall efficiency of the tenancy market would depend on the initial wealth distribution of potential tenants, generating a direct mapping between the distribution of wealth and economic efficiency [Bardhan et al. (1997)]. In a repeated game, landlords would allow all but the least wealthy tenants to earn positive profits in equilibrium, thus using the threat of contract termination (or eviction) as a device to elicit effort supply. A n extension of this argument is provided by Mookherjee (1997), who shows that in the context of bargaining on the terms of an interlinked tenancy contract between landlord and tenant, the efficiency of the contract - i.e., the amount of effort exerted will always be higher under operator-ownership of the land than under a tenant-landlord relationship. 39 This would imply that redistribution of land from the landlord to the tenant - or any other measure (e.g., increased off-farm opportunities) that would increase the tenant's reservation utility - would be associated with an increase in aggregate productivity. Still, while such a redistribution could increase the aggregate utility of both parties (thus making compensation of the landlord a theoretical possibility), a voluntary market-based transfer of land from the landlord to the farmer is not feasible. The intuition is s i m p l e - since a credit-based land purchase does not enhance the tenants' wealth, the limited liability constraint will still be applicable and the debt overhang incurred by the cultivator to purchase the land will reduce the incentive to apply effort instead of just defaulting on the loan. However, a non-market transfer of land from landlords to farmers could be associated with an increase in overall productivity as well as aggregate welfare. Insights on the relationship between liquid assets and contractual parameters are provided by Laffont and Matoussi (1995) in a study of Tunisian sharecroppers. Their results suggest that differences in the contracting parties' working capital endowments can account for the coexistence of a variety of contracts, even in the same environment and among parties with similar risk aversion characteristics. 4o The positive relationship
39 The scope for other benefits from a more egalitarian distribution of land ownership that are not directly related to agricultural productivity is illustrated by Banerjee et al. (1997). 40 If risk were a major factor in choosing the optimal type of contract, one would observe significantvariation in crop shares according to the riskiness of the crops grown on particular plots. This, however, is not observed empirically.
312
K. Deininger and G. Feder
between the crop share and the tenant's working capital endowment that would be predicted by theory, even with perfect monitoring of effort, is indeed confirmed by the data. Output is shown to increase significantly with tenants' wealth for all contract types as well as for share contracts, but tenant wealth has no effect if only fixed rent contracts are considered. Similarly, the wealth of the landlord has, as expected, a negative effect on the tenant's share and a positive effect on production under the share contract, but none in other forms of contractual arrangements. Working capital thus appears to be a significant explanation of the type of contract chosen and the production gains achieved on a given plot. The importance of potential tenants' asset endowment is also emphasized by evidence from India which indicates that, due to wealth constraints, a large number of potential tenants are actually rationed out of the tenancy market [Shaban (1991)]. In this context, both the smallest and the largest landholders rent their land to middle farmers who are neither capital-constrained nor suffering from the disadvantage associated with the need to supervise hired labor. This illustrates that the ability of the land rental market to bring about efficiency-enhancing transfers is constrained by potential tenants' endowment of assets and other means of production. Thus, while land rental markets improve the allocation of resources in the presence of factor market distortions by bringing land to imperfectly or non-tradable factors of production (experience, family labor, animal power), the gains are constrained by endowments of potential transactors. In addition, there is evidence that fixed transaction costs preclude some poor households that desire only relatively minor adjustments from entering the tenancy market. Similarly, data from India suggest the prevalence of imperfect adjustment whereby, on average, farmers realize only about 75 percent of the desired level of land transactions [Skoufias (1995)]. The latter study also indicates that the adjustment effected by the land rental market is asymmetric for net inrenters and out-renters; consistent with the view that market power depends on relative scarcity of factors, in this environment of land scarcity, it is easier to rent out than to rent in. What, then, is the magnitude of the productivity effects that are brought about by the operation of land rental markets? To obtain credible estimates of the loss due to the second-best nature of sharecropping, one needs to control for unobserved household specific fixed effects, e.g., by comparing input use, productivity, and investment, between sharecropped and owned (or cash-rented) plots for the same household. Bell (1977) was the first to conduct such an analysis in a static context, finding that farmers indeed exert less effort on tenanted plots. Applying the same methodology, Shaban (1987) found that, on average, tenancy was associated with a 32 percent lower output; but the difference was only 16 percent once adjustments were made for differences in land quality. Inputs of family labor and draft animals were significantly lower on sharecropped plots than on owned parcels. No statistically significant differences in productivity were found between owned plots and plots rented on a fixed-rent basis, confirming that fixed-rent contracts induce higher productivity. Other studies yield results that point in the same direction [Sen (1981)].
Ch. 6:
Land lnstitutions and Land Markets
313
The productivity loss entailed in sharecropping can be reduced through close social relationships, as confirmed by Sadoulet et al. (1997). Their study compared the attributes of contracts with kin and non-kin, finding that non-kin sharecroppers use significantly fewer inputs and obtain less output. However, for sharecropping among close kin, there is neither a disincentive effect nor a reduction in output. This suggests that embedding contractual arrangements in a long-term personal relationship offers considerable potential to attenuate the disincentives and productivity losses that are otherwise associated with sharecropping contracts. This evidence is in line with the comprehensive review of the literature by Otsuka et al. (1992), who found a large number of studies about equally split between efficiency and inefficiency of sharecropping contracts. Studies that did not find a disincentive effect of sharecropping were generally conducted in environments where such a contract was embedded in enduring family and patron-client relationships or where effort was easily monitored. Even within households, imperfections in land and labor markets, together with the inability to commit, may prevent individuals from achieving an optimal allocation of productive factors. For plot-level panel data from Burkina Faso, Udry (1995) finds that reallocation of factors from male- to female-controlled plots within the same household could increase output by 6 percent - less than half of the estimated output loss from imperfect allocation of productive factors at the village level (13 percent), but still significant. One interpretation is that, by "renting" out land to their husband, women would risk losing these rights. In the absence of other assets that could be transferred from the husband to the wife to provide assurance, they fail to do so, despite the productivity increases that doing so might entail. All this implies that, although they cannot completely eliminate structural impediments and bring about a fully efficient allocation of land in an economy, land rental markets can go a long way in bringing the operational distribution of holdings closer to the optimum. However, in quite a few countries, the extent of land rental markets has been greatly diminished by large landowners' reluctance to engage tenants due to concern for potential challenges to their property rights. Furthermore, rental markets' potential to increase overall welfare was not well understood by governments. Consequently, the static productivity loss entailed in sharecropping tended to induce interventions that have limited the extent of rental transactions, thus causing a larger inefficiency in resource allocation. We turn now to discuss these and other policy issues related to land markets.
4. Policy issues This section reviews the main policy implications of the earlier discussion, focusing on clarification and adjudication of property rights, ways to improve the functioning of land sales and rental markets, and redistributive land reform. These three steps form a rough sequence, in the sense that it is difficult to improve the functioning land sales or rental markets without clarification of land use and ownership rights, or to conduct
314
K. Deininger and G. Feder
non-expropriative land reform in an environment where land markets are absent. This implies that government activity should be focused on eliminating distortions and taking measures to reduce market imperfections rather than on attempting to compensate for imperfections and distortions in other markets.
4.1. Clarification and adjudication of property rights A coherent system of property rights that guarantees security of tenure to cultivators, facilitates access to land by the poor, and encourages investment to increase sustainability and productivity can be of overriding policy importance in two types of settings. In countries making the transition from communal to more individualized forms of land ownership, it is important to have a flexible, stepwise, and decentralized approach that acknowledges differences in demand for tenure security based on diversity across regions and agro-climatic conditions. This requires a legal framework that permits evolution of land rights towards individualized tenure as the need emerges with commercialization and land scarcity. Second, in situations where land tenure arrangements have been severely disrupted by civil strife and war, collectivist land reform, or land-grabbing of influential individuals (e.g., Bolivia, Honduras, Nicaragua, Cuba, Vietnam, Ethiopia, Uganda, Tanzania, and the former Soviet Union), an approach that adjudicates among overlapping claims and establishes clear ownership rights to land at minimum cost is needed. The evidence reviewed in preceding sections provides support for the view that secure land rights are necessary for longer-term investment nd the associated productivity increases. Land registration and titling systems are often perceived as an important element in policy seeking to promote tenure security and to facilitate more effective land markets. This is because official documentation provides better protection of an owner's property rights, and eliminates the asymmetric information that curtails land markets transactions. However, experience with titling programs indicates that in sparsely populated areas the cost of introducing formal titling systems may outweigh the benefits and that the administrative infrastructure needed to effectively implement such rights is not available. Similarly, formal documentation is not crucial where customary tenure systems provide sufficient security to facilitate the level of investments and land transactions that are relevant for the prevailing economic environment, and where credit markets are not yet developed to the point where collateral use is necessary. Past interventions have often underestimated the cost and administrative requirements of providing tenure security through formal title and have given little thought to the scope for alternative means to provide such security. Community-based approaches whereby a whole area is demarcated and internal administration of land rights (including provision of documentation by local authorities) is left to the community may in many cases provide a cheaper alternative to formal titles [Platteau (1996)]. However, the critical precondition for such an approach to work is that consistent implementation of this arrangement is feasible, that decentralized institutions are account-
Ch. 6:
Land lnstitutions and Land Markets
315
able and effective, and that the certificates awarded by such authorities are legally recognized, entailing a possibility of converting them into more formal titles at a later stage. The 1992 modification of the Mexican Constitution, and similar arrangements in a number of other countries (e.g., Bolivia, Colombia, C r t e d'Ivoire, and Nicaragua), allow indigenous and non-indigenous communities to administer property rights internally. In the case of Mexico this also includes communities' right to decide, subject to established rules of accountability, on the partial or formal transformation of their land rights into individual freehold title [Gordillo et al. (1997)]. In principle, such an arrangement would allow the utilization of informational advantages available at the community level in tailoring property rights to the specific situation at hand. However, little is known about the transaction costs incurred and the degree to which outcomes have been equitable and conducive to improved efficiency. Evaluation of these experiences within a consistent framework would be very desirable and could provide valuable insights to fine-tune the approach and make the experience useful for other countries. The benefits associated with individuals' ability to use title to gain access to formal credit have been discussed above. Experience indicates that titling programs are most effective in areas where tenure insecurity already affects incentives, where there is an incipient formal credit market where title can be used as a collateral because foreclosure of collateral is enforceable, and where an effective legal system operates. 41 It is important to include safeguards against the grabbing of land (and in particular of hitherto c o m m o n land) by powerful and wealthy individuals, who are typically better informed on the procedures entailed in more formal systems [Feder and Nishio (1996)]. Past experience also suggests that land titling should be systematic and area-based rather than "on demand". 42 A n area-based program with complete coverage can utilize economies of scale in measurement, adjudication, and a speedy process for conflict resolution. This would reduce the cost of program implementation. Experience in Thailand, E1 Salvador, Peru, and Bolivia, along with other countries, demonstrates that this can be accomplished b y introducing titling in combination with a mechanism for dispute resolution on location (within the community) and a comprehensive publicity campaign. 43 In contrast, "on demand tiffing" is not only cosily, but is often inequitable. It provides opportunities for land-grabbing to individuals with good political connections and m a y preclude poor smallholders from participation due to the high cost of land registration. 41 The example of Kenya, where banks could not foreclose on the land that had been given to them as collateral because of social and ethnic factors, illustrates that - even where there is a demand for formal credit and the use of land as collateral - it is only the ability to effectivelyforeclose on defaulters that will persuade banks to accept land as a collateral for loans [Ensminger (1988)]. 42 Giventhe fixed cost element entailed in "on demand" titling (which is based on individual initiative) and the lack of economies of scale, this format of titling will tend to be more accessible to the wealthier landowner. 43 This would be of particnlar importance in the case of Africa where resistance against titling is fueled more by the fact that generally individualization of land tenure has been associated with extreme land-grabbing by powerful individuals - much more than the activation of a land sales market that would disempower smallholders [Bruce (1988)].
316
K. Deininger and G. Feder
4.2. Improving the functioning of land sales and rental markets Land taxation. A moderate land tax levied and collected by local governments has been advocated as a contribution to effective decentralization. There are two reasons why a land tax is theoretically attractive. On the one hand, taxation of land is one of the few cases of a lump-sum tax where, using asset rather than production values, the effective tax rate on income decreases with the income generated from the land, thus encouraging more productive resource use. On the other hand, a land tax is one of the few taxes that can provide revenues for the local governments, and that - through the capitalization of local amenities in land values - establishes a direct relationship between tax level and the benefits received by taxpayers [Glaeser (1995)]. Several countries have attempted to implement progressive land taxes, where the tax rate would increase with land area or value, as a means to make land speculation less attractive and to induce large landowners to use their land more intensively, or to break up large estates. Experience with this instrument has not been very positive, as implementation and collection of progressive land taxes have been frustrated by political difficulties and resistance in countries as diverse as Argentina, Bangladesh, Brazil, Colombia, and Jamaica [Strasma et al. (1987), Bird (1974)]. Carter and Mesbah (1993) use simulations to show that a progressive land tax by itself is unlikely to be effective even if it is enforceable. Effectively collecting a uniform land tax may be a more realistic goal. However, if environmental risk is high, introduction of a land tax (which has to be paid even if output is low) may not be desirable for equity reasons, and a mix of land tax and output tax (contingent on realized output) Pareto-dominates either tax in isolation [Hoff (1991)]. To avoid negative equity consequences that might be associated with a land tax, a number of developing countries exempt small producers below a certain size from the need to pay land taxes. Land sales markets. The fear of the undesirable consequences associated with land market operation in an environment characterized by market imperfections seems to have in the past motivated policymakers to impose restrictions on the operation of such markets. Administrative restrictions on land sales, however, have often been costly to enforce and ineffective in preventing inequitable outcomes. Administrative restrictions on land sales typically take the forms of limits on tradability of land and ownership ceilings. In many cases beneficiaries of land reform or settlers on state-owned land are not allowed to sell or mortgage their land. This deprives them of access to credit, often in the establishment phase when credit would be most needed. It has been shown that, in the presence of such restrictions, smallholders are forced to resort to less efficient arrangements (e.g., usufruct-mortgaging and the associated use of wage labor contracts) to gain access to credit [Hayami and Otsuka (1993)]. The goal of preventing land owners from selling out in response to temporary shocks would be better served by adequate safety nets, technical assistance, and access to complementary finance. Permanently precluding land reform beneficiaries from rental or sales is likely to reduce efficiency - all over the world such restrictions have resulted in
Ch. 6: Land Institutions and Land Markets
317
large tracts of land being less than optimally utilized. Allowing for some adjustments in response to differential settler ability may be preferable to the losses imposed by this measure. Another restriction intended to facilitate the breakup of large farms and the associated sales of land to small producers has been the imposition of land ownership ceilings, often together with land taxes. In addition to being largely ineffective, 44 such restrictions appear to have imposed extra cost on all parties. Landowners often took measures to avoid them, and the bureaucracy had to decide on exceptions to allow for the utilization of economies of scale in plantation crops - a process conducive to red tape and corruption. Even in the most favorable case such ceilings would constitute a temporary second-best measure to allow government to deal with the problem in a more thorough way. In many cases the reason for land concentration is not in a relative inefficiency of small farms but rather imperfections and policy-induced distortions in product and financial markets and the limitations on small farmers' ability to self-insure. If this is the case, it would be more effective for government to focus on the root of the problem, e.g., by designing safety nets and helping improve the functioning of other markets, rather than trying to deal with the symptoms. The interpretation that dis-equalization of land ownership is driven by imperfections in other markets is supported by the fact that in Central Uganda, in an area with good non-farm employment opportunities and well-functioning factor markets, land s a l e s markets contributed to a pronounced equalization of land ownership [Baland et al. (1999)].45 This implies that concerns about potential adverse equity impacts of land sales should be addressed by helping small farmers to compete, taking measures to improve the functioning of financial markets, and providing relief to avoid distress sales in cases of disaster. For a number of reasons, and especially in the presence of other market imperfections that would affect land prices, land rental markets may be more effective than sales markets in moving the distribution of operational holdings closer to the optimum. Rather than recognizing the potential of land rental markets to improve agricultural productivity and augment the welfare of landless poor people, governments have often focused efforts on restricting tenancy markets through bans on share tenancy and limits on cash rental fees. Such measures had very undesirable equity consequences in Latin America where they resulted in tenant evictions and the resumption of large-scale mechanized farming. Even in India, the country where tenancy reforms are generally believed to have had success, benefits to the poor have been limited. Tenant evictions associated with the threat of tenancy reforms caused the rural poor to lose access to about 30 percent of L a n d rental markets.
44 In India, for example, 35 years of implementing ceilings laws have, in all except three states, led to the distribution of less than one percent of the operated area to the target group [Appu (1996)]. 45 The lack of land rental market transactions in this environment may be attributable to relatively insecure ownership rights, which might lead the landowner to lose the land in case of rental.
318
K. Deininger and G. Feder
the total operated area and, by threatening landowners who lease out with the loss of their land, undermined land access through rental markets [Appu (1996)]. If feasible, the transfer of property rights implicit in such tenancy protections should improve static efficiency, as is confirmed by distlict-level data from West Bengal. In this case, tenancy laws yielded productivity gains of about 40 percent - slightly larger than the static loss estimated by Shaban [Banerjee et al. (1998)]. However, even in this case tenancy reform required intensive bureaucratic involvement and often created overlapping property rights to the same plot, thereby undermining investment incentives and reducing the scope for land (rental and sales)markets after the reform. Even in countries where tenancy reform has historically constituted a major policy instrument, there is now growing recognition that there is little scope for further tenancy reform and that, even in those cases where it is possible to implement, it provides at best a temporary measure that has to be complemented by market-based mechanisms in the longer term. Tenancy reform is not an option in countries where large-scale ownercultivation or wage labor is the predominant mode of cultivation. In all of these cases, the critical issue is to reduce remaining obstacles to land transactions without jeopardizing equity objectives. Land rental markets would appear to provide an ideal instrument to achieve this objective. 4.3. Redistributive land reform
As discussed earlier, unmitigated operation of land markets alone would not necessarily produce an optimal land allocation. In the land sales market, credit constraints would restrict the ability of the poor to acquire land (or any other indivisible asset), a phenomenon that has, in a more general context, been shown to be associated with intergenerational persistence of poverty [Banerjee and Newman (1991)]. 46 Transactions in the land rental market are easier to accomplish, but may be associated with a more limited impact on investment and productivity as well as tenant welfare. Efficiencyenhancing rental transactions might not come about either because of high transaction costs (especially in an unclear legal environment) or because of government restrictions that threaten rented properties with expropriation. In situations characterized by pervasive inequality in the ownership distribution of land or assets more generally, government involvement in redistributive land reform, aiming to improve efficiency and equity and at the same time remove impediments to the functioning of factor markets, could be justified. However, historically the experience with government-initiated land reform policies has been mixed, not only because reforms involving significant asset transfers are politically difficult and could be speedily implemented only where they were imposed by 46 This idea has been formalizedin theoretical models where lack of collateral keeps individuals in "poverty traps" unable to undertake indivisible investments which would be highly profitable [Galor and Zeira (1993), Eckstein and Zilcha (1994), Jalan and Ravallion (1997), Fafchamps and Pender (1997)]. In such a situation, a one-off asset distribution could be more effective than continuing redistributive e5%rts with the associated disincentive effects [Banerjee and Newman (1993)].
Ch. 6:
Land Institutions and Land Markets
319
an outside power or a revolutionary change of regime. 47 In the case of l a n d l o r d e s t a t e s where tenants already cultivated the land and all that was required was a reassignment of property rights, land reform was generally easy: The organization of production retained the same family farm system, where beneficiaries already had the skills and implements necessary to cultivate their fields. The administrative requirements associated with this type of land reform were minimal, and considerable efficiency gains have often been realized by improving incentives to work and invest by former tenants. 48 The magnitude of such gains was affected by the difference in (long- and short-term) incentives between the before- and after-reform situation. Productivity gains from such reforms were generally more modest if before the reform (i) security of tenure and incentives to invest had already been high, (ii) cash-rent-rather than share-rent-contracts had prevailed, and (iii) landlords had provided tenants with access to credit inputs, and outputs. 49 In contrast to the generally successful experience in landlord estates, land reform in h a c i e n d a systems - i.e., systems where tenants have a small house-plot for subsistence but work most of their time on the landlord's home farm - has been very difficult to accomplish. Thus some have argued that the "game of Latin American Land Reform" has been lost [De Janvry and Sadoulet (1989)]. In the large majority of these systems, large landowners responded to the threat of land reform by either evicting tenants who could have made claims to land ownership under a possible reform program, or converting them into wage laborers. In the case of eviction, landlords reduced reliance on hired workers either by resuming extensive livestock production and ranching o r - aided by significant credit subsidies - by embarking on highly mechanized self-cultivation [Binswanger et al. (1995)]. This not only reduced tenant welfare but also depopulated farms and created further difficulties for redistributive land reform. A number of further difficulties of effective land reform in hacienda systems are associated with policy distortions, limitations on the functioning of the land market, and inability to provide the necessary complementary elements for land reform beneficiaries to start successful small farm enterprises. First, the costs o f carrying out land reform were often increased by the continued existence of implicit and explicit policy distortions (e.g., agricultural protection and
47 The marked difference in the success of land reform between Korea, Taiwan, and Japan on the one side, and Nicaragua, Cuba, and Vietnam on the other, suggests that the ability to redistribute large amounts of land is not a sufficientcondition for land reform to be successful. 48 Indeed, since the end of World War II, landlord estates in Bolivia, Eastern India, Ethiopia, Irma,Japan, Korea, and Taiwan have been transferred to tenants in the course of successful land reforms. While evidence on the productivity impact of such reforms is much less than what would be desirable, they have generally been associated with significant increases in output and/or productivity [King (1977), Lieten (1996), Besley and Burgess (1998)]. 49 The degree to which land reform improved productivity and cultivator welfare increased with the profitability of existing investment opportunities [Callison (1983), Koo (1968), King (1977)], the degree to which land ownership enabled the new owners to access markets for credit and insurance that had previously been beyond their reach [Dorner and Thiesenhusen (1990)], and the availability of new technology that could be readily adopted [Otsuka (1991)].
320
K. Deininger and G. Feder
selective credit subsidies) that drove land prices above the capitalized value of agricultural profits and often disproportionately benefited large producers. Such distortions increased the fiscal cost of land reform policies and reduced their sustainability by making it profitable for land reform beneficiaries to sell their newly acquired land back to large farmers. Indeed, despite attempts to limit beneficiary desertion through imposition of legal restrictions and the threat of punishment in case of contravention, there is considerable anecdotal evidence on land sales by reform beneficiaries in Nicaragua, Colombia, and E1 Salvador. In a recent census of Brazilian land reform settlements, only about 60 percent of recently established land reform beneficiaries were actually found tilling their land. Second, many countries aimed to implement land reform by eliminating or restricting other forms of (rental and sales) market transactions. This completely eliminated price and other market signals, making it more difficult to select beneficiaries and land, and further increased the costs of land reform implementation. It also tilted the balance in favor of a highly centralized mode of land reform implementation that has, in a number of countries, led to the domination of land reform processes by formidable (and often corrupt) centralized bureaucracies. In addition, and probably most important, this virtually eliminated beneficiaries' access to credit markets, despite the evidence that without access to such markets, it is difficult for them to sustain themselves. In Ireland, for example, a large-scale experiment in "negotiated" land reform early in the twentieth century did not have the expected effect for two reasons. On the one hand it did little to alter the structure of production or to improve tenants' rights. More important, however, it actually w o r s e n e d access to credit, by limiting the ability of new landowners to mortgage land, while at the same time cutting off informal credit they had earlier obtained from the landlord [Guinnane and Miller (1997)]. 5° Third, transforming a large farm into a viable smallholder enterprise requires a change in the pattern of production, subdivision of the farm, and construction of infrastructure. As the productivity advantage of land reform hinges on increased incentives by owner-operators and adoption of labor-intensive crops, attention to complementary investments and awareness by beneficiaries is critical. Generally beneficiaries, even if they are workers of the former farm, are not accustomed to making independent entrepreneurial decisions, implying that training and human capital formation is therefore an essential component of the land reform process. Realizing the productivity benefits from land reform requires shifting the focus from political to productivity- and povertyrelated objectives.51 50 Severely restricted access to credit, together with insecure property rights, has also led to widespread selling of land by former land reform beneficiaries in Nicaragua - often at prices way below the productive value of the land [Joakin (1996)]. 51 The effect of political motivation on beneficiary selection and the stop-and-go cycle of land reform in response to political crises rather than opportunities for productivityincreases and povertyreduction are well documented [Barraclough (1970)]. A model of land reform as a piecemeal strategy by the rich to avoid the imminent threat of revolt - with backtracking as soon as the threat weakens [Horowitz(1993)] - would be consistent with such a view.
Ch. 6: LandInstitutions and Land Markets
321
Due to these difficulties, and the fact that land reform is a highly politicized topic, many of the land reforms that have been undertaken since the 1960s have not achieved their stated objectives. Evidence on the longer-term impact of land reform on poverty and productivity is more limited than desirable. 52 However, measures of macroeconomic adjustment such as elimination of trade protection and credit subsidies have resulted in a considerable reduction of land prices and the importance of land in a large number of developing countries. This has led a number of countries (e.g., Brazil, Colombia, South Africa) to begin implementing a new model of "negotiated" land reform that aims to replace a centralist and often expropriative approach with provision of a grant that would enable poor people to acquire land through the market. Key elements of this approach are (i) an emphasis on sustainable poverty reduction through elaboration of integrated farm projects by the poor (which are then supported by a land purchase grant), (ii) decentralized execution and integration into development objectives at the local level with an overarching emphasis on beneficiary training and human capital formation, and (iii) private sector involvement in project development, financing, and implementation. Obviously, mere adoption of a "negotiated" mode is not immunity against the shortcomings that have plagued earlier land reform attempts. 53 Initial evidence from pilot programs that have aimed to integrate land reform into a more comprehensive package of support does, however, suggest that the new approach is perceived to be significantly different from earlier land reform attempts [Deininger (1998)]. To what degree this potential can be realized remains to be seen.
5. Conclusion: Areas for further research While research on land markets and land institutions has been extensive, there are a number of areas where additional or more conclusive knowledge would be of great value. Below we highlight a number of key areas that merit further study. 5.1. Security o f land rights
There is broad agreement in the literature that secure individual land rights will increase incentives to undertake productivity-enhancing land-related investments. If there is scope for agricultural intensification, and these rights can be enforced at low cost,
52 One example of such economic analysis is the study by Scott et al. (1976) for Kenya. While it illustrates that land reform can have a positive social rate of return, it is based on data gathered in the immediate aftermath of the reforms, after which data collection was discontinued. 53 Due to a lack of poverty targeting, an exclusive focus on land purchases but not complementary investments, and a high (75 percent) level of subsidy, a "negotiated" program of land reform that was carried out in Italy during the period 1948-70 had only a limited impact on poverty reduction and was characterized by relatively high costs [Shearer and Barbero (1993)].
322
K. Deiningerand G. Feder
and secondary rights to land by other stakeholders are not eliminated in the process, then establishment of such rights would constitute a clear Pareto improvement. However, in many cases, traditional systems are associated with a wide range of equity benefits, not all of which normally can be preserved in a system characterized by private land ownership. Research aiming to understand not only the existence and magnitude of productivity benefits arising from the transition from traditional to private property rights, but also the types of welfare benefits provided by different forms of communal arrangements, their magnitude, and possible alternative mechanisms to generate similar effects, would be very useful. It could facilitate better identification of the point at which a transition from traditional to individualized tenure arrangements might be socially optimal and allow adoption of mechanisms that would ensure tenure security with minimal social disruption. Evaluation of country cases where innovative ways to make this transition have been explored recently could be a starting point for such an endeavor. 5.2. Improving the functioning of land markets
While there has been significant research on the static inefficiency of tenancy contracts, the welfare consequences and the impact of tenancy on farmers' investment behavior have received less attention. Assessment of the welfare aspects of tenancy - i.e., the impact of land ownership as compared to mere usufructuary rights on household well-being - would be of relevance to help policymakers determine specific steps for comprehensive land market development. Such analysis should consider the impact of access to land under different systems on productivity and welfare (e.g., through choice of livelihood strategies, higher or smoother consumption, access to credit, ability to accumulate wealth, etc.). A large body of literature on land price formation and the relationship between land sales and rental prices for developed countries already exists. However, much less is known on this issue for developing countries, in particular how recent dramatic changes in macroeconomic policy have affected land values and the relationship between land prices and agricultural profits. Elimination of credit subsidies and tax privileges, changes in relative prices of different types of agricultural products, and increased attractiveness of non-land financial assets that have been associated with these policies would have important implications not only for land prices but also for the operation of land (sales and rental) markets. This would also affect the type of economic agents who would be able to use these markets to gain access to land and the type of complementary policies (e.g., in the area of credit) that would affect their ability to do so. Notwithstanding the fact that markets are an important avenue for individuals to gain access to land, non-market transactions such as inheritance, allocation by village chiefs, and informal rentals among kin continue to have a far-reaching impact on a large part of the population and the structure of land ownership and land use in many parts of the world. A large descriptive literature discusses advantages and disadvantages of nonmarket mechanisms. However, quantitative evidence on the efficiency and equity impact
Ch. 6:
Land Institutions and Land Markets
323
of non-market transactions and the way in which policies that aim to change decisionmakers' incentive affect the extent and modalities of such transactions is still limited. Given that informal systems tend to be characterized by lower transaction costs and can provide land access for the poorest segments of the population who may not be able to utilize land rental and sales markets, better understanding of the potential and shortcomings of non-market mechanisms would be of great interest. There is also little doubt that in situations where, either traditionally or due to male out-migration, a significant part of agricultural production activities is carried out by women, the nature of women's land rights - many of which are defined informally - will have far-reaching implications for agricultural productivity and investment. However, much remains to be learned about the interaction between legal prescriptions, social norms, and intra-household bargaining in determining the nature of women's rights to land, and the scope for specific policy interventions to bring about efficiency increases by strengthening these rights. Over and above the market imperfections characteristic of rural areas, functioning of land rental and sales markets has in the past often been constrained by government interventions - in many cases with the aim to promote equity or overcome market imperfections. While the effectiveness of such policies was often limited, they generally left an institutional legacy that is difficult to dismantle. Research on the links between land and other markets could do much to identify such "second generation reforms" and to facilitate their implementation in an environment characterized by multiple market imperfections. 5.3. L a n d redistribution
Compared to the volume of resources that has been spent since the 1960s on land reform programs, the effort invested in monitoring their performance and in assessing their impact on poverty reduction and agricultural productivity has been minuscule. As a consequence, evidence on promising models of land reform in hacienda systems and the long-term impact associated with them is extremely limited. Little or no guidance exists on how to compare the effectiveness of different approaches to land reform in (i) reaching specific target groups, (ii) helping these groups to complement land ownership with other investments and thereby increase agricultural productivity, and (iii) enabling them to convert the one-time transfer of land into a sustained improvement in their livelihood. Such evidence will be critical in assessing whether these new approaches to marketassisted land reform are fiscally, socially, and economically sustainable. Given the recent emphasis in the theoretical literature on asset ownership as a means for sustainable poverty reduction, it would be of great interest to carefully monitor innovative land reform efforts with a view toward drawing the necessary policy conclusions. Issues to be explored include the volume and price of land (sales and rental) transactions, characteristics of participants, and the productivity change associated with land transactions within and outside a specific land reform program. Complementing this with longitudinal information on changes in welfare of specific beneficiaries and the population at large would provide an opportunity to assess the equity impact of land
324
K. Deininger and G. Feder
reform and ultimately compare this type of intervention to other policies aimed at the same goal.
References Allen, D.W. (1991), "Homesteading and property rights; Or, 'how the west was really won", Journal of Law and Economic 34:1-23. Alston, L.J., G.D. Libecap and R. Schneider (1995), "Property rights and the preconditions for markets: The case of the Amazon Frontier", Journal of Institutional and Theoretical Economics 151(1):89-111. Alston, L.J., G.D. Libecap and R. Schneider (1996), "The determinants and impact of property rights: Land titles on the Brazilian Frontier", Journal of Law, Economics & Organization 12(1):25-61. Andre, C., and J.-E Platteau (1996), "Land relations under unbearable stress: Rwanda caught in the Malthusian trap" (Centre de Recherche en Economie du Development (CRED), Namur, Belgium). Appu, ES. (1996), Land Reforms in India. A Survey of Policy, Legislation and Implementation (Vikas Publishing House, New Delhi). Atwood, D.A. (1990), "Land registration in Africa: The impact on agricultural production", World Development 18:659-671. Auty, R.M. (1997), "Natural resource endowment, the state and development strategy", Journal of International Development 9:651-663. Baland, J.-M., E Gaspart, E Place and J.-P. Platteau (1999), "Poverty, tenure security and access to land in Central Uganda: The role of market and non-market processes", mimeo (CRED Dept. of Economics, University of Namur). Baland, J.-M., and J.-R Platteau (1996), Halting Degradation of Natural Resottrces: Is There a Role for Rural Communities? (Oxford University Press, Clarendon Press). B aland, J.-M., and J.-R Platteau (1997a), "Coordination problems in local-level resource management", Journal of Development Economics 53(1): 197-210. Baland, J.-M., and J.-E Plattean (1997b), "Wealth inequality and efficiency in the commons, Part I: The unregulated case", Oxford Economic Papers 49:451-482. Baland, L-M., and J.-R Plattean (1998), "Wealth inequality and efficiency in the commons, Part II: The regulated case", Oxford Economic Papers 50(1):1-22. Balcazar, A. (1990), "Tanafio de finca, dinamica tecnologia y rendimientos agricolas", Coyuntura Agropecuaria 7(3): 107-125. Banerjee, A., E Gertler and M. Ghatak (1998), "Empowerment and efficiency: The economics of agrarian reform", mimeo (Dept. of Economics, Massachusetts Institute of Technology). Banerjee, A.V., and A.E Newman (1991), "Risk-bearing and the theory of income distribution", Review of Economic Studies 58:211-235. Banerjee, A.V., and A.E Newman (1993), "Occupational choice and the process of development", Journal of Political Economy 101(2):274-298. Banerjee, A., D. Mookherjee, K. Munshi and D. Ray (1997), "Inequality, control rights and rent seeking a theoretical and empirical analysis of sugar cooperatives in Maharashtra", mimeo (Boston University). Bardhan, P., S. Bowles and H. Gintis (1997), Wealth Inequality, Wealth Constraints and Economic Performance (University of Massachusetts, Amherst). Barham, B.L., S. Boucher and M.R. Carter (1996), "Credit constraints, credit unions, and small-scale producers in Guatemala", World Development 24(5):793-806. Barham, B.L., M.R. Carter and W. Sigelko (1995), "Agro-export production and peasant land access: Examining the dynamic between adoption and accumulation", Journal of Development Economics 46:85-107. Barraclough, S.L. (1970), "Agricultural policy and land reform", Journal of Political Economy 906-947. Barrett, C.B. (1996), "On price risk and the inverse farm size - productivity relationship", Journal of Development Economics 51:194-215.
Ch. 6:
Land Institutions and Land Markets
325
Baruah, S. (1990), "The end of the road in land reform? Limits to redistribution in West Bengal", Development and Change 21:119-146. Basu, K. (1986), "Market for land: An analysis of interim transactions", Journal of Development Economics 20:163-177. Bell, C. (1977), "Alternative theories of sharecropping: Some tests using evidence from Northeast India", Journal of Development Studies 13:317-346. Benjamin, D. (1992), "Household composition, labor markets, and labor demand: Testing for separability in agricultural household models", Econometrica 60:287-322. Benjamin, D. (1995), "Can unobserved land quality explain the inverse productivity relationship?", Journal of Development Economics 46:51-84. Berry, R.A., and W.R. Cline (1979), "Agrarian structure and productivity in developing countries" (International Labor Organization, Geneva). Besley, T. (1995), "Property rights and investment incentives: Theory and evidence from Ghana", Journal of Political Economy 103(5):903-937. Besley, T., and R. Burgess (1998), "Land reform, poverty reduction, and growth: Evidence from India", mimeo, LSE. Bhalla, S.S., and R Roy (1988), "Mis-specification in farm productivity analysis: The role of land quality", Oxford Economic Papers 40:55-73. Bidinger, RD., T.S. Walker, B. Sarkar, A.R. Murty and E Babu (1991), "Consequences of mid-1980s drought: Longitudinal evidence from Mahbnhnagar", Economic and Political Weekly 26:A105-A114. Binswanger, H.R, and K. Deininger (1997), "Explaining agricultural and agrarian policies in developing countries", Journal of Economic Literature 35(4): 1958-2005. Binswanger, H.E, K. Deininger and G. Feder (1995), "Power, distortions, revolt and reform in agricultural land relations", in: J. Behrman and T.N. Srinivasan, eds., Handbook of Development Economics, Vol. 1II. Binswanger, H.E, and M. Elgin (1988), "What are the prospects for land reform", in: A. Maunder and A. Vald6s, eds., Agriculture and Governments in an Interdependent World, Proceedings of the Twentieth International Conference of Agricultttral Economists 1988. Binswanger, H.E, and M.R. Rosenzweig (1986), "Behavioral and material determinants of production relations in agriculture", Journal of Development Studies 22:503-539. Bird, R. (1974), Taxing Agricultural Land in Developing Countries (Harvard University Press, Cambridge, MA). Birdsall, N., and J.L. Londofio (1997), "Asset inequality matters: An assessment of the world bank's approach to poverty reduction", American Economic Review 87(2):32-37. Blarel, B., E Hazell, E Place and J. Quiggin (1992), "The economics of farm fragmentation: Evidence from Ghana and Rwanda", World Bank Economic Review 6:233-254. Boserup, E. (1965), Conditions of Agricultural Growth: The Economics of Agrarian Change Under Population Pressure (Aldine, New York). Bowles, S., and H. Gintis (1994), "Escaping the efficiency-equity tradeoff: Productivity enhancing asset redistributions", in: Macroeconomic Policy after the Conservative Era: Research on Investment, Savings, and Finance (Cambridge University Press, Cambridge). Brandao, A.S.R, and G.C. de Rezende (1992), "Credit subsidies, inflation and the land market in Brazil: A theoretical and empirical analysis", mimeo (World Bank, Washington). Brasselle, A.-S., G. Frederic and J.-E Platteau (1997), "Land tenure security and investment incentives: Some further puzzling evidence from Burkina Faso" (CRED, Namur, Belgium). Brockett, C.D. (1990), Land, Power, and Poverty. Agrarian Transformation and Political Conflict in Central America (Unwin Hyman, Boston). Brooks, K., and Z. Lerman (1994), "Land reform and farm restructuring in Russia", World Bank Discussion Paper 233 (Washington, DC). Bruce, J.W. (1988), "A perspective on indigenous land tenure systems and land concentration", in: R.W. Downs and S.E Reyna, eds., Land and Society in Contemporary Africa (For University of New Hampshire by University Press of New England, Hanover and London).
326
K. Deininger and G. Feder
Bruce, J.W., and S. Migot-Adholla (1994), Searching for Land Tenure Security in Africa (Kendall Hunt Publishing Company, Dubuque, IA). Burgess, R. (1998), "Land, welfare and efficiency in Rural China", mimeo (London School of Economics). Cain, M. (1981), "Risk and insurance: Perspectives on fertility and agrarian change in India and Bangladesh", Population and Development Review 7:435-474. Callison, C.S. (1983), Land to the Tiller in the Mekong Delta: Economic, Social and Political Land Reform in Four Villages of South Vietnam (University Press of America, Bloomington, IN). Cairo, G.A., and S. Wellisz (1978), "Supervision, loss of control, and the optimum size of the firm", Journal of Political Economy 86:943-952. Carter, M.R. (1984), "Identification of the inverse relationship between farm size and productivity: An empirical analysis of peasant agricultural production", Oxford Economic Papers 36:131-145. Carter, M.R., and B.L. Barham (1996), "Level playing fields and laissez faire: Postliberal development strategy in inegalitarian agrarian economies", World Development 24(0): 1-17. Carter, M.R., and D. Mesbah (1993), "Can land market reform mitigate the exclusionary aspects of rapid agro-export growth?", World Development 21(7): 1085-1100. Carter, M.R., and P. Olinto (1996), "Does land titling activate a productivity-promoting land market? Econometric evidence from rural Paraguay" (University of Wisconsin-Madison). Carter, M.R, L. Shouying, M. Roth and Y. Yao (1996), "An induced institutional innovation perspective on the evolution of property rights in post-reform rural China", mimeo (University of Wisconsin-Madison). Carter, M.R., and K.D. Wiebe (1990), "Access to capital and its impact on agrarian structure and productivity in Kenya", American Journal of Agricultural Economics 72:1146-1150. Carter, M.R., and E. Zegarra (1995), "Reshaping class competitiveness and the trajectory of agrarian growth with well-sequenced policy reform", Agricultural Economics Staff Paper Series No. 379 (University of Wisconsin-Madison). Chenng, N.S. (1969), The Theory of Share Tenancy (University of Chicago Press, Chicago). Collier, E (1989), "Contractual constraints on labour exchange in rural Kenya", International Labour Review 128:745-768. Cramb, R.A. (1993), "The evolution of property rights to land in Sarawak: An institutionalist perspective", Review of Marketing and Agricultural Economics 61(2):289-300. De Alessi, L. (1980), "The economics of property rights: A review of the evidence", Research in Law and Economics 2:1-47. De Janvry, A., and E. Sadoulet (1989), "A study in resistance to institutional change: The lost game of Latin American land reform", World Development 17:1397-1407. De Meza, D., and J. R. Gould (1992), "The social efficiency of private decisions to enforce property rights", Journal of Political Economy 100:561-580. Deininger, K. (1995), "Collective agricultural production: A solution for transition economies?", World Development 23(8): 1317-1334. Deininger, K. (1998), "Making negotiated land reform work: Initial experience from Brazil, Colombia, and South Africa", World Development, forthcoming. Deininger, K., P. Olinto, M. Wamulume and D. Chiwele (1998), "Agricultural sector performance in a postreform environment: Implications for second-generation reforms in Zambia", mimeo (World Bank, Washington, DC). Dercon, S. (1996), "Risk, crop choice, and savings: Evidence from Tanzania", Economic Development and Cultural Change 44(3):485-513. Dercon, S., and P. Kfishnan (1996), "Income portfolios in rural Ethiopia and Tanzania: Choices and constraints", The Journal of Development Studies 32(6):850-875. Dong, X.-Y. (1996), "Two-tier land tenure system and sustained economic growth in post-1978 rural China", World Development 24(5):915-928. Dorner, P., and W.C. Thiesenhusen (1990), "Selected land reforms in East and Southeast Asia: Their origins and impacts", Asian Pacific Economic Literature 4:69-95.
Ch. 6:
Land Institutions and Land Markets
327
Downs, R.W., and S.R Reyna, eds. (1993), Land and Society in Contemporary Africa (For University of New Hampshire by University Press of New England, Hanover and London). Dujon, V. (1997), "Communal property and land markets: Agricultural development policy in St. Lucia", World Development 25 (9): 1529-1540. Eckstein, Z., and I. Zilcha (1994), "The effects of compulsory schooling on growth income distribution and welfare", Journal of Public Economics 54:339-359. Ellickson, R.C. (1993), "Property in land", Yale Law Journal 102(6):1315-1400. Ensminger, J. (1997), "Changing property rights: Reconciling formal and informal rights to land in Africa", in: J.N. Drobak and J.V.C. Nye, eds., The Frontiers of the New Institutional Economics (Academic Press, San Diego, Harcourt Brace). Eswaran, M., and A. Kotwal (1985a), "A theory of two-tier labor markets in agrarian economies", American Economic Review 75:162-177. Eswaran, M., and A. Kotwal (1985b), "A theory of contractual structure in agriculture", American Economic Review 75:352-367. Eswaran, M., and A. Kotwal (1986), "Access to capital and agrarian production organization", Economic Journal 96:482-498. Fafchamps, M., and J. Pender (1997), "Precautionary saving, credit constraints, and irreversible investment: Theory and evidence from semi-arid India", Journal of Business and Economic Statistics 15(2): 180-194. Feder, G. (1985), "The relation between farm size and farm productivity: The role of family labor, supervision, and credit constraints", Journal of Development Economics 18:297-313. Feder, G., et al. (1989), "Agricultural credit and farm performance in China", Journal of Comparative Economics 13(4):508-526. Feder, G., and D. Feeney (1991), "Land tenure and property rights: Theory and implications for development policy", World Bank Economic Review 5:135-155. Feder, G., and A. Nishio (1996), "The benefits of land registration and titling: Economic and social perspectives" (The World Bank). Feder, G., T. Onchan, Y. Chalamwong and C. Hangladoran (1986), Land Policies and Farm Productivity in Thailand (Johns Hopkins University Press, Baltimore, MD). Feder, G., and N. Raymond (1987), "Land rights systems and agricultural development in Sub-Saharan Africa agriculture and rural development", Dept. RU Paper 64 (Washington, DC). Feeney, D. (1988), "The development of property rights in land: A comparative study", in: R.H. Bates, ed., Toward a Political Economy of Development: A Rational Choice Perspective (University of California Press, Berkeley). Feldstein, M. (1980), "Inflation, portfolio choice, and the prices of land and corporate stock", American Journal of Agricultural Economics 62:910-916. Foster, A.D., and M.R. Rosenzweig (1996), "Comparative advantage, information and the allocation of workers to tasks: Evidence from an agricultural labor market" (University of Pennsylvania). Frisvold, G.B. (1994), "Does supervision matter? Some hypothesis tests using Indian farm-level data", Journal of Development Economics 43:217-238. Fujimoto, A. (1988), "The economics of land tenure and rice production in a double-cropping village in Southern Thailand", Developing Economies 26:189-211. Galor, O., and J. Zeira (1993), "Income distribution and macroeconomics", Review of Economic Studies 60:35-52. Gavian, S., and M. Fafchamps (1996), "Land tenure and allocative efficiency in Niger", American Journal of Agricultural Economics 78:460-471. Geertz, C. (1968), "Agricultural involution: The process of ecological change in Indonesia" (For the Association of Asian Studies by University of California Press, Berkeley). Glaeser, E.L. (1996), "The incentive effects of property taxes on local governments", Public-Choice 89(12):93-111. Glover, D. (1990), "Contract fanning and outgrower schemes in East and Southern Africa", Journal of Agricultural Economics 41:303-315.
328
K. Deininger and G. Feder
Gordillo, G., A. de Janvry and E. Sadoulet (1997), "Mexico's second agrarian reform: Household and community responses. 1990-1994" (La Jolla, Calif. Center for U.S.-Mexican Studies, University of California, San Diego). Guinnane, T.W., and R.I. Miller (1997), "The limits to land reform: The land acts in Ireland, 1870-1909", Economic Development and Cultural Change 45(3):591-612. Gunjal, K., S. Williams and R. Romain (1996), "Agricultural credit subsidies and farmland values in Canada", Canadian Journal of Agricultural Economics 44(1):39-52. Hayami, Y., L.S. Adriano, Y. Quisumbing and M.A.R. Quisumbing (1990), Toward an Alternative Land Reform Paradigm, A Philippine Perspective (Ateneo de Manila University Press, Manila). Hayami, Y., and K. Otsuka (1993), The Economics of Contract Choice: An Agrarian Perspective (Oxford University Press, Clarendon Press, Oxford, New York). Hoff, K. (1991), "Land taxes, output taxes, and sharecropping: Was Henry George right?", World Bank Economic Review 5:93-111. Horowitz, A.W. (1993), "Time paths of land reform: A theoretical model of reform dynamics", The American Economic Review 83(4): 1003-1010. Jalan, J., and M. Ravallion (1997), "Are the poor less well insured? Evidence on vulnerability to income risk in rural China", mimeo (The World Bank). Jensen, M.C., and W.H. Meckling (1976), "Theory of the firm: Managerial behavior, agency costs, and ownership structure", Journal of Financial Economics 3:305-360. Joakin, J. (1996), "The impact of structural adjustment and property rights conflicts on Nicaraguan agrarian reform beneficiaries", World Development 24(7): 1179-1191. Jodha, N.S. (1990), "Rural common property resources: Contributions and crisis", Economic and Political Weekly 25:A65-A78. Just, R.E., and J.A. Miranowski (1989), "U.S. land prices: Trends and determinants", in: A. Maunder and A. Vald6s, eds., Agriculture and Governments in an Interdependent World, Proceedings of the Twentieth International Conference of Agricultural Economists 1988. Kevane, M. (1996), "Agrarian structure and agricultural practice: Typology and application to Western Sudan", American Journal of Agricultural Economics 78(1):236-245. Kevane, M., and B. Wydick (1998), "Social norms and the time allocation of women's labor in Burkina Faso", mimeo. Key, N., C. Mufioz-Pifia, A. de Janvry and E. Sadoulet (1998), "Social and environmental consequences of the Mexican reforms: Common pool resources in the Ejido sector" (Department of Agricultural and Resource Economics, University of California-Berkeley). King, R. (1977), Land Reform: A World Survey (G. Bell and Sons, London). Koo, A.Y.C. (1968), Land Reform and Economic Development: A Case Study of Taiwan (Praeger, New York). Kranton, R.E., and A.V. Swamy (1997), "The hazards of piecemeal reform: British civil courts and the redit market in colonial India" (World Bank, Washington, De). Kung, J.K. (1995), "Equal entitlement versus tenure security under a regime of collective property rights: Peasants' preference for institutions in post-reform Chinese agriculture", Journal of Comparative Economics 21:82-111. Kntcher, G.R, and EL. Scandizzo (1981), "The agricultural economy of northeast Brazil" (World Bank, Washington, De). Laffont, J.-J., and M.-S. Matoussi (1995), "Moral hazard, financial constraints and sharecropping in E10ulja", Review of Economic Studies 62(3):381-399. Lastarria-eornhiel, S. (1997), "Impact of privatization on gender and property rights in Africa", World Development 25(8):1317-1333. Lieten, G.K. (1996), "Land reforms at centre stage: The evidence on West Bengal", Development and Change 27:111-130. Lin, J.Y. (1992), "Rural reforms and agricultural growth in China", American Economic Review 82:34-51. Lin, J.Y., E Cai and Z. Li (1994), "Why China's economic reforms have been successful: Its implications for other reforming economies" (Peking University and the Chinese Academy of Social Sciences).
Ch. 6:
Land Institutions and Land Markets
329
Liu, S., and M.R. Carter (1996), "Dimensions and diversity of property rights in rural China: Dilemmas on the road to further reform", World Development 26(10): 1789-1806. Malik, A., and R.M. Schwab (1991), "Optimal investments to establish property rights in land", Journal of Urban Economics 29:295-309. McCarthy, N., A. de Janvry and E. Sadoulet (1998), "Land allocation under dual individual-collective use in Mexico", Journal of Development Economics 56:239-264. McCloskey, D.N. (1975), "The persistence of English common fields", in: W. Parker and E. Jones, eds., European Peasants and their Markets (Princeton University Press, Princeton, NJ). McCloskey, D.N. (1991), "The prudent peasant: New findings on open fields", Journal of Economic History 51(2):343-355. McMillan, J., J. Whalley and L. Zhu (1989), "The impact of China's economic reforms on agricultural productivity growth", Journal of Political Economy 97:781-807. Mearns, R. (1996), "Community, collective action and common grazing: The case of post-socialist Mongolia", Journal of Development Studies 32(3):297-339. Migot-Adholla, S., et al. (1991), "Indigenous land rights systems in Sub-Saharan Africa: A constraint on productivity?", World Bank Economic Review (International) 5:155-175. Moene, K.O. (1992), "Poverty and landownership", American Economic Review 82:52-64. Mookherjee, D. (1997), "Informational rents and property rights in land", in: J. Roemer, ed., Property Rights, Incentives & Welfare (Macmillan Press). Morooka, Y., and Y. Hayami (1989), "Contract choice and enforcement in an agrarian community: Agricultural tenancy in Upland Java", Journal of Development Studies 26(1):28-42. Mueller, B. (1997), "Property rights and the evolution of a frontier", Land Economics 73(1):42-57. Nagarajan, G., M.A. Quisumbing and K. Otsuka (1991), "Land pawning in the Philippines: An exploration into the consequences of land reform regulations", Developing Economies 29:125-144. Newbery, D.M.G., and J.E. Stiglitz (1979), "Sharecropping, risk sharing and the importance of imperfect information", in: J.A. Roumasset et al., eds., Risk, Uncertainty, and Agricultural Development (Agricultural Development Council). Newell, A., P. Kiran and S. James (1997), "Farm size and the intensity of land use in Gujarat", Oxford Economic Papers 49:307-315. Nugent, J., and N. Sanchez (1993), "Tribes, chiefs, and transhurnance: A comparative institutional analysis", Economic Development and Cultural Change 42( 1): 87-113. Olinto, EV. (1995), "Land quality and the inverse relationship between farm size and productivity: A panel data analysis of Paraguayan farm households" (Department of Agricultural Economics, University of Wisconsin-Madison). Olson-Lanjouw, J. (1995), "Information and the operation of markets: Tests based on a general equilibrium model of land leasing in India", Economic Growth Center Discussion Paper No. 727 (Yale University). Otsuka, K. (1991), "Determinants and consequences of land reform implementation in the Philippines", Journal of Development Economics 35:339-355. Otsuka, K., H. Chuma and Y. Hayami (I992), "Land and labor contracts in agrarian economies: Theories and facts", Journal of Economic Literature 30(4): 1965-2018. Otsuka, K., C. Hiroyuki and Y. Hayami (1993), "Permanent labour and land tenancy contracts in agrarian economies: An integrated analysis", Economica 60(237):57-77. Pender, J.L. and J.M. Kerr (1996), "The effect of transferable land rights on credit, land investment and use: Evidence from South India", mimeo. Pinckney, T.C., and EK. Kimuyu (1994), "Land tenure reform in East Africa: Good, bad or unimportant?", Journal of African Economies 3(1): 1-28. Platteau, J.-E (1996), "The evolutionary theory of land rights as applied to Sub-Saharan Africa: A critical assessment", Development and Change 27:29-86. Platteau J.-E (1999), "Inta-a-family exclusionary processes in access to land-with special reference to Europe and Sub-Saharan Africa", in: A. de Janvry, E. Sadoulet and J.-E Platteau, eds., Land Reform Revisited: Access to Land, Rural Poverty, and Public Action (Oxford University Press) forthcoming.
330
K. Deininger and G. Feder
Quibria, M.G., and S. Rashid (1984), "The puzzle of sharecropping: A survey of theories", World Development 12:103-114. Reid, J.D. (1976), "Sharecropping and agricultural uncertainty", Economic Development and Cultural Change 24:549-576. Robertson, A.E (1982), "Abusa: The structural history of an economic contract", Journal of Development Studies 18(4):447-478. Rosenzweig, M.R., and H.E Binswanger (1993), "Wealth, weather risk and the composition and profitability of agricultural investments", Economic Journal 103:56-58. Rosenzweig, M.R., and K.I. Wolpin (1993), "Credit market constraints, consumption smoothing and the accumulation of durable production assets in low-income countries: Investments in bullocks in India", Journal of Political Economy 101:223-244. Rozelle, S., L. Guo and L. Brandt (1996), "Land tenure, property rights, and productivity in China's agricultural sector" (Food Research Institute, Stanford University). Sadoulet, E., A. de Janvry and S. Fukui (1997), "The meaning of kinship in sharecropping contracts", American Journal of Agricultural Economics 79:394-406. Sadoulet, E., S. Fukui and A. de Janvry (1994), "Efficient share tenancy contracts under risk: The case of two rice-growing villages in Thailand", Journal of Development Economics 42:243-269. Sarap, K. (1990), "Factors affecting small farmers access to institutional credit in rural Orissa, India", Development and Change 21:281-307. Schiff, M., and A. Valdrs (1995), "The plundering of agriculture in developing countries", Finance and Development 32(1):44-47. Scott, M.E, J.D. MacArthur and D.M.G. Newbery (1976), Project Appraisal in Practice: The Little-Mirrlees Method Applied in Kenya (Heinemann Educational Books, London). Sen, A.K. (1981), "Market failure and control of labour power: Towards an explanation of structure and change in Indian agriculture, Parts 1 and 2", Cambridge Journal of Economics 5(3):201-228, Part 1; 5(4):327-350, Part 2. Sengupta, K. (1997), "Limited liability, moral hazard and share tenancy", Journal of Development Economics 52:393-407. Shaban, R.A. (1987), "Testing between competing models of sharecropping", Journal of Political Economy 95:893-920. Shaban, R.A. (1991), "Does the land tenancy market equalize holdings?", Working Paper (University of Pennsylvania). Shearer, E.B., and B. Ginseppe (1993), "Public policy for the promotion of family farms in Italy" (The World Bank). Shetty, S. (1988), "Limited liability, wealth differences and tenancy contracts in agrarian economics", Journal of Development Economics 29:1-22. Siamwalla, A. et al. (1990), "The Thai rural credit system: public subsidies, private information, and segmented markets", World Bank Economic Review 4:271-295. Sjaastad, E., and D. Bromley (1997), "Indigenous land rights in Sub-Saharan Africa: Appropriation, security and investment demand", World Development 25(4):549-562. Skoufias, E. (1991), "Land tenancy and rural factor market imperfections revisited", Journal of Economic Development 16:37-55. Skoufias, E. (1995), "Household resources, transaction costs, and adjustment through land tenancy", Land Economics 71(1):42-56. Southgate, E., R. Sierra, and L. Brown (1991), "The causes of tropical deforestation in Ecuador: A statistical analysis", World Development 19:1145-1151. Stiglitz, J.E., and A. Weiss (1981), "Credit rationing in markets with imperfect information", American Economic Review 7l :393-409. Strasma, J., J. Alsm, E. Shearer and A. Woldstein (1987), "Impact of agricultural land revenue systems on agricultural land usage", mimeo (Land Tenure Center, Madison, WI).
Ch. 6:
Land Institutions and Land Markets
331
Townsend, R.M. (1993), The Medieval Village Economy: A Study of the Pareto Mapping in General Equilibrium Models (Princeton University Press, Princeton, NJ). Townsend, R.M. (1994), "Risk and insurance in village India", Econometrica 62(3):539-591. Townsend, R.M. (1995), "Consumption insurance: An evaluation of risk-bearing systems in low-income economies", Journal of Economic Perspectives 9(3):83-102. Turner, M.A., L. Brandt and S. Rozelle (1998), "Property fights formation and the organization of exchange and production in rural China", mimeo. Udry, C. (1995), "Recent advances in empirical microeconomic research in poor countries" (Northwestern University). Udry, C. (1996), "Gender, agricultural production, and the theory of the household", Journal of Political Economy 104(5):1010-1046. Umbeck, J. (1977), "The California gold rush: A study of emerging property fights", Explorations in Economic History 14(3): 197-226. Wilson, P.N., and G.D. Thompson (1993), "Common property and uncertainty: compensating coalitions by Mexico's Pastoral Ejidatarios", Economic Development and Cultural Change 41(2):299-318. Yao, Y. (1996), "Three essays on the implications of imperfect markets in rural China", Ph.D. (University of Wisconsin). Zimmerman, E, and M.R. Carter (1996a), "Dynamic portfolio management under risk subsistence constraints in developing countries" (Food Research Institute, Stanford University). Zimmemlan, E, and M.R. Carter (1996b), "Rethinking the demand for institutional innovation: Land fights and markets in the West African Sahel" (Stanford University).
Chapter 7
HUMAN CAPITAL: EDUCATION AND AGRICULTURE WALLACE E. HUFFMAN Department of Economics, Iowa State University, Ames, 1A
Contents
Abstract Keywords 1. A conceptual framework 1.1. Overview 1.2. Agricultural household models 1.2.1. A three-period model with human capital production and investment 1.2.2. A one-period static model 1.3. More about agriculture
2. Empirical evidence 2.1. Choices about where to work 2.2. Technology adoption and information acquisition 2.3. Agricultural production 2.4. Total factor productivity decomposition 2.5. Household income
3. Summary and research gaps Acknowledgements References
Handbook of Agricultural Economics, Volume 1, Edited by B. Gardner and G. Rausser © 2001 Elsevier Science B.V. All rights reserved
334 334 335 335 337 338 344 346 347 347 354 359 365 368 372 376 376
334
~ E. Huffman
Abstract This chapter presents a review and synthesis of effects of education in agriculture, summarizes major contributions, and suggests major research gaps in the literature. Although growth in knowledge enables skill acquisition and specialization of labor, which generally raises labor productivity, and technical change, the dominant effect on agriculture has been technical change. A puzzle remains why schooling does not have broader direct impacts in agriculture. Furthermore, as we proxy education or general intellectual achievement by schooling in our empirical research, this has led to biased interpretations of impacts when general intellectual achievement of school graduates changes over time and perhaps in nonlinear ways.
Keywords education, schooling, agriculture, human capital, impact analysis
JEL classification: Q 12
Ch. 7: Human Capital: Education and Agriculture
335
Education is widely considered to be the most important form of human capital [Becket (1993, pp. 1-13)]. A major part of formal education or general intellectual achievement is obtained in elementary and secondary schools and in colleges/universities. Although there are differences in exactly what these institutions teach in different parts of the world, common components are skills, knowledge, and a method of analyzing problems [Schultz (1963, pp. 1-19), Becker (1993, pp. 1-13), Bishop (1989)]. Investments of students' and teachers' time and other inputs are used in the schooling process, and schooling of an individual beyond the permanent literary level, which is generally three to four years of formal schooling, has lifetime impacts on almost all of his or her activities. These are widely accepted to include labor productivity and wage rates, but also include choices of occupation, geographical location, information acquisition, and technology. In agriculture, the returns to schooling seem to increase substantially as a country goes from traditional agriculture to modernizing, which creates a dynamic technical and economic environment requiring information acquisition, technology evaluation, and adjustments to change [Schultz (1964), Schultz (1975), Becker (1993, pp. 1-13)]. The objective of this paper is to present a review and synthesis of the broad effects of education on agriculture and to summarize where major contributions lie and where major gaps exist in the literature. The first section presents a conceptual framework for education's contribution. The second section reviews and synthesizes the empirical evidence which is organized around the topics of (1) choices about where to work, (2) technology adoption and information acquisition, (3) agricultural production, (4) agricultural productivity decomposition, and (5) household income. The third section presents a summary of major contributions and research gaps in the literature.
1. A conceptual framework 1.1. O v e r v i e w
Growth in knowledge seems to be a major factor causing the long-term rise in labor productivity, real wage rates, and per capita incomes in market economies. First, as the stock of knowledge grows, the opportunities for individuals to invest in specialized knowledge (e.g., schooling, training) that raises their productivity occurs [Becker and Murphy (1993), Jones (1998, pp. 71-87)]. Hence, the returns to labor's specialization arise through workers taking on narrower and more specialized tasks, but to get output produced, this means that a group of workers having different skills must cooperate together. "Team production" within or across firms raises special incentive problems [Gibbons (1998), Becker and Murphy (1993)]. As the degree of specialization of labor and tasks increases, the number of different tasks and specialists that must be coordinated increases. For the continuation of this growth process emphasizing knowledge accumulation and specialization, an economy must find new ways to reduce team-labor coordinating costs. Economies that have high coordination/transaction costs because of a weak economic exchange system (i.e., absence of private property, weak contracts,
336
W.E. H uffrnan
suppressed prices and markets) reduce the incentives for workers and firms to specialize, given any stock of knowledge, and reduce labor productivity and per capita incomes [Williamson (1985)]. Second, as the stock of knowledge grows, the opportunities to produce new technologies that become embodied in new capital goods [e.g., Romer (1990)] and intermediate goods [see Jones (1998, pp. 88-107), Huffman and Evenson (1993)] occur. These innovations are frequently adopted in manufacturing, agriculture, and other sectors. Considerable evidence exists for the United States that unskilled labor and capital services are substitutes in manufacturing, but skilled labor and capital services are complements [see Orazem et al. (1997), Griliches (1969, 1970)]. More generally, capital services and labor become less substitutable as the skills of labor increase, and labor and capital services eventually become complements, especially for college trained labor. This means that as knowledge and technology advance, the demand for skilled (more highly educated) labor grows relative to the demand for less skilled (less educated) labor, and the potential exists for a rise in the real (and relative) wage of skilled labor. Production on farms is one of biological processes, but major differences exist between crop and livestock production. The seasonal and spatial nature of crop production places severe constraints on large-scale or specialized units and mechanized production. With plant biological (clocks) processes sequenced by day length and temperature, little opportunity exists to use mechanization to speed up the production processes, even on large farms. Because planting and harvesting for any given crop must occur within a narrow time window at any location, a major limit to size of specialized enterprises occurs. Crop rotation, or nonspecialized production, has historically been one important method for controlling pest and disease problems in crops and balancing soil nutrient availability with plant nutrient needs. Chemical and biological control of pests and chemical fertilizer applications are relatively new technological alternatives to crop rotation, and they have facilitated crop specialization. Because plants occupy fixed land area as they grow, machines suitable for mechanization of crop production must be mobile and move across the fields or through plant materials that are fixed in location. Furthermore, machines must be small relative to plot or field sizes. Thus, a special type of mechanization is required for crops. This contrasts with industrial (and livestock) production where the production plant is fixed and materials move through it. The latter type of production permits workers to become specialized in one phase of the total production process and this has aided labor productivity in the industrial sector of developed countries. It is difficult for workers in crop production to be fully employed and to specialize in any phase of production. Livestock production is relatively free of constraints due to seasonal and spatial attributes. It is economically feasible to speed up or slow the rate of production by changing the diet and activity level of animals during the growing and finishing phases. Production can be organized in sequential phases where all phases from birth to finishing occur on one farm or where different farms specialize in different phases. Advances in animal health products, animal feeding, housing and equipment, and management have made it technically possible to speed up the growing and finishing phases by using large
Ch. 7: Human Capital: Education and Agriculture
337
confined animal production systems which greatly increase animal densities and populations. To further reduce disease problems in large animal confined systems, animals of different ages can be segregated and raised apart in "all-in, all-out" systems. With the growing and finishing of animals and birds in a facility in phased groups, livestock production becomes similar to production of industrial goods where workers have the opportunity to specialize in a particular phase of production. When firms are heterogeneous within a sector or have some specialized resources - e.g., land, climate, knowledge - the potential impact of new technologies will differ across them. It is costly for entrepreneurs to acquire information, evaluate the available technologies, and adopt only the new ones that are expected to make them better off. Considerable evidence exists that schooling of entrepreneurs becomes a valuable skill when the technology is changing, for example when agriculture undergoes a transition from traditional to modernizing [Schultz (1975), Becker (1993), Huffman (1998)]. l 1.2. Agricultural household models
The behavior of agricultural households has been modeled from different perspectives depending on the central issue researchers are considering. If human capital investment decisions - e.g., how much schooling, informal training, and information to obtain or whether to adopt a new technology - are the central focus, models of multi-period household utility maximization with human capital production or innovation have provided a useful guide to empirical models. If household members have obtained their human capital, e.g., formal education, and the impact of this human capital on other outcomes - e.g., occupational choice, hours of work, purchased input use, wage rates, income - is the central focus, one-period static agricultural household models have provided a useful guide to researchers about which variables are expected to affect behavior or outcomes and how they might be related. In particular, behavioral models provide one useful guide to researchers for deciding which variables should be treated as endogenous, e.g., choices, and which are exogenous or causal variables. In the following two subsections, two representative agricultural household models are outlined. One is a multi-period dynamic agricultural household model, and the other is a single-period static agricultural household model.
I Averageschooling completion levels of the adult population differ greatly across countries. Barro and Lee (1993) have recently constructed good estimates of schooling completion levels for a set of 125 countries for the period 1960-1985. They report summaries for regional groups of countries. In 1985, sub-Saharan Africa and South Asia had the lowest average schooling completion levels for adults, 2.67 and 2.81 years, respectively. In the Middle East and North Africa, the average schooling completion level was 3.51 years, and in Latin America and tile Caribbean the average was 4.47 years. In other regions, the average schooling completion level for adults was higher, 5.19 years for East Asia and the Pacific, 8.88 years for the OECD countries, and 9.17 years for centrally planned economies (excluding China). No similar international data exists on schooling completion of the farm population.
W.E.Huffman
338
1.2.1. A three-period model with human capital production and investment Building on the multiperiod household decision model of Ghez and Beeker (1975), the human capital (e.g., education) investment model of Ben-Porath (1967) and Mincer (1974, pp. 14-15), and the one-period agricultural household models of Singh et al. (1986) and Huffman (1991b), a multiperiod agricultural household focused on consumption, human capital production, farm production, and human capital service allocation is presented. To capture the main economic issues in human capital investment decisions and yet to keep the model simple enough that many of its implications are easily interpretable, I assume that the household is risk-neutral and has a three-period planning horizon or lifetime. In each period, the farm household is assumed to consume human capital services, i.e., leisure, LIj, j = t, t + 1, t -4- 2, and goods X U, and to have a well-behaved intertemporal utility function:
(1)
U = U(Llt, Xlt, Llt+l, Xlt+1, Llt+2, X2t+2).
The household faces technology constraints on the production of human capital and farm output. First, the production of the human capital in each period, i.e., the investment, is assumed to use two variable inputs: human capital services L2j from an individual's initial human capital endowment or past human capital investment, a purchased input X2j, and a fixed individual or household-specific genetic or innate ability factor A2:
Z2j = F2(L2j, X2j, A2),
F2(0, X2j, A2) = 0,
F2(L2j, O, A2)/> 0.
(2)
F2 (') exhibits decreasing returns to scale in L2 and X2. Hence, when the input prices of
Lzj and X2j are fixed to the household, the assumption of decreasing returns implies that marginal cost is rising with added ZZj. For schooling, this assumption reflects the upper limit on mental capacity of an individual to learn in each period. Second, the production of farm output is assumed to use two variable inputs and one fixed input. The variable inputs are human capital services of household members L3j and purchase inputs X3j, and the fixed input is technology and agro-climatic conditions A3:
Z3j = F3(L3j, X3j, A3).
(3)
The farm production function is assumed to exhibit decreasing return to scale in L3 and X3 in the region of an optimal solution, e.g., due to natural limitations placed on the production process by agro-climatic conditions. 2
2 If an activerental or asset marketin farmlanddoes not exist, then farmlandis part of A 3 .
Ch. 7: HumanCapital:Educationand Agriculture
339
To facilitate the modeling, human capital investments are assumed to change the quantity of human capital services available, but they do not affect the wage rate per unit of human capital service. Hence, this is a model where human capital investments augment the effective number of units of human time that are available each period rather than raising the wage per unit of actual time worked. The latter approach is the one taken by the hedonic wage literature, e.g., Mincer (1974) and Willis (1986). The household has an initial human capital endowment K°; human capital is permitted to depreciate over time at a rate 3, 0 ~< ~ < 1, due to obsolescence or wearing out, and the human capital services available to the household in each period are: t+2
L j = olKj -= ol Z [ ( 1 -- 8 ) J - t K ° + y(1
-
~)J-t-lz2j_,] ,
(4)
j-t where c¢ (> 0) is the time invariant rate of conversion of human capital stock to services, and ?/ equals 1, adjusting human capital investment (a flow) to a stock. The available human capital services are allocated among four activities: leisure L l j , human capital p r o d u c t i o n L2j, farm production L3j, and wage work L~:
Lj = LIj + L2j + L3j + Ltf,
L2j, L3j, L j ~/O.
(5)
Because human capital services allocated in any period j to human capital production, farm productions, and wage work can be zero, a non-negativity constraint is imposed on these choices. The household faces a multiperiod cash budget constraint: t+2
* Z 3j Jr- W j L j P3j
Z j=t
(l+r)'-J
3 t+2
=Z Z i=1 j=t
Pij Xij ~- Cj
+rV-
(6)
where P3~ is the (expected) price of farm output and Pij is the (expected) price of the purchased consumption goods, inputs into human capital production, or inputs into farm production, respectively. The (expected) wage rate per unit of human capital services is Wi ; c j >~0 is any fixed cost associated with the household's production or consumption activities, e.g., on licenses or fees; and r is a fixed discount rate. If Equation (3) is substituted into Equation (6), then the farm production and multiperiod budget constraints are combined into one constraint: * . w P~jF3(L3j,X3j,A3)-~ WjLj = Z3j ~ tt+2 t PijXij E T r ~ ~-Cj -~ " j=t (1 q- r) j-t i=1 ' =
(7)
The household can now be viewed as making multiperiod consumption, human capital production, farm production, and labor supply decisions by maximizing Equation (1)
W.E. Huffman
340
subject to Equations (7), (2), (4), and (5), including nonnegativity constraints. The Kuhn-Tucker first-order conditions are
O~
OU
)~j =0, r)g -t Plj --0, (1 q- r)J -t
OOP _ OU OXIj OXlj o~ [pV t A///gZ2 OL2t -- ~ \~ Z2t ~vH L2t
(9)
fl.t) ~< O,
-
(8)
j = t , t + l , t + 2,
OLlj OLIj (1 +
L2t ~ O,
t Z2 L2t (PVz2tMPL2t - )~t) ~-- O, (10)
where
pVtz2t =
- P~t+2 - - 0Z3t+2 - - - 0L3t+2 +
P3t+l OZ3t+l -OL3t+l -+ (1 + r) OL3t+~ OZ2t Wt+lC~(1 - 8) + (1 q-r) 2 '
(1 + r) 20L3t+20Z2t
Wtot _
_
(1 + r)
and
OZ2t MpZe _ OL2t' Orb
OXet
MPZx2 = OZ2t -
OX2t"
t Z9 - P2,) >.O,
t z2 X2t (PVZetMPx2, - P2t) = O,
a, -- ff ( PVtzz'+IMPZ~'+' ;)~+' OL2t+l ~r
, L2t+l ( PVzt+IMPLzt+I
) 0,
=0,
1+ r
(12)
where
P~t+2 0Z3t+2 0L3t+l. PVzzt+l = (1 q- r) 20L3t+20Z2t+l '
0,
Pv2,+aM@2,+l
OXZt+l -- ~ {p,/t AdpZ2 Xzt+l ~ -Z2,+1 .... X2,+, Odp -- ~ P3jMPZ33i . OL3j L3J(~P3~MPZ:j
TTI o,
Z2t+l ) 0,
_P2r+I ~ 1 + r / = 0,
(1 +Kjr)J-' /O, (14)
Ch. 7." HumanCapital:Educationand Agriculture Orb
OX3j -- ~ P~JMpZ33j
341
Pij (1 + r)J -t -- O,
Orb (-)U + Wj) w OL~-- ( l + r ) J -t 0,
(18)
where Y1 is output of the home good, and Y2 and Y~ are outputs produced for sale. Output Y3 may or may not be produced, so a non-negativity constraint is imposed. H is hours of farm-household work by members, and X is purchased variable inputs, which might not be used, so a non-negativity constraint is imposed. A is technology and agro-climatic conditions, and E is an education index of household decision makers. The production function permits adopting new inputs (and discarding old ones) and expanding or reducing the number of outputs produced. It also accommodates substitute or complement relationships between variable inputs, and schooling of the decision maker(s) can enhance technical efficiency. For model development, an asymmetric form of the transformation function is used: Yz = f ( Y I , Y 3 , H , X , A , E ) ,
I13>.0, X ~O.
(19)
Second, the household faces a human time constraint: T=L+H+Hm,
Hm~>0,
(20)
where total available time per production cycle T is allocated among leisure L, farmhousehold work H, and off-farm wage work Hm. A non-negativity constraint is imposed on Hm because it may be zero. Third, the household faces a cash income constraint: I = P2Y2 -~ P3Y3 + WmHm -1- V = W x X ,
(21)
where P2 and/'3 are the market prices of Y2 and Y3, Wm is the market wage rate for off-farm work, V is household nonfarm-nonlabor income net of any fixed costs associated with farm-household production, and Wx is the market price of X. All prices are assumed to be given to households, but the off-farm wage rate depends on human capital E and local economic conditions ~, i.e., Wm = W ( E , ~).
Ch. 7: HumanCapital:EducationandAgriculture
345
If Equation (19) is substituted for Y2 in Equation (21), then two of the three constraints facing the household are combined:
P2f(Y1, I13,H, X, A, E) + P3Y3 + WmHm 4- V = WxX.
(22)
The household can now be viewed as making consumption, production, and labor supply decisions (i.e., choice set C: I11, L, II3, H, X, and Hm) by maximizing Equation (17) subject to Equations (22) and (20), including the non-negativity constraints. The KuhnTucker first-order conditions are:
OU OY2 OY1 ;~at92OY1 OU - - )v2, OL {0}12)
)~l~P2~3+P3
OY2
)~ 1 P2 ~
(23) (24)
~ 0, 0
1 as typical
Ch. 12:
The Agricultural Producer." Theory and Statistical Measurement
679
For simplicity of presentation, this notation does not represent explicitly the possible presence of public inputs that cause jointness across sub-technologies, i.e., inputs that jointly affect multiple sub-technologies simultaneously. For example, the production set of each sub-technology might be described more completely by (yi, x i) E ~i (x O, z i , e) where x ° is a vector of public inputs and the detailed use of variable inputs is described by X = {x°,x 1,...,xm}.
For purposes of this chapter, such public inputs may be present but are suppressed from notation to focus on the implications of allocations that are required for production decision implementation. For notational simplicity, aggregations of the spatial and temporal allocation detail in Y and X vectors are represented by y = A Y and x = B X , respectively, where A and B are full row rank matrices of ones and zeros. The vectors y and x maintain only physical distinction of outputs and inputs. Because each sub-technology may potentially produce only one or a few physical outputs using some subset of physical inputs, this notation can be suitably collapsed to eliminate identically zero elements of Y and X and related columns of A and B. In addition to descriptions of sub-technologies, the available technology set is assumed also to be constrained by availability of allocated fixed factors such as machinery services and operator labor. For example, if sub-technologies are indexed strictly by location, then the constraints on allocated fixed factors follow ~ i zi /O, i.e., positive semidefiniteness of the matrix of cross partials. Defining aggregate netputs across firms as N = Z i lgi, it follows immediately that the four standard regularity conditions must hold at the aggregate level if they hold at the firm level:
~-j (zq) = ~ w~:(zq) = ~ i
w~:
(q) =
w:
(q);
i
Owj /Oqj = Z
Owij /Oqj >/O; i
Owj/Oqj, = Z Ovoij/Oqj, = Z Otoij:/Oqj----Owj,/Oq./; i
i
{Owj/Oq/'}={~i Owij/OqJ'[=Z{Owij/OqJ:})O'i Thus, exact aggregation preserves the four standard properties but requires knowledge of all micro variables and functions. The implication is that statistical failure of the regularity conditions must be due to either bias in aggregation of factors and characteristics or failure of the regularity conditions at the firm level. Indeed, the regularity conditions can fail at the firm level because of inapplicability of profit maximization, inappropriate (within-season) temporal aggregation, discrete start-up/shut-down decisions, imperfect capital markets (resource constraints), or errors in measurement [Just and Pope (1999)]. These reasons for failure of standard theory at the firm level have been largely explored in earlier sections. Here we focus on reasons for theoretical failure at the aggregate level assuming regularity conditions hold at the firm level. Results show how aggregation bias and failure of aggregate regularity conditions occur because of the typical approach to representing both price and non-price heterogeneity. Non-price heterogeneity occurs because of differences among firms in physical capital, technology (including farmer ability and soil productivity), information, and constraints (possibly due to government policy). If such factors are constant across firms, then their effects can be captured in constant parameters. However, investment and technology tend to change over time and differ among firms. Government restrictions change from one policy regime to another and depend on individual farm characteristics such as planting and yield histories or proximity to water resources. These differences cause firms to respond differently to changes in prices. Suppose ki represents all short-run fixed factors such as physical capital stock and embodied technologies, family labor constraints, debt constraints, and other attributes of the farm and farmer that explain differences in productivity and profits among individual producers after accounting for variable input choices and allocations of fixed factors. If each firm faces the same price vector, an accurate aggregate netput specification is Nj (q, k l . . . . . k0) : - ~ i Wj (q, ki) where ~7is the total number of firms. However, estimation of an aggregate equation of the form ~ j (q, kl . . . . . k~) is likely impractical
R.E. Just and R.D. Pope
716
both because complete firm-specific data is typically not available and because too many parameters require estimation (without considerable simplification). A feasible approach is to model the distribution of non-price factors. Where G(k) represents the joint distribution of such factors among firms, an accurate specification of aggregate netputs is Nj (q, G) = f Owj (q, k) dG(k). If this distribution has a parameter vector, say 0, then aggregate netputs follow
~j(q, O) =
f
~wj(q, k)dG(k]O).
(66)
From this result, exact aggregation and the standard regularity conditions are preserved if aggregation considers the full distribution of characteristics among firms. While a full distribution would require complete sampling of all firms, if 0 is a sufficiently short parameter vector it can be estimated from a random sample of k. Thus, (66) facilitates tractable empirical representation under heterogeneity. Aggregation is then exact aside from errors in estimating 0 so that regularity conditions are preserved. For example, if G can be represented by, say, a two-parameter distribution such as a log-normal, then the two parameters can be usefully estimated from survey data over a limited random sample of firms. Alternatively, aggregate demand is typically estimated in the form ~ j (q, k-) where kis a vector of non-price indexes. A relevant question is whether some choice of k can achieve exact aggregation, ~j (q, k) = ~ i w(q, ki), where k--(kl . . . . . k~) is an aggregate index vector of firm characteristics. Such macro indexes typically consist only of sums or means (e.g., total or per capita physical capital). Unfortunately, neither exact aggregation nor the standard regularity conditions are preserved when all moments in 0 other than the first are ignored (assuming 0 contains two or more parameters). Following (66), other moments corresponding to each of the moments in 0 are generally needed for exact aggregation. This result implies that aggregate netput specifications based on distribufioninsensitive indexes cannot, in general, represent the aggregate marginal effects of either price or non-price factors. Aggregate netput specifications based only on total, per capita, or average characteristics cannot represent aggregate marginal effects because aggregate marginal effects depend on how increments in aggregate characteristics are allocated among firms. Similarly, incomplete models depending only on single-moment indexes cannot represent the aggregate marginal effects of prices because marginal price effects depend on the distribution of non-price factors among firms. For example, consider the case where shut-down conditions vary among firms because of differences in characteristics. In such a case, both aggregation and standard regularity conditions fail [see Just and Pope (1999)]. In reality, some of the factors that differentiate farms and farmers such as management ability or soil fertility may be hard to observe. However, other public data on farm characteristics is routinely collected. For example, data on physical capital are compiled by sampling individual farms. Typically, public data report only means or totals for such
Ch. 12: The Agricultural Producer: Theory and Statistical Measurement
717
data collection efforts. Additionally reporting, say, the standard deviation and skewness would be relatively cosfless. The full data set would be useful but is usually not made available because of right-to-privacy restrictions. However, the major cost is in conducting the survey - a cost that must be incurred whether one or many moments of the distribution are reported - so a more complete reporting of the distribution appears feasible with minor costs of reporting. The results here suggest that models of production and estimates of supplies and demands could possibly be improved substantially as a result. While the above discussion considers one-dimensional differences among firms, in reality firms differ in multiple ways. Note, however, that G ( k ) represents the joint distribution of all characteristics among farms including capital structure and technology, information, constraints, farmer abilities, and farm fertility. Thus, the right-hand side of (66) considers cross-characteristic relationships among firms, e.g., between factors such as capital and family labor availability. Therefore, the result in (66) further implies that aggregate netput specifications may depend on correlations among characteristics. By implication, correlation-insensitive indexes of non-price factors cannot, in general, represent the aggregate marginal effects of either price or non-price factors [see Just and Pope (1999) for details]. These results imply that expanded data reporting efforts should focus not only on own-moments of characteristic distributions among firms, but also on cross-moments. For example, if G ( k ) follows a multivariate log normal distribution, then the mean and covariance matrix of characteristics across firms would be sufficient to facilitate exact aggregation following (66). Unfortunately, much agricultural data is reported in a way that does not reflect correlations of characteristics. This is particularly true of the relationship of productivity characteristics to environmental characteristics because these two sets of characteristics tend to be collected by independent surveys and even by independent government agencies [Just and Antle (1990); Antle and Just (1992)]. For roughly the same data collection costs, correlations could be estimated if data were indexed by farms, and efforts were made to include the same farms in samples. Apparently, more exact aggregation is possible with little additional data collection cost if data reporting efforts are sensitive to these possibilities. If so, more congruence of theory and empirical results seems likely. A similar additional generalization permits consideration of price heterogeneity. Regardless of competition, firms may face different prices because of transportation costs, volume discounts, and seasonality. 51 Where individual netputs follow w j (qi, ki), an
5! The potential magnitude of this problem is illustrated by spatial variations of output prices due to geographic variation in seasonality of crop production. For example, because of typical weather patterns, the wheat harvest in the U.S. typically starts in Texas in May and continues gradually northward to North Dakota in September. If wheat prices vary throughout the year, then southern farmers are not responding to the same price signals as northern farmers. A dramatic example of wide price variation in a single crop season was caused by the Soviet grain deals in the 1970s. As the Soviet Union bought more and more grain in 1972, wheat prices increased from $1.56 per bushel in Texas to $1.70, $1.68, $1.74, $1.81, and $1.90 in Oklahoma,
718
R.E. Just and R.D. Pope
accurate aggregate netput specification is Nj (ql . . . . . qo, Igl ..... krl) = ~-~i Wj (qi, ki ). While complete data on heterogeneity of both prices and characteristics among farms is typically not available, a tractable approach is again available if a joint distribution of prices and characteristics among firms can be estimated. Where G(q, k) represents this joint distribution, an accurate specification of aggregate netputs is Nj (G) = f rlwj(q, k ) d G ( q , k). If this distribution is parameterized by a vector 0 that can be estimated for each aggregate observation, then aggregate netputs can be represented as Nj (0) = f Owj (q, k) dG(q, k I 0), which facilitates accurate aggregation to the extent that 0 is accurately estimated. With this approach, aggregate netputs preserve homogeneity in mean and spread parameters of the price distribution; and monotonicity, symmetry and convexity are preserved in mean prices [see Just and Pope (1999)]. For other results on aggregation with price heterogeneity, see Pope and Chambers (1989). In lieu of this approach, most aggregate specifications attempt to represent netputs as functions of aggregate price indexes, q-(ql . . . . . q,7), as well as indexes of characteristics, k (kl . . . . . ko). The related problem is whether the standard linear aggregation condition, w ('q, k) = Y~i ll°i (qi, ki ), holds. Such aggregate indexes typically include only average prices or characteristics and include only one index for each price and each characteristic that differentiates individual firms. Again, more accurate aggregation is possible and standard properties are more likely to hold if the indexes used to represent prices as well as characteristics reflect all of the moments in 0 needed to differentiate the distribution of prices and characteristics among aggregate observations used for estimation. Again, because price data are collected at a disaggregated level, at least some measures of dispersion could easily be reported in addition to the simple or weighted averages now reported with no additional data collection costs and small additional reporting costs. Finally, we suggest the potential for heterogeneity of information. While a non-trivial role of information can be posed under certainty, many interesting information problems in agriculture arise under uncertainty. Agricultural producers must make decisions affecting output before uncertain output prices are known. Producers likely have different expectations for both prices and technology performance. Such heterogeneity can have important implications even under risk neutrality as demonstrated by Pope and Just (1996, 1998). Suppose the firm maximizes expected profit as in (64). Then the resulting expected netput vector of the firm can be represented by w (q, ki, Ii) where Ii denotes the information by which farmer i formulates expectations regarding production responses and uncontrolled production effects (disturbances). Assuming farmers' expectations are unbiase& an accurate specification for expected aggregate netput j is
Kansas, Nebraska, South Dakota, and North Dakota, respectively, as the harvest moved north. In 1973, prices increased from $3.04 in Texas to $3.56, $3.75, $3.80, $4.24, and $4.82 in Oklahoma, Kansas, Nebraska, South Dakota, madNorth Dakota, respectively [EconomicResearch Service (various years)]. Aggregatinginputs and outputs across these farmers based only on the national average price, one would thus expect such volatile price years to appear technically inefficient falsely even if all individual farmers are fully efficient [Chambers and Pope (1991)].
Ch. 12: TheAgricultural Producer: Theoryand Statistical Measurement
719
Nj (0) = f ~Ex [wj (q, k, I)] dG(q, k, I [ 0) where ~ i now represents an expected ag-
gregate netput and G represents a joint distribution of prices q, characteristics k, and information I over all farmers. Thus, similar conclusions follow as for other cases of heterogeneity. Characterizing the distribution of information among producers, however, is a daunting task. Only recently has work such as Wolf, Just, and Zilberman (forthcoming) attempted to characterize sources and choices of information by individual firms. However, no systematic and recurring efforts have been developed to compile such data for use in comprehensive production studies. Other studies [e.g., Just (1974)] have attempted to describe producer information by including regression functions explaining moments of subjective price or yield distributions. To date, however, these approaches have been implemented only at the aggregate level and thus introduce potential aggregation problems in information. Perhaps if other firm-level information were sufficiently complete, differences in information among firms could be inferred with these approaches. In either case, it seems that information heterogeneity is a source of aggregation bias that will be difficult to overcome empirically without more complete firm-level data. This section demonstrates several generalizations whereby congruence of theory and empirical work can be (better) achieved by better data and aggregation. In each case, empirical implementation is constrained by current data availability. The most promising step to improving aggregation appears to be generalizing data reporting to include at least second own- and cross-moments of producer characteristics. Then aggregate supply/demand specifications can be based on at least two-parameter distributions of characteristics among firms. Seemingly, reporting independent distributional data for capital, prices, government controls, and many determinants of technology (e.g., land quality) is possible with little additional public expense. On the other hand, characterization of some factors such as farmer ability and information at the firm level will likely be more difficult. 6.2. Data limitations: a call for action
That existing data seriously limits agricultural production research may be surprising given that Leontief (1971, p. 5), while president of the American Economics Association, pronounced agricultural economic data to be a model which other economic subdisciplines could/should emulate: "Official agricultural statistics are more complete, reliable, and systematic than those pertaining to any other major sector of our economy". The part of this statement that now seems implausible is related to the word "complete". Though agricultural economists' appetite for data is probably insatiable, a brief evaluation of the sources of agricultural production data is worthwhile in assessing whether Leontief's 1971 evaluation is accurate today. Secondary aggregate data for both crops and livestock are abundant. For example, data on crops include acres planted and harvested, inventories, trade, storage, disappearance, and price. Though there are differences in quality and availability, such data
720
R.E. Just and R.D. Pope
are generally available throughout the world. They are summarized annually in the U.S. Department of Agriculture's publication, Agricultural Statistics, and are available for most countries from the FAO. A second source of aggregate U.S. data is the Census of Agriculture, which is published at roughly five-year intervals. Additionally, county and state data on individual commodities and crop and livestock aggregates are widely available therein. However, individual farm data are not released by public sources because of right-to-privacy concerns. As previous sections have shown repeatedly, aggregate data is a poor substitute for disaggregated data for understanding agricultural production. This is particularly true for problems where allocations within firms over time (production stages) and space (plots) are important but unrecorded, and for problems where variation among firms is crucial (e.g., where risk and heterogeneity of characteristics are important). For example, Just and Weninger (1999) show that farm-level yield variances are from two to ten times greater than reflected by aggregate data so that most of the risk faced by individual farmers is averaged out of aggregate data, and the structure of risk facing farmers is often significantly mischaracterized. Theoretical models suggest that response to risk is unlikely to be measured effectively with secondary aggregate data because it (i) tends to obfuscate individual responses and risk and (ii) offers very poor measurement of wealth on which risk aversion likely depends. In addition, conceptual studies are finding that representation of heterogeneity is of crucial structural importance for policy analysis, particularly when environmental concerns are important, because both actual and contemplated controls depend on localized land characteristics [e.g., Hochman and Zilberman (1978); Just and Antle (1990); Antle and Just (1992)]. Yet the vast majority of agricultural production studies are done using aggregate data without apology. The primary reason is lack of adequate firm-level data. At the firm level, the "Agricultural Resource Management Study" (formerly "The Farm Cost and Returns Survey") conducted by the U.S. Department of Agriculture's Economic Research Service contains extensive data on individual farms, but these are not available for use outside of the agency as a public use sample. Furthermore, these surveys are limited in scope because of governmental sampling exposure concerns. Lacking are microeconomic data that will allow a more thorough understanding of farm behavior. As discussed throughout this chapter, needed data must be capable of representing considerable heterogeneity. Yet the very identifying data that could permit merging of these observations with the extensive data base on land quality compiled by the U.S. Natural Resources Conservation Service (formerly the U.S. Soil Conservation Service) is typically restricted. As well, for many issues, the data needs to include intertemporal continuity. To avoid excessive survey exposure, observations are typically drawn on different farms from year to year so no information is available to track investment and productive asset replacement over time. In absence of obtaining such data, a reliable analysis of productive asset acquisition and replacement is difficult and doubtful. Panel data is necessary to do a careful and comprehensive analysis of agricultural investment behavior.
Ch. 12:
The Agricultural Producer: Theory and Statistical Measurement
721
In the U.S., some state land grant institutions have developed farm-level data sets across both time and farms by offering farm-level accounting and management assistance (e.g., Kansas State University). However, since participation is farmer-selected these samples are not random. Furthermore, these data are typically not publicly available and the data are not organized around a broad set of recurring economic issues. For example, such data typically record only external transactions of the farms whereas some additional recording of internal decisions (e.g., allocations of variable inputs) and characteristics (e.g., soil quality) could greatly enhance the value of the data. Yet in spite of these limitations, judging by publications in the leading agricultural economic journals, these samples are heavily used by those who have access to them. Such studies try to understand a variety of behaviors ranging from consumption and wealth accumulation to risk response [e.g., Jensen et al. (1993); Saha et al. (1994)]. Perhaps the best approximation of a comprehensive panel data base for agricultural production is the ICRISAT household data base, which represents primitive developing agriculture. With these data, many aspects of developing agriculture have been investigated and considerable additive debate has emerged accordingly. Developed agriculture, however, is considerably more complex because of scale heterogeneity, policy variability, complex finance and investment, greater scope of inputs and outputs, etc. Furthermore, understanding policy, markets and prices in all countries depends heavily on understanding agricultural production in the major developed countries because of their domination of world trade. We propose that a significant and complete data base for developed agricultural production needs to be developed as an investment by/for the agricultural economics profession, and that access to such data should be made freely available to all in order to facilitate debate. Debate could be additive because researchers would be forced to compare their maintained hypotheses when working with the same data. Such a data set would allow students to hone their research skills more comprehensively and allow the leading contributions of the profession to add cumulatively to a set of commonly held stylized facts. From these, additional knowledge would spring. Such a data base could facilitate investigation of many issues identified by this study as blocked by data unavailability. By comparison, the current proliferation of studies with uncommon data bases and incongruent maintained hypotheses has led to endless speculative explanations of differences in results with little comprehensive comparison [Alston and Chalfant (1991); Smale et al. (1994). Such a data base could serve much like public labor data have served the labor economics discipline to facilitate debate and development of a set of stylized facts for the discipline and its policy analysis efforts. 52 Labor economics is a field of economics that
52 An example of the usefulness of stylized facts is given for the marketing arm of the agricultural economics discipline by the focus and debate about elasticities of supply and demand during the 1950s and 1960s. Prior to the flexibility fad in supply and demand estimation, empirical production and marketing studies were heavily judged and criticized on the basis of accepted wisdom regarding supply and demand elasticities and whether they added to the profession's knowledge of them.
722
R.E. Just and R.D. Pope
has aggressively developed a useful set of microeconomic data. These data include the public use samples of the Census and Current Population Survey (CPS). The CPS is a monthly survey of approximately 60,000 households in all 50 states. Approximately one in 1600 households are surveyed. These data are extensive regarding wages, labor force participation, and socio-demographic data. Other panel-type data are found in the "Panel Study of Income Dynamics" (PSID), the National Longitudinal Survey (NLS and NLS Y2), the High School and Beyond Survey, and many special purpose instruments as well. In comparison, the dearth of microeconomic agricultural data makes understanding agricultural production, a seemingly more complex problem, very difficult. Any effort to create a broad and complete public panel of agricultural production data will likely require more resources than state land-grant efforts could/should devote. Furthermore, state-level development is likely not to lead to the public access that is needed to facilitate a broad professional and cumulative debate. Because the benefits of such data would be broadly applicable, such an effort seems to be merited at the national or even international level. However, because of excessive survey exposure and rightto-privacy restrictions applied to government surveys, a non-governmental organization may be a more effective means of developing such a data set. If these possibilities are pursued, the agricultural economics profession can once again lead the general economics discipline as an example of empirical excellence. Many of the issues raised throughout this chapter regarding the structure of technology and preferences can be addressed under assumptions much more consistent with practical agricultural knowledge. And many of the thorny generalizations (representation of investment, information acquisition, and the role of disturbances) yet needed to represent the agricultural production problem meaningfully and comprehensively can then be addressed sensibly.
7. Conclusions Economists have a primary responsibility to discover behavioral relationships. In practice, this has led to use of methodologies that require minimal or no resources for understanding the underlying structure of technology. Ironically, the effort to represent technologies with maximal flexibility has resulted in empirical approaches that exhaust the identifying potential of available data in capturing that flexibility. Little or no identifying potential remains for discovering behavior. Presumably, all production economists agree that understanding the essential elements of technology is important to economic thought and measurement. Indeed, the concepts and measurement of productive and technical efficiency and the creation and adoption of technology all seem to be undergoing a considerable rebirth of interest in recent years. A fundamental question in these pursuits is, "What elements of technology should economists consider essential?" That no consensus exists is evident by perusing the American Journal of Agricultural Economics, the Journal of Productivity Analysis,
Ch. 12: The Agricultural Producer: Theory and Statistical Measurement
723
and the International Journal o f Production Economics. We have argued that agricultural technology is fundamentally different than for most industrial production and that potentially large gains may come from understanding more of the structure that underlies aggregate reduced-form concepts of production technology. Questions regarding economies of scale and scope, prescriptions for farm management, adoption of technology, productivity and technical change, input demand, output supply, outsourcing [Coase (1937)] and the structure of the firm are only properly understood in the context of technology descriptions that include dynamics, risk, technical structure, input allocation, and constraints associated with policy controls and firm-owned resources. If technology, behavior, and policy instruments are confounded in specification and estimation, then models are not useful for investigating the effects of changes in policy, technologies or industry structure. As an example, one of the most important issues for future policy is the rapid evolution in the nature of the farm firm. Many farms, particularly those in the livestock sector, increasingly resemble the large-scale specialized manufacturing model. Many farms (e.g., those involved in contract farming) resemble component suppliers to manufacturers. Some (e.g., in the poultry industry) specialize as proprietors of technology. These developments likely have explanation in the framework proposed by Coase (1937). Careful representation and analysis of structured technology in the presence of information asymmetries appear to be crucial to understanding why some services are purchased, why others are produced within the farm, and yet others are produced by the operator or owner of the farm [Allen and Lueck (1998)]. If the agricultural economics profession lacks either relevant theory or evidence, it is a profession without science. Improved congruence of theory and evidence is needed to (i) enable researchers to better understand behavior, (ii) provide better support for policymakers, and (iii) facilitate greater appreciation of classroom theory by students. Some of the most basic theoretical properties of production theory - for example, monotonicity, homogeneity, convexity, and symmetry - are rejected by a predominance of empirical work [Shumway (1995)]. Rejection could be due to flawed theory, flawed empirical analysis, or flawed data. We have suggested several possibilities of theoretical failure beginning in Section 3, several possible failures of empirical practices beginning in Section 4.4, and some major shortcomings of available data in Section 6. Likely some combination of these explanations accounts for the poor performance of agricultural production models noted by Mundlak (2001). Without further research - some of which may not be possible with present data - the extent of failure caused by each is almost impossible to determine. Thus, enhancement of data seems to be a first priority. We noted in our introduction that there is an increasing gulf between farm management economists on one hand and (agricultural) production economists on the other. Economists are accustomed to arguing for the benefits of division of labor. However, we have argued that much of this gulf is due to cavalier empirical treatment by agricultural production economists of the structure of technology, behavioral preferences of producers, and the constraints and policies they face. Our point of departure is the Fundamental Axiom of Multi-output Production. If this axiom is taken seriously, then
724
R.E. Just and R.D. Pope
methods used by production economists and the data required for analysis are fundamentally different. The results of this paper underscore the need to develop farm-level data and data on input allocations. One of the greatest problems is inappropriate aggregation and inappropriate representation of heterogeneity imposed by present data availability. Public data are mostly aggregate data describing only the first moment of the underlying distribution among farms. Furthermore, data rarely record allocations of inputs except for land. Even most farm-level survey data such as the Agricultural Resource Management Study (formerly the Farm Costs and Returns Survey) carried out by the Economic Research Service do not record input use by crop or application rates. A few private services (e.g., Doane Marketing Research, Inc.) provide data on pesticide use or application rates by crop but this information is rarely if ever used in the journals of the agricultural economics profession in part because of the expense and in part because the data cannot be provided to others as required by some journal policies. Lack of data on allocations has tended to cause agricultural production analysis to use aggregate implicit representations of technology. Conceptually, we have demonstrated that implicit representation of technology can lead to deceiving conclusions when some producer decisions are unobserved (most particularly, allocations). Hypothesis tests of technology structure using standard dual and implicit representations of technology are shown to be invalid for typical cases. Under-representing the dimensions of the producer's decision problem can cause inappropriate conclusions. If a producer does not simply decide how much fertilizer to use, but must decide how much fertilizer to use on corn and how much to use on wheat, or how much to use at planting and how much to use during the growing period, then these considerations must be taken into account in specifying the technology before solving out the unobserved variables to reach estimable forms. Allocations as well as aggregate use must be considered in testing for technology structure. While policy- and behavior-relevant aggregations are appropriate in representing technology, the typical practice has been to ignore allocations and characterize technology with purely aggregate variables. While the set notation of duality lends itself to a high level of generality in theory, the typical step to empirical representation has ignored that potential by assuming technology is neatly described by a single equation devoid of allocations. Standard implicit or explicit specifications of scalar product transformation functions of the form F(Y, X) = 0 do not permit generality with respect to the rank of the relationship between X and y.53 Implicit representation is particularly distorting if some producer decisions are unobserved. That is, when some unobserved variables are solved out of the structural representation before computing the reduced form, the apparent structure of the observable production possibilities frontier may not reflect characteristics of the underlying technology. However, implicit representation is
53 That is, all c o m m o n scalar specifications of F(Y, X) = 0 i m p l y a Jacobian for the transformation f r o m X to Y o f rank 1.
Ch. 12:
The Agricultural Producer: Theory and Statistical Measurement
725
an important problem even if all producer decisions are observed and included in the scalar implicit representation of technology. If such generality is not admitted, then implicit forms arbitrarily exclude the potential nonjointness of, say, (45) for which they are used to test. Alternatively, explicit representations such as (11) can be estimated and used to determine the rank of the relationship between X and g. More importantly, single-equation and indirect representations of multi-output production can under-represent the dimensionality of the decision problem. Most often, inputs are represented only by aggregate variables that under-represent the dimensionality of the production technology (and the associated decision problem) when inputs must be allocated in some way over space, time, or production activities. As a result, estimates are policy- or behavior-dependent implying that "technology" models are unstable across observations where policy differs (as is typical in time series data) or behavior differs (as is likely in cross section data). In fact, if there are two or more unobserved allocated inputs, then no purely technological relationship is likely observable. With the present state of data, this may be a major constraint to any meaningful analysis of technical efficiency. Also, if decisions are changing frequently because of changes in policy instruments, then time series data and typical dual (PPF) approaches may offer little hope for estimating a stable "technology." Dual methods, while not inherently tied to this problem, have led to flexible but indirect representations of technology in practice because flexible forms are not self dual [McFadden (1978); Blackorby et al. (1978)]. Because these approaches start from a PPF representation of technology, most estimates of production technologies in the literature likely include behavioral criteria, are contaminated by policy heterogeneity either across firms or time, and are not pure estimates of technology. Associated hypothesis tests about technology are therefore invalid and actually represent joint tests about technology, policy, and behavioral criteria. For example, rejection of a hypothesis of, say, technical change could, in fact, imply rejection of the profit maximization assumption on which standard duality is based. Because a large part of the empirical agricultural production literature is based on a PPF approach (e.g., the typical PPF dual approach), the limits of usefulness of PPFs need to be recognized. A PPF permits (i) estimation of total factor demands and supplies and (ii) measurement of industry rents, but even these are valid only if the Aggregation Qualification Condition is met. By comparison, estimates of the PPF alone do not permit (i) examination of nonjointness, homotheticity, or separability of the technology, (ii) prescription of decisions, (iii) analysis of effects of changes in policy instruments, or (iv) explanation of how technical change affects decisions. The reason is that PPFs, because they do not represent allocations, may be policy- or behavior-dependent. In any case, tests of nonjointness, homotheticity, and separability on the frontier do not determine similar properties of the underlying technology. More seriously, under-representing technological dimensionality may induce structural characteristics such as jointness and non-separability on the aggregate variables when similar characteristics do not apply to underlying technology. These possibilities invalidate some tests and limit the usefulness of almost all tests of technology structure
726
R.E. Just and R.D. Pope
to date for multi-output production problems. These results also offer a likely explanation for why empirical methodologies have not delivered according to their conceptual promises [see Mundlak's (2001) criticism]. That is, if the technology description implicitly includes policy and behavioral criteria, then it is not surprising that empirical estimates are not stable and are inappropriately interpreting observed empirical relationships as implausible relationships in the data. Seemingly the practice noted by Moschini and Hennessy (2001) of sophisticated theoretical modeling with simplistic empirical modeling has led to few recognized empirical regularities. Given the potential invalidating implications of ignored realities, we fear that the current state of empirical knowledge of agricultural production sums up to little more than an empty box.
Appendix. Describing technology independent of policy and behavior This appendix gives a brief formal treatment of some of the points in Sections 4.1--4.4 using the notation introduced in Sections 3.1 and 4.1. The overall technology is assumed to have a structure composed of sub-technologies (yi, x i) c ~i (z i, ~) that yield aggregate output y = A Y using aggregate purchased inputs x = B X given fixed allocated resource constraints CZ ~< K, i.e.,
{(y, X) C ~'--i (k, ~)} ~---{(y, x) [ (Y, X) C Ui'~i (Z i , g), y : A Y , x = B X , C Z 2, then N corresponds to an open ball in multi-dimensional space. When controllability is not met, the producer does not have the flexibility to attain all output mixes in
N(Y). ny
DEFINITION A.3. Let Y" c R+b be a subset of outputs in Y e R + . The outputs in Y" are by-products of Y under technology ~ if there exists a non-trivial relationship in ~ such that only one Y" exists for each Y given uncontrollable factors, i.e., Y = g(Y, e). rtb
The existence of by-product relationships reduces the producer's flexibility in choosing output mixes. The remaining flexibility after taking these relationships into account is described by the rank of a technology.
58 If the PPF is defined conventionallyby F* (y, x, k, e) --=yl - f* (Y- 1, x, k, E) where y = (Yl, Y- 1) and
Yl = f*(Y-1, x, k, ~) =- max{y1 I (Y, x) ~ ~-i (k, e)} and if no fixed factors are allocated, then the same function is obtained as in (A.2) upon imposing technical allocative efficiency with respect to inputs and outputs.
Ch. 12:
The Agricultural Producer: Theory and Statistical Measurement
733
DEFINITION A.4. The rank of a technology is the dimension of the largest locally controllable mix of outputs. To proceed, suppose that the relationships in (50) and (51) are continuous and differentiable. LEMMA A. 1. Under continuity and differentiability, the rank of a technology ¥ = f(X,Z,e) nl .t'l y
is given by rank(fx, f z ) . PROOF OF LEMMA A.1. Let W = (X, Z) and rank(fx, f z ) = rank(fw) = p. Then there exists a nonsingular p x p Jacobian f~v as a submatrix of f w after appropriate reordering of Y and W. Corresponding to f f f are equations Y * = f * (W*, W**) which p
together with Y** = f**(W*, W**) represent a partitioning of Y = f ( W ) where W = (W*, W**) is a corresponding partitioning of W. By the Implicit Function Theorem, the equation Y* = f * (W*, W**) has a solution where W* are the active or endogenous p
variables. Let W6*, W~*, Y~ be such a solution. By the Implicit Function Theorem, there is an open ball 13(¥~) such that ¥* = {f*(W*, W**) ] W** = W~*} is a one-to-one transformation for all Y0* ~ B(Y~) and W* near W~. Hence, ¥* of dimension p is locally controllable. [] LEMMA A.2. Where the rank of a technology is na and Y is a locally controllable vector of outputs in R n~' , the complete output vector can be partitioned into Y = (Y, Y) where the choice of Y determines the other outputs in Y ~ R~ ~ and nb = ny - na, i.e., the number of by-products in a multi-output technology is equal to the number of outputs minus the rank of the technology. PROOF OF LEMMA A.2. Consider the production relations in (51) and assume rank(fx, f z ) = na. By the Inverse Function Theorem and Definition A.2, Y can be found as a function of (X, Z) for a given 8, say Y = f ( x , Z, 8). This relationship is na
simply a subset consisting of na of the individual equations contained in (51). Using Definition A.3, Y'= g ( f ( X, Z, 8)), where nb = ~ i ki - na. [] nb
From the proof of Lemma A.2, the gradient of f only spans an n a - d i m e n s i o n a l space. In particular, the Jacobian of Y"is g f • ( f x , f z ) which is a linear transformation of the Jacobian of Y given by ( f x , f z ) , which itself has only rank na. Next consider input controllability.
734
R.E. Just and R.D. Pope
DEFINITION A.5. Let Z c R+/ be a subset of inputs included in Z ~ R+z and let N ( Z ) C R+ r denote a neighborhood of Z. The mix of inputs Z is locally controllable in R+ if N (Z) _c
A subset of inputs is locally restricted if it is not locally controllable.
Even though there are nz allocated fixed input decisions, only n f = nz - nc of them are ~eely controllable. Generalizing to the possibility of nonlinear constraints, let Z = h ( Z , K ) represent the set of allocated fixed inputs determined by the choice of given K. Under continuity and differentiability, a parsimonious nonlinear representation of the binding (non-redundant) constraints will have a Jacobian of full rank. LEMMA A. 3. Let the vector o f all constrained inputs b e d e n o t e d b y Z • R+gl z and let all locally binding input constraints in ~ be summarized by Z = h( Z, K ) with full rank JatlC
cobian, h~. Then the input vector can be partitioned into Z = ('Z, Z ) where Z c R+z -no is locally controllable and the choice o f Z determines the other inputs in Z ~ R+c .
PROOF OF LEMMA A.3. The proof is omitted because it is similar to Lemma A. 1.
[]
Note that this 1emma is worded generally so as to apply to all forms of constraints whether associated with firm-owned resources, policy instruments, behavior, or market rationing and whether applicable to allocated fixed inputs or purchased variable inputs. PROOF OF PROPOSITION 6. The proof of Proposition 6 follows the Fundamental Axiom, which permits technology to be represented as in (51), and from Lemmas A. 1-A.3 under continuity and differentiability. [] PROOF OF PROPOSITION 7. This proof is omitted for brevity since it is sketched clearly in the text. [] PROOF OF PROPOSITION 8. If nc fixed inputs must be allocated among m subtechnologies, then at least nc (m - 1) allocation variables are unobserved. From Proposition 7, the maximum number of non-redundant observable controllable equations is thus na + nc - nc (m - 1). This number is greater than zero only if na >~n cm. In the case of nonjointness, m = ny = na in which case this condition reduces directly to nc ~< 1. In the case where some variable input allocations are unobserved but their aggregates are observed, a similar proof applies where (i) x = B X is used to substitute into (52)-(54), (ii) the number of such variable inputs is added to nc, and (iii) the associated number of unobserved allocations are considered in the calculation. For allocated fixed inputs without binding restrictions, note that m rather than m - 1 allocation variables are unobserved so even more variables are unobserved. [] PROOF OF COROLLARY 2. Since nc fixed inputs must be allocated among m subtechnologies, then at least (nc - 1)(m - 1) allocation variables are unobserved. From
Ch. 12:
The Agricultural Producer: Theory and Statistical Measurement
735
Proposition 7, the maximum number of non-redundant observable controllable equations is thus n a q - n c - ( n c - 1)(m - 1). This number is greater than zero only if n a + m - 1 >~ n c m . If n a < ( n c - 1)m, then n a ' b m - 1 < n c m - 1. Other assertions follow as in the proof of Proposition 8. []
PROOF OF PROPOSITION 9. Under the conditions of Proposition 8, no purely technological relationship among inputs and outputs is estimable. All estimable relationships of y and x obtained from solving the production problem with conditions (51) and (58) must embody policy or behavioral criteria. Thus, hypothesis tests on the relationship of input and output variables cannot test the structure of technology alone, but rather test the relationship of variables induced by a combination of behavioral criteria and technology. []
References Allen, D.W., and D.L. Lueck (1998), "The nature of the farm", Journal of Law and Economics 41: 343-386. Alston, J.M., and J.A. Chalfant (1991), "Unstable models from incorrect forms", American Journal of Agricultural Economics 73:1171-1181. Amemiya, T. (1985), Advanced Econometrics (Harvard University Press, Cambridge). Antle, J.M. (1983), "Testing the stochastic structure of production: A flexible moment-based approach", Journal of Business and Economic Statistics 1:192-201. Antle, J. (1984), "The structure of U.S. agricultural technology", American Journal of Agricultural Economics 66:414-421. Antle, J.M., S.M. Capalbo and C.C. Crissman (1994), "Econometric production models with endogenous input timing: An application to Ecuadorian potato production", Journal of Agricultural And Resource Economics 19:1-18. Antle, J., and S. Hatchett (1986), "Dynamic input decisions in econometric production models", American Journal of Agricultural Economics 68:939-949. Antle, J.M., and R.E. Just (1992), "Conceptual and empirical foundations for agricultural-environmental policy analysis", Journal of Environmental Quality 21:307-316. Baker, T.G., and B.A. MeCarl (1982), "Representing farm resource availability over time in linear programs: A case study", North Central Journal of Agricultural Economics 4:59-68. Ball, V.E. (1985), "Output, input, and productivity measurement in U.S. agriculture, 1948-79", American Journal of Agricultural Economics 67:425436. Ball, V.E. (1988), "Modeling supply response in a multiproduct framework", American Journal of Agricultural Economics 70:813-825. Ball, V.E., J.-C. Bureau, R. Nehring and A. Somwaru (1997), "Agricultural productivity revisited", American Journal of Agricultural Economics 79:1045-1063. Ball, V.E., and R.G. Chambers (1982), "An economic analysis of technology in the meat products industry", American Journal of Agricultural Economics 64:699-709. Ball, V.E., F. Gollop, A. Kelly and G. Swinand (1999), "Patterns of productivity growth in the U.S. farm sector: Linking state and aggregate models", American Journal of Agricultural Economics 81:164-179. Barry, P.J., and L.J. Robison (2001), "Agricultural finance: Credit, credit constraints, and consequences", in: B. Gardner and G. Rausser, eds., Handbook of Agricukural Economics, Vol. 1 (Elsevier, Amsterdam) 513-571. Bar-Shh'a, Z., R.E. Just and D. Zilberman (1997), "Estimation of farmers' risk attitude: An econometric approach", Agricultural Economics 17:211-222.
736
R.E. Just and R.D. Pope
Baumol, W.J., J.C. Panzar and R.D. Willig (1988), Contestable Markets and the Theory of Industry Structure, Revised Edition (Harcourt Brace Jovanovich, San Diego). Berck, R, and G. Helfand (1990), "Reconciling the Von Liebig and differentiable crop production functions", American Journal of Agricultural Economics 72:985-996. Binswanger, H.R (1974), "The measurement of tectmological change biases with many factors of production", American Economic Review 64:964-976. Binswanger, H.R (1980), "Attitudes toward risk: Experimental measurement in rural India", American Journal of Agricultural Economics 62:395-407. Binswanger, H.E (1981), "Attitudes toward risk: Theoretical implications of an experiment in rural India", Economic Journal 91:867-890. Blackorby, C., D. Primont and R.R. Russell (1978), Duality, Separability and Functional Structure (NorthHolland, New York). Bryant, K.J., J.W. Mjelde and R.D. Lacewell (1993), "An intraseasonal dynamic optimization model to allocate irrigation water between crops", American Journal of Agricultural Economics 75:1021-1029. Burger, B. (1998), "Delayed corn planting - what are your options?", Novartis Seeds, http://www.nk.com/ nkwired/1998/05 04 delay.html. Burr, O. (1993), "Decision rules for the dynamic animal feeding problem", American Journal of Agricultural Economics 75:190-202. Buschena, D., and D. Zilberman (2000), "Generalized expected utility, heteroscedastic error, and path dependence in risky choice", Journal of Risk and Uncertainty 20:67-88. Candler, W., and M. Boehlje (1971), "The use of linear programming in capital budgeting with multiple goals", American Journal of Agricultural Economics 53:325-330. Chambers, R.G. (1988), Applied Production Analysis (Cambridge, New York). Chambers, R.G., Y. Chung and R. F~e (1996), "Benefit and distance functions", Journal of Economic Theory 70:407-419. Chambers, R.G., and R.E. Just (1981), "Effects of exchange rate changes on U.S. agriculture: A dynamic analysis", American Journal of Agricultural Economics 63:32-46. Chambers, R.G., and R.E. Just (1989), "Estimating multioutput technologies", American Journal of Agricultural Economics 71:980-995. Chambers, R.G., and E. Lichtenberg (1995), "The Economics of sustainable agriculture in the Mid-Atlantic", Department of Agricultural and Resource Economics (University of Maryland, College Park). Chambers, R.G., and R. Pope (1991), "Testing for consistent aggregation", American Journal of Agricultural Economics 73:808-818. Chambers, R.G., and J. Quiggin (1998), "Cost functions for stochastic technologies", American Journal of Agricultural Economics 80:288-295. Chmnbers, R.G., and U. Vasavada (1983), "Testing asset fixity for U.S. agricultme", American Journal of Agricultural Economics 65:761-769. Chavas, J.-R (2001), "Structural change in agricultural production: Economics, technology and policy", in: B. Gardner and G. Rausser, eds., Handbook of Agricultural Economics, Vol. 1 (Elsevier, Amsterdam) 263285. Chavas, J.-E, and T.L. Cox (1988), "A nonparametric analysis of agricultural technology", American Journal of Agricultural Economics 70:303-310. Chavas, J.-E and M.T. Holt (1991), "On non-linear dynamics: The case of the pork cycle", American Journal of Agricultural Economics 73:819-828. Chavas, J.-R, and M.T. Holt (1993), "Market instability and nonlinear dynamics", American Journal of Agricultural Economics 75:113-120. Chavas, J.-E and M.T. Holt (1996), "Economic behavior under uncertainty: A joint analysis of risk preferences and technology", Review of Economics and Statistics 78:329-335. Clark, J.S., and G.A. Carlson (1990), "Testing for common versus private property: The case of pesticide resistance", Journal of Environmental Economics and Management 19:45~50. Coase, R. (1937), "On the nature of the firm", Economica 4:386-405.
Ch. 12:
The Agricultural Producer: Theory and Statistical Measurement
737
Cragg, J.G., and S.G. Donald (1997), "Inferring the rank of a matrix", Journal of Econometrics 76:223-250. Day, R.H. (1965), "Probability distributions of field crop yields", Journal of Farm Economics 47:713-741. de Janvry, A. (1972), "Optimal Levels of fertifization under risk: The potential for corn and wheat fertilization under alternative price policies in Argentina", American Journal of Agricultural Economics 54:1-10. de Koning G.H.J., H. Van Keulen, R. Rabbinge and H. Hanssen (1995), "Determination of input and output coefficients of cropping systems in the European Community", Agricultural Systems 48:485-502. Debreu, G. (1959), Theory of Value (Wiley, New York). Deininger, K., and G. Feder (2001), "Land institutions and land markets", in: B. Gardner and G. Ransser, eds., Handbook of Agricultural Economics, Vol. 1 (Elsevier, Amsterdam) 287-331. Diewert, W.E. (1974), "Applications of duality theory", in: M.D. Intrilligator and D.A. Kendrick, eds., Frontiers of Quantitative Economics, Vol. II (North-Holland, Amsterdam) 106-199. Diewert, W.E. (1976), "Exact and superlative index numbers", Journal of Econometrics 4:115-145. Diewert, W.E. (1982), "Duality approaches to microeconomic theory", in: K. Arrow and M. Intrilligator, eds., Handbook of Mathematical Economics, Vol. 2 (North-Holland, Amsterdam). Diewert, W.E., and T.J. Wales (1987), "Flexible functional forms and global curvature conditions", Econometrica 55:43-68. Dhrymes, EJ. (1973), "Restricted and unrestricted reduced forms: Asymptotic distribution and relative efficiency", Econometrica 41:119-134. Doll, J. (1967), "An analytical technique for estimating weather indexes from meteorological measurement", American Journal of Agricultural Economics 49:79-88. Eeckhoudt, L., and C. Gollier (1992), Risk: Evaluation, Management and Sharing (Harvester Wheatsheaf, New York). Economic Research Service (1999a), Corn Costs and Returns: 1997-98 Costs of Production from the Agricultural Resource Management Study (U.S. Government Printing Office, Washington D.C.). Economic Research Service (1999b), Soybean Costs and Returns: 1997-98 Costs of Production from the Agricultural Resource Management Study (U.S. Government Printing Office, Washington D.C.). Economic Research Service (various years), Wheat Yearbook (U.S. Government Printing Office, Washington D.C.). Evenson, R.E. (2001), "Economic impacts of agricultural research and extension", in: B. Gardner and G. Rausser, eds., Handbook of Agricultural Economics, Vol. 1 (Elsevier, Amsterdam) 573-628. FSre, R. (1996), "The opportunity cost of duality", Journal of Productivity Analysis 7:213-224. Farrell, M.J. (1957), "The measurement of productive efficiency", Journal of the Royal Statistical Society, Series A, General 120:253-281. Feder, G. (1979), "Pesticides, information, and pest management under uncertainty", American Journal of Agricultural Economics 61:97-103. Feder, G., R.E. Just and D. Zilberman (1985), "Adoption of agricultural innovations in developing countries: A survey", Economic Development and Cultural Change 33:255-298. Fisher, I. (1922), The Making of Index Numbers (Houghton Mifflin, Boston). Foster, A.D., and M.R. Rosenzweig (1995), "Learning by doing and learning from others: Human capital and technical change in agriculture", Journal of Political Economy 103:1176-1209. Foster, K.A., and O.R. Butt (1992), "A dynamic model of investment in the U.S. beef-cattle industry", Journal of Business and Economic Statistics 10:419-426. French, B., G. King and D. Minami (1985), "Planting removal relationships for perennial crops: An application to cling peaches", American Journal of Agricultural Economics 67:215-223. Fried, H.O., C.A.K. Lovell and S.S. Schmidt (1993), The Measurement of Productive Efficiency: Techniques and Applications (Oxford University Press, Oxford). Fuss, M.A. (1977), "The structure of technology over time: A model for testing the putty-clay hypothesis", Econometrica 45:1797-1821. Griliches, Z. (1963), "The sources of measured productivity growth: U.S. agriculture, 1940-1960", Journal of Political Economy 71:309-322. Hicks, J.R. (1956), A Revision of Demand Theory (Oxford University Press, London).
738
R.E. Just and R.D. Pope
Hochman, E., and D. Zilberman (1978), "Examination of environmental policies using production and pollution microparanaeter distributions", Econometrica 46:739-760. Horowitz, J.K., and E. Lichtenberg (1993), "Insurance, moral hazard, and chemical use in agriculture", American Journal of Agricultural Economics 75:926-935. Hueth, D., and U. Regev (1974), "Optimal agricultural pest management with increasing pest resistance", American Journal Agricultural Economics 56:543-552. Huffman, W.E. (2001), "Human capital: Education and agriculture", in: B. Gardner and G. Rausser, eds., Handbook of Agricultural Economics, Vol. 1 (Elsevier, Amsterdam) 333-381. Jensen, H. (1977), "Farm management and production economics, 1946-70", in: Lee Martin, ed., A Survey of Agricultural Economics Literature (University of Minneapolis Press, Minneapolis). Jensen, EE., J.S. Lawson and L.N. Langemeier (1993), "Agricultural investment and internal cash flow variables", Review of Agricultural Economics 15:295-306. Johansen, L. (1972), "Production functions: An integration of micro and macro, short-run and long-run aspects" (North-Holland, Amsterdam). Johnson, G.L. (1955), "Results from production economics analysis", Journal of Farm Economics 37:206222. Johnson, G.L. (1956), "Supply functions - some facts and notions", in: E. Heady et al,, eds, Agricultural Adjustment Problems in a Growing Economy (Iowa State University, Ames). Johnson, G.L., and L.C. Quance (1972), The Overproduction Trap in U.S. Agriculture (Johns Hopkins University Press, Baltimore). Just, R.E. (1974), "An Investigation of the importance of risk in farmers' decisions", American Journal of Agricultural Economics 56:14-25. Just, R.E., and J.M. Antle (1990), "Interactions between agricultural and environmental policies: A conceptual framework", American Economic Review 80:197-202. Just, R.E., and W. Candler (1985), "Production functions and rationality of mixed cropping: The Nigerian case", European Review of Agricultural Economics 12:207-231. Just, R.E., and R.D. Pope (1978), "Stochastic specification of production functions and economic implications", Journal of Econometrics 7:67-86. Just, R.E., and R.D. Pope (1979), "Production function estimation and related risk considerations", American Journal Agricultural Economics 61:276-283. Just, R.E., and R.D, Pope (1999), "Implications of heterogeneity for theory and practice in production economics", American Journal of Agricultural Economics 81:711-718. Just, R.E., and G.C. Rausser (1983), "Applied commodity price analysis, forecasting, and market risk management", NCR-134 Conference (Des Moines, IA). Just, R.E., and Q. Weninger (1999), "Are crop yields normally distributed?", American Journal of Agricultural Economics 81:287-304. Just, R.E., and D. Zilberman (1983), "Stochastic structure, farm size, and technology adoption in developing agriculture", Oxford Economic Papers 35:307-328. Just, R.E., D. Zilberman and E. Hochman (1983), "Estimation of multicrop production functions", American Journal Agricultural Economics 65:770-780. Just, R.E., D. Zilberman, E. Hochman and Z. Bar-Shira (1990), "Input allocation in multicrop systems", American Journal Agricultural Economics 72:200-209. Katmeman, D., and A. Tversky (1979), "Prospect theory: An analysis of decision under risk", Econometrica 47:263-291. Keplinger, K.O., B.A. McCarl, M.E. Chowdhury and R.D. Lacewell (1998), "Economic and hydrologic implications of implementing a dry year option for the Edwards aquifer", Journal of Agricultural and Resource Economics 23:191-205. Klein, L.R. (1947), "The use of cross-section data in econometrics with application to a study of production of railroad services in the united states" (National Bureau of Economic Research, Washington D.C.). Knudsen, N. (1973), Production and Cost Models of a Multi Product Finn (Odense University Press, Odense, Denmark).
Ch. 12:
The Agricultural Producer: Theory and Statistical Measurement
739
Kutcher, G.E, and R Scandizzo (1981), The Agricultural Economy of Northeast Brazil (Johns Hopkins Press, Baltimore). Lau, L.J. (1978), "Applications of profit functions", in: M. Fuss and D. McFadden, eds., Production Economics: A Dual Approach to Theory and Applications (North-Holland, Amsterdam) 133-216. Leathers, H. (1991), "Allocatable fixed inputs as a cause of joint production: A cost function approach", American Journal of Agricultural Economics 73:1083-1090. Leontief, W. (1971), 'q'heoretical assumptions and nonobserved facts", American Economic Review 41:1-7. Loehman, E., and C. Nelson (1992), "Optimal risk management, risk aversion, and production function properties", Journal of Agricultural and Resource Economics 17:219-231. Love, H.A., and S. Buccola (1991), "Joint risk preference-technology estimation with a primal system", American Journal of Agricultural Economics 73:763-773. Machina, M.J. (1987), "Choice under uncertainty: Problems solved and unsolved", Journal of Economic Perspectives 1:121-154. McCarl, B.A., W.V. Candler, D.H. Doster and ER. Robbins (1977), "Experiences with farmer oriented linear programming for crop planning", Canadian Journal of Agricultural Economics 25:17-30. McCloskey, D. (1998), The Rhetoric of Economics, 2nd edn. (University of Wisconsin Press, Madison). McElroy, M. (1987), "Additive general error models for production, cost, and derived demand or share systems", Journal of Political Economy 95:737-757. McFadden, D. (1978), "Cost, revenue and profit functions", in: M. Fuss and D. McFadden, eds., Production Economics: A Dual Approach to Theory and Applications (North-Holland, Amsterdam). McQuigg, J.D., and J.E Doll (1961), "Economic analysis involving random weather inputs,", Journal of Farm Economics 43:909-20. Mittelhammer, R.C., S.C. Matulich and D. Bushaw (1981), "On implicit forms of multiproduct-multifactor production functions", American Journal of Agricultural Economics 63:164-168. Morrison, C.J., and D. Siegel (1998), "Knowledge capital and cost structure in U.S. food and fiber industries", American Journal of Agricultural Economics 80: 30-45. Moschini, G. (forthcoming), "Production risk and the estimation of ex-ante cost functions", Journal of Econometrics. Moschini, G., and D.A. Hermessy (2001), "Uncertainty, risk aversion, and risk management for agricultural producers", in: B. Gardner and G. Rausser, eds., Handbook of Agricultural Economics, Vol. 1 (Elsevier, Amsterdam) 87-153. Mundlak, Y. (1996), "Production function estimation: Reviving the primal", Econometrica 64:431~438. Mundlak, Y. (2001), "Production and supply", in: B. Gardner and G. Ransser, eds., Handbook of Agricultural Economics, Vol. 1 (Elsevier, Amsterdam) 3-85. Nelson, C.H., and E Preckel (1989), "The conditional beta distribution as a stochastic production function", American Journal of Agricultural Economics 71:370-378. Nerlove, M. (1983), "Expectations, plans and realizations in theory and practice", Econometrica 51:12511279. Nerlove, M., and D.A. Bessler (2001), "Expectations, information and dynamics", in: B. Gardner and G. Rausser, eds., Handbook of Agricultural Economics, Vol. 1 (Elsevier, Amsterdam) 155-206. Pfouts, R.W. (1961), "The theory of cost and production in the multiproduct firm", Econometrica 39:650-668. Paris, Q. (1992), "The yon Liebig hypothesis", American Journal of Agricultural Economics 74:1019-1028. Paris, Q., and R. Howitt (1998), "An analysis of ill-posed production problems using maximum entropy", American Journal of Agricultural Economics 80:124-138. Pope, R. (1976), "An analysis of factors affecting farm diversification: With special reference to San Joaquin Valley crop farms", Unpublished Ph.D. Dissertation (University of California, Berkeley). Pope, R., and R. Chambers (1989), "Price aggregation when price-taking firms' prices vary", Review of Economic Studies 56:297-310. Pope, R., and A. Hallam (1986), "A confusion of agricultural economists? A profession interest survey and essay", American Journal of Agricultural Economics 68:572-594.
740
R.E. Just and R.D. Pope
Pope, R.D., and R.E. Just (1991), "On testing the structure of risk preferences in agricultural supply analysis", American Journal of Agricultural Economics 73:743-748. Pope, R.D., and R.E. Just (1996), "Empirical implementation of ex ante cost functions", Journal of Econometrics 25:231-249. Pope, R.D., and R.E. Just (1998), "Cost function estimation under risk aversion", American Journal of Agricultural Economics 80:296-302. Pope, R.D., and R.E. Just (2000a), "Random profits with duality", Working paper (Brigham Young University and University of Maryland). Pope, R.D., and R.E. Just (2000b), "Distinguishing errors in measurement from errors in optimization", Working paper (Brigham Young University and University of Maryland). Pope, R., and R. Prescott (1980), "Diversification in relation to farm size and other socioeconomic characteristics", American Journal of Agricultural Economics 62:554-559. Quiggin, J. (1982), "A theory of anticipated utility", Journal of Economic Behavior and Organization 3:323343. Regev, U., N. Gotsch and R Rieder (1997), "Are fungicides, nitrogen, and plant growth regulators riskreducing? Empirical evidence from Swiss wheat production", Journal of Agricultural Economics 48:167178. Samuelson, P.A. (1967), Foundations of Economic Analysis (Atheneum, New York). Saha, A., C.R. Shumway and H. Talpaz (1994), "Joint estimation of risk preference structure and technology using expo-power utility", American Journal of Agricultural Economics 76:173-184. Salin, V., A. Thurow, K. Smith and N. Elmer (1998), "Exploring the market for agricultural economics information: Views of private sector analysis", Review of Agricultural Economics 20:114-124. Schultz, T.E (2001), "Women's roles in the agricultural household: Bargaining and human capital investments", in: B. Gardner and G. Rausser, eds., Handbook of Agricultural Economics, Vol. 1 (Elsevier, Amsterdana) 383-456. Shumway, C.R. (1983), "Supply, demand, and technology in a multi-product industry: Texas field crops", American Journal of Agricultural Economics 65:748-760. Shumway, C.R. (1988), "The statistical base for a~iculturai productivity research: A review and critique", in: S.M. Capalbo and J.M. Antle, eds., Agricultural Productivity Measurement and Explanation (Resources for the Future, Washington, D.C.) 138-156. Shumway, C.R. (1995), "Recent duality contributions in production economics", Journal of Agricultural and Resource Economics 20:178-194. Shumway, C.R., and H. Lim (1993), "Functional form and U.S. agricultural production elasticities", Journal of Agricultural and Resource Economics 18:330-337. Shumway, C.R., R.D. Pope and E.K. Nash (1984), "Allocatable fixed inputs and jointness in agricultural production: Implications for economic modeling", American Journal of Agricultural Economics 66:72-78. Smale, M., R.E. Just and H.D. Leathers (1994), "Land allocation in hyv adoption models: An investigation of alternative explanations", American Journal of Agricultural Economics 76:535-546. Sunding, D., and D. Zilberman (2001), "The agricultural innovation process: Research and technology adoption in a changing agricultural sector", in: B. Gardner and G. Rausser, eds., Handbook of Agricultural Economics, Vol. I (Elsevier, Amsterdam) 207-261. United States Senate (1987), Hearings before the Committee on Agriculture, Nutrition, and Forestry, Federal Insecticide, Fungicide, and Rodenticide Act, 100th Congress, First Session, S. 1516, Part II, April 29, May 20, and July 30, p. 188-189. Vanker, R.D. (1996), "Hypothesis tests using data envelopment analysis", Journal of Productivity Analysis 7:139-160. Varian, H. (1992), Microeconomic Analysis, 3rd edn. (W.W. Norton and Co., New York). Vasavada, U., and V.E. Ball (1988), "A dynamic investment model within a multi-commodity framework", Agricultural Economics 2:123-137. Vasavada, U., and R.G. Chambers (1986), "Investment in agriculture", American Journal of Agricultural Economics 68:939-949.
Ch. 12:
The Agricultural Producer: Theory and Statistical Measurement
741
Viner, J. (1931), "Cost curves and supply curves", Zeitschrift for National6konomie and Statistik 3:23-46. Weaver, R. (1983), "Mukiple input, multiple output production choices and technology in the U.S. wheat region", American Journal of Agricultural Economics 65:45-56. White, T., and G. Irwin (1972), "Farm size and specialization", in: G. BaH and E. Heady, eds., Size, Structure and Future of Farms (Iowa State University Press, Ames). Wolf, S., D.R. Just and D. Zilberman (forthcoming), "Between data and decisions: The organization of agricultural economic information systems", Research Policy. Woodward, S. (1996), "A dynamic nutrient carryover model for pastoral soils and its application to optimising fertiliser allocation to several blocks with a cost constraint", Review of Marketing and Agricultural Economics 64:75-85.
AUTHORINDEX
n i n d i c a t e s c i t a t i o n in f o o t n o t e . Abbott, RC., s e e Patterson, RM. 886, 886n Abdulai, A. 352, 364 Abdurachman, E., s e e Evenson, R.E. 603 Abel, M., s e e Folbre, N. 402 Abel, M.E., s e e Wetmore, J.M. 1202 Abidogun, A. 601 Abizadeh, E, s e e Arthur, L. 519 Ackerlof, G.A. 1109 Ackerman, K. 883, 1167 Acuff, G.R., s e e Knutson, R.D. 1122 Adams Jr., R.H. 493,496 Adams, D.W. 533, 558 Adelman, I. 464, 494, 495 Adelman, I., s e e Taylor, J.E. 494, 495 Adioetomo, S.M., s e e King, E.M. 419, 435, 437n Adler, M. 993 Adrangi, B. 752n Adu-Asamoah, R., s e e Richards, T.J. 882n, 963 Afriat, S.N. 43 Agarwal, B. 394 Aghib, A. 611,612 Aghion, E 522, 909 Agricultural Issues Center 248 Aguilera-Alfred, N. 529 Ahmaddand, A.Z., s e e Menkhans, D.J. 903 Ahmed, M. 599 Ahmed, M., s e e Chisi, M. 611,612 Ahmed, R., s e e Goletti, E 1010 Ahmed, Z., s e e Pray, C.E. 593, 602 Ahrendsen, B.L. 541 Ainsworth, M. 404 Aird, J.S. 394, 415 Aiyagari, S.R. 837n Akbari, A.H., s e e K h a n , M.H. 594, 601 Akerlof, G. 234, 873 Akgunkov, S. 604 Akino, N., s e e Hayami, Y. 597 Akresh, R. 389, 405n Alaouze, C.M. 884 Alarc6n, R., s e e Massey, D.S. 485
Albert, A., s e e Shuford, E. 186n Alchian, A.A., s e e Klein, B. 877 Alderman, H. 395n, 410, 1007 Alderman, H., s e e Adams Jr., R.H. 496 Alderman, H., s e e Haddad, L. 389, 399, 401 Alderman, H., s e e Higgin, E 389, 416 Alderman, H., s e e Sahn, D. 429 Alderman, H., s e e Senauer, B. 415,437n Aldinger, E, s e e Weinschenck, G. 974 Alesina, A.A. 430n Alexander, C. 999, 1201 Alexander, W.E, s e e Shumway, C.R. 37, 37n All, M., s e e Flinn, J.C. 364 All, S.A. 495 Aliber, M., s e e Chavas, J.-R 271,272 Allain, M.-L. 869, 869n Allais, M. 93n Allanson, R 267, 278 Allaz, B. 1153 Allen, D.W. 300, 531,633,636, 723, 1166, 1201 Allen, RG. 1145-1147 Allshouse, J.E., s e e Putnam, J.J. 947n Alsm, J., s e e Strasma, J. 316 Alston, J.M. 218,225,226, 576n, 577n, 588n, 604, 710, 721,880, 918, 919, 975, 1119, 1194 Alston, J.M., s e e Chalfant, J.A. 1202 Alston, L.J. 297, 559 Alston, L.J., s e e Rucker, R.R. 559 Altonji, J. 441,497 Ambrosi, I. 610 Amemiya, T. 637n Amin, S. 414 Anandajayasekeram, R 611,612 Anandajayasekeram, E, s e e Chisi, M. 611,612 Anandajayasekeram, R, s e e Mudhara, M. 594, 611 Anderson, D., s e e Azzam, A.M. 903n, 954n, 965, 1156 Anderson, D.W. 911 Anderson, G. 110 Anderson, J. 558 I-1
I-2 Anderson J.G., s e e Wessells, C.R. 1099 Anderson J.R. 89 Anderson J.R., s e e Gautam, M. 588n, 595n Anderson J.R., s e e Hamal, K.B. 106 Anderson J.R., s e e Pardey, RG. 273, 275 Anderson J.R., s e e Purcell, D.L. 576n, 608n Anderson J.R., s e e Roumasset, J.A. 122n Anderson K.H. 419 Anderson R.W. 125n, 127, 131,132, 779, 804, 851 Andre, C. 294 Andrews Jr., W.H., s e e Marschak, J. 6 Angrist, J. 428 Anker, R.B., s e e Knowles, J.C. 473,485,496 Anscombe, E 93n Antle, J.M. 21, 22, 22n, 36, 37, 37n, 109, 111, 113, 117, 121, 122n, 209n, 218n, 359, 366, 478,634, 635, 647, 669, 717, 720, 1086, 1091, 1102, 1112, 1114, 1118, 1122, 1123, 1127, 1129, 1202 Antle, J.M., s e e Capalbo, S.M. 272 Antle, J.M., s e e Just, R.E. 632, 717, 720 Antonovitz, E 115, 183 Appelbaum, E. 888, 890, 955 Apps, RE 398 Appu, RS. 317n, 318 Aradhynla, S.V. 115, 117 Araji, A.A. 610 Arango, J., s e e Massey, D.S. 482, 485,488 Arango, J., s e e Taylor, J.E. 494, 495 Archibald, S.O. 1088 Ardeni, RG. 852n, 1007, 1007n Ardila, J., s e e Hertford, R. 597 Ardila, S., s e e Innes, R. 138 Arhin, K. 883, 884 Armstrong, J.S. 1145 Alrow, K.J. 23, 91, 94, 95n, 391,836n, 1028, 1091 Arthur, L. 519 Arzac, E.R. 826 Ashby, J.A., s e e Pachico, D.H. 591 Ashenfelter, O. 391,407, 408,959 Ashley, R. 1000 Askari, H. 48, 161 Atiyas, I., s e e Caprio, G. 554 Atwood, D.A. 299 Aumann, R., s e e Anscombe, E 93n Avila, A.ED. 594, 597, 610 Avila, A.ED., s e e da Cruz, E.R. 593, 596, 597, 610 Avila, A.ED., s e e Evenson, R.E. 593,604, 607
Author
Index
Avila, A.ED., s e e Luz Barbosa, M.K.T. 598 Ayer, H.W. 597 Ayers, C.H.S. 594 Azam, J.-E 121 Azam, Q.T. 602, 608 Azzam, A.M. 276, 875, 891,895, 898, 903, 903n, 903n, 907, 917, 917n, 919, 954n, 955, 963,965, 1156 Azzam, A.M., s e e Schroeter, J.R. 896, 903,955, 961,962 Azzam, A.M., s e e Stiegert, K.W. 907, 956n Azzam, A.M., s e e Weliwita, A. 907 Babcock, B.A. 112, 138, 141 Babcock, B.A., s e e Hennessy, D.A. 141 Babu, R, s e e Bidinger, RD. 308 Baffes, J. 1007 Bailey, D. 1154, 1161 Bailey, R.E., s e e Chambers, M.J. 852 Bailey, W., s e e Marion, B.W. 905, 905n Baker, C.B. 524, 525, 1189 Baker, C.B., s e e Barry, RJ. 516, 517, 525, 529, 534, 538, 541-543, 552, 556 Baker C.B., s e e Gabriel, S.C. 540 Baker C.B., s e e Karmajou, F. 558 Baker C.B., s e e Lee, W. 556 Baker C.B., s e e Vandeputte, J.M. 525 Baker J.B. 899, 900 Baker T . , s e e Barry, P.J. 525 Baker T.G. 639 Baker T.G., s e e Featherstone, A.M. 535, 540, 541 Baker, T.G., s e e Leatham, D.J. 541 Bal, H.K., s e e Kahlon, A.S. 600 Balan, J. 487 Baland, J.-M. 317 Balcazar, A. 307 Baldwin, L.H. 1161 Ball, V.E. 26, 26n, 39, 62, 209n, 272, 273, 365, 545, 661,668, 669, 672, 697, 700, 947,962 Ball, V.E., s e e Vasavada, U. 649 Banerjee, A. 311n, 318 Banerjee, A.V. 318, 318n Banerjee, B. 492 Banner, D.K., s e e Barry, RJ. 556 Banterle, A., s e e Oustapassidis, K. 868 Baquet, A., s e e Smith, V.H. 140 Bar-Shira, Z. 43, 44, 46, 47, 709 Bar-Shira, Z., s e e Just, R.E. 640, 710 Barbosa, M., s e e Strauss, J. 357 Bardhan, RK. 311,415, 479
Author Index
Bardsley, R 848 Bare, B.B. 598 Barefoot, S.E 1087 Barham, B.L. 478,479, 496 Barham, B.L., s e e Carter, M.R. 308 Barkema, A. 870, 874, 1160, 1164 Barkley, A.R 351,481 BarNey, A.R, s e e Schroeder, T.C. 875 BarNey, A.R, s e e Ward, C.E. 875, 1156, 1157 BarNey, D., s e e Wilson, RN. 556 Barletta, N.A. 597, 600 Barnaby, G.A., s e e Williams, J.R. 110 Bamard, C.H. 517 Barnard, F.L. 556 Barnard, EL., s e e Barry, RJ. 556 Barnett, W.A. 1033, 1039 Barney, K., s e e K i m , C.S. 919 Barney, L.D., s e e LaFrance, J. 1045, 1053, 1070n
Barnhart, S.W. 799 Barnum, H.N. 385,390, 441,471,480 Baron, D.R 126, 1114, 1124 Barraclough, S.L. 320n Bah'era, A. 437n Barrett, C.B. 121,976, 1008, 1016 Barrett, W.B. 1158 Barro, R.J. 163, 337n, 487 Barros, R. 422 B a r r y , E , s e e Miller, L.H. 529, 530 Barry, RJ. 516-518, 520, 525,526, 528-530, 534-539, 539n, 540-543,552, 555-559, 710, 712, 713, 1189, 1195 Barry, EJ., s e e Barnard, F.L. 556 Barry, EJ., s e e Collins, R.A. 120 Barry, RJ., s e e Ellinger, RN. 517, 529, 535, 556 Barry, P.J., s e e Gibson, S. 539 Barry, EJ., s e e Gustafson, C. 547, 550 Barry, EJ., s e e Gwinn, A.S. 525,542 Barry, P.J., s e e Hughes, D.W. 559 Barry, EJ., s e e Khoju, M.R. 556 Barry, EJ., s e e Lins, D.A. 550 Barry, EJ., s e e Lufburrow, J. 529 Barry, EJ., s e e Miller, L.H. 521,529, 530 Barry, EJ., s e e Nasr, R. 524 Barry, RJ., s e e Patrick, G.E 518 Barry, RJ., s e e Pflueger, B.W. 526 Barry, P.J., s e e Rahman, M.L. 556 Barry, P.J., s e e Robison, L.J. 91,520, 539, 544, 556 Barry, EJ., s e e Schnitkey, G.D. 534, 538 Barry, RJ., s e e Splett, N.S. 529
I-3 Barry, RJ., s e e Young, R.R 519 Barten, A. 1027 Basu, K. 122, 307n Basu, S. 959 Bates, R.H. 795 Batlin, C.A. 125n Batra, R.N. 103 Battalio, R.C., s e e Dwyer, G.E 188, 190, 197 Batterham, R.L. 1153n Baulch, R.J. 1011 Banmer, D.L. 878n Baumol, W.J. 267n, 639, 908,953,965, 1117 Baur, R.E 797 Baylis, K., s e e Fulton, M. 1155 Baylis, K., s e e Schmitz, A. 1169 Beachy, R.N., s e e Barefoot, S.F. 1087 Bean, ED. 497 Bean, ED., s e e White, M.J. 483 Bean, L.H. 47 Bear, R. 752n Beattie, B.R., s e e Shumway, C.R. 21n Becht, J.A., s e e Kuyvenhoven, A. 611,612 Beck, H. 598 Beck, S.E. 808 Becket, G.S. 335, 337, 346, 385, 387-389, 391, 392, 395, 398, 401,405,408,410, 411,413, 418,419, 419n, 421,422, 426, 428, 430, 440, 467, 1030, 1032 Becket, G.S., s e e Barro, R.J. 163,487 Becket, G.S., s e e Ehrlich, I. 122 Becket, G.S., s e e Ghez, G.R. 338, 368 Beckman, C.V., s e e Kenyon, D.E. 793n Beckman, S.R. 190, 197, 200 Beegle, K., s e e Strauss, J. 390, 394, 396, 410, 415 Beghin, J.C. 884 Behm, H. 437n Behr, M.R., s e e Imel, B. 866 Behrman, J.R. 114, 393-395,435,437n, 437n Behrman, J.R., s e e Foster, A.D. 434 Belbase, K. 364 Bell, C. 312 Belier, A.H. 422 Bellman, R. 836n Belongia, M. 548, 556 Belzer, R.B. 1097, 1129 Ben-Porath, Y. 338, 348, 430 Bengston, D.N. 597, 598, 610 Benirschka, M. 853, 975, 1150 Benjamin, D. 269, 305, 305n, 363n, 390, 441 Benjamin, D., s e e Deaton, A. 592
I-4 Benninga, S. 126, 781 Benson, B.L., s e e Faminow, M.D. 974, 983, 1001n, 1010 Benveniste, L. 834 Bera, A.K. 121 Berck, E 212, 633, 779, 880, 963 Berger, M., s e e Kenkel, D. 1097 Berger, M.C. 1097 Berglof, E. 522, 523 Bergman, M.A. 876, 877n Bergstrom, T.C. 395 Bernardo, D.J., s e e Teague, M.L. 120 Bernoulli, D. 90, 93n Bernsten, R., s e e Sterns, J.A. 594, 611,612 Berry, A. 268 Berry, R.A. 305,305n, 491,501 Berry, S.T. 902 Bertelsen, M. 611,612 Berwald, D., s e e Carter, C.A. 884, 1169 Besley, T. 296, 297, 298n, 319n, 354, 422 Bessembinder, H. 771 Bessler, D.A. 183, 184, 186n, 192-194, 1145-1147
Bessler, D.A., s e e Chen, D.T. 1145 Bessler, D.A., s e e Covey, T. 183, 184 Bessler, D.A., s e e Kling, J. 187n Bessler, D.A., s e e Nelson, R.G. 187, 189, 190, 194, 196, 197, 200 Bessler, D.A., s e e Nerlove, M. 648, 652, 706, 708, 712, 713, 1191 Bewley, R., s e e Williams, C. 1004 B4ye, A.M., s e e Seck, EA. 599 Bhagwati, J.N. 501 Bhalla, S.S. 305n Bhargava, V., s e e Baker, C.B. 525 Bhattacharjee, J.R 7, 7n, 20, 21 Bhua, Li, s e e Zeng, Yi 423n Bhuyan, S. 890, 914n, 916, 917, 917n Bidinger, ED. 308 Biere, A.W., s e e Grnnewald, O. 798 Bigman, D. 120, 802 Billups, S.C. 983 Bilsborrow, R.E. 500 Bindlish, V. 358 Bindlisb, V., s e e Evenson, R.E. 588n, 592, 594, 595n Binkley, J.K. 905, 906n Binkley, J.K., s e e Benirschka, M. 853, 975, 1150 Binswanger, H.R 33, 107-109, 211,217, 217n, 218n, 265,267, 268, 270, 273, 297, 300, 302n, 306n, 319, 429, 633,709
Author
Index
Binswanger, H.R, s e e Rosenzweig, M.R. 121, 306n Bird, R. 316 Birdsall, N., s e e Behrman, J.R. 437n Birkhaeuser, D. 357n, 432, 433, 595 Bishop, C.E. 480 Bishop, J. 335, 373,374n Bjornson, B. 775 Black, E 804 Black, J.D., s e e Galbraith, J.K. 47 Blackmer, A.M., s e e Babcock, B.A. 112 Blackorby, C. 635n, 658,668, 725 Blanc, A.K., s e e Lloyd, C.B. 437n Blank, S.C. 1151 Blank, S.C., s e e Dahlgran, R.A. 983,986 Blarel, B. 293 Blau, D. 415 Blan, G. 769, 780 Blaylock, J.R., s e e Smallwood, D.M. 1092 Blejer, M.I. 483 Blinder, A.S. 832 Blomquist, G., s e e Kenkel, D. 1097 Blomquist, G.C., s e e Berger, M.C. 1097 Bloom, D., s e e Stark, O. 468,477 Bloom, E.A., s e e Azam, Q.T. 602, 608 Blumberg, R.L. 418, 437n Blyn, G. 993 Board of Governors of the Federal Reserve System 557 Bobenrieth, E.S.A. 851,853-855 Bobenrieth, J.R.A., s e e Bobenrieth, E.S.A. 855 Bockstael, N.E. 1122 Boehlje, M. 1160, 1193 Boehlje, M., s e e Barry, RJ. 525 Boehlje, M., s e e Candler, W. 710 Boehlje, M., s e e Lowenberg, D.J. 270, 278 Boehlje, M.D. 536, 538,539 Boehlje, M.D., s e e Hughes, D.W. 559 Boehlje, M.D., s e e Pederson, G. 559 Boehlje, M.D., s e e Thomas, K.. 539 Boehm, W. 839 Boggess, W.G., s e e Patrick, G.E 518 Boggess, W.G., s e e Purvis, A. 106, 549 Boggess, W.G., s e e Thnrow, A.R 243 B6hm, V., s e e Barten, A. 1027 Bojanic, A. 598 Bollerslev, T.R 116 Bollerslev, T.R, s e e Engle, R.F. 116 Bollman, R.D. 353 Bolton, R, s e e Aghion, R 522, 909 Bond, G.E. 778n
Author
Index
Borch, K. 136 Borjas, G.J. 486, 497, 498 Boserup, E. 211,265, 293,416, 422, 432, 433 Bosworth, B. 557 Bottomley, A. 121,122, 556 Bottomley, R, s e e Thirtle, C. 601 Boucher, S., s e e Barham, B.L. 478, 479, 496 Bouchet, F. 38 Bougheas, S. 851 Boughton, D. 599 Boulier, B.L. 419n, 437n Bourdieu, R 532 Bourguignon, F. 475 Bourguignon, E, s e e Browning, M. 396, 397, 399,412 Boussard, J.M. 534 Bowen, R. 1028 Bowles, S., s e e Bardhan, RK. 311 Boyce, J.K. 575n Boyce, J.K., s e e Judd, M.A. 575n Boyd, M.S., s e e Kohzadi, N. 1158 Boyle, G.E. 601 Braden, J.B., s e e Kolstad, C.D. 1092 Braden, J.B., s e e Nelson, C.H. 549 Braha, H. 601 Brake, J.R., s e e Barry, RJ. 556 Brake, J.R., s e e Robison, L.J. 539 Brandao, A.S.R 308 Brander, J.A. 1154 Brandow, G.E. 50, 277, 280, 1202 Brandow, G.E., s e e Buse, R.C. 948,950 Brandt, J.A. 805 Brandt, J.A., s e e Bessler, D.A. 183, 184 Brandt, L., s e e Rozelle, S. 297, 298 Brandt, L., s e e Turner, M.A. 302n Brannen, RE 802n Brannman, L.E. 1161 Brasselle, A.-S. 296 Braulke, M. 942 Braverman, A., s e e Hoff, K. 246 Bravo-Ureta, B.E. 364 Bravo-Ureta, B.E., s e e Evenson, R.E. 592 Bray, M. 127 Bredahl, M.E. 600, 943n, 976, 1170, 1171 Brennan, D. 763, 851,853, 1152 Brenner, R.J. 806n Bresee, D., s e e Unterschultz, J. 1152 Bresnahan, T.E 792, 843, 890, 953,954, 954n, 956 Bresnahan, T.E, s e e Baker, J.B. 899, 900 Bressler, R.G. 865, 887, 974
I-5 Brester, G.W. 962 Brester, G.W., s e e Goodwin, B.K. 953,963 Brester, G.W., s e e Klein, N.L. 1091, 1101, 1127 Brewster, J.M. 47 Brier, G.W. 186 Brinegar, C.S. 798 Brink, L. 107 Brinkman, G.L. 598 Brinkman, G.L., s e e Fox, G. 598 Brinkman, G.L., s e e Haque, A.K.E. 598 Brinkman, G.L., s e e Hust, M. 598 Brinkman, G.L., s e e Zachariah, O.E.R. 598 Britto, R. 779 Briz, J., s e e Oustapassidis, K. 868 Brock, W.A. 851 Brockett, C.D. 308, 308n Bromley, D., s e e Sjaastad, E. 296 Bronfenbrenner, M. 6 Brooks, H. 1154, 1169 Brooks, H., s e e Fulton, M. 1155 Brooks, K.M., s e e Gardner, B.L. 976 Brorsen, B.W. 115,783, 961,962, 999, 1149, 1159 Brorsen, B.W., s e e Bailey, D. 1154, 1161 Brorsen, B.W., s e e Irwin, S.H. 766 Brorsen, B.W., s e e Stiegert, K.W. 907,956n Brorsen, B.W., s e e Yang, S.R. 854, 1158 Brown, L., s e e Southgate, E. 300 Brown, L.R. 209 Brown, L.R., s e e Meinzen-Dick, R. 434 Brown, M., s e e Manser, M. 398, 401 Brown, R., s e e Turvey, C.G. 529 Brown, S.L. 779 Browning, H., s e e Balan, J. 487 Browning, M. 396, 397, 399, 412, 1068 Brownlee, O.H., s e e Schultz, T.W. 184, 191, 192, 196 Brownlee, O.H., s e e Tintner, G. 5, 6, 6n, 8n Bruce, J.W. 315n Brunnel; A.D. 598 Bruno, M. 936 Bryant, K.J. 633 Bryant, W.K. 352 Buccola, S.T. 980 Buccola, S.T., s e e Love, H.A. 113, 647 Budge, C.C., s e e Peck, A.E. 752n Buffier, B.D. 517, 556 Bureau, J.-C., s e e Ball, V.E. 26, 26n, 39, 62, 209n, 272, 273, 365,661 Burfisher, M.E., s e e Robinson, S. 464 Burger, B. 646
I-6 Burgess, R. 305 Burgess, R., s e e Besley, T. 319n Burghardt, W.G., s e e Robison, L.J. 520 BurNs, A.E., s e e Kolstad, C.D. 884 Butt, O.R. 121,633, 1194 Burt, O.R., s e e Foster, K.A. 633 Butt, R.S. 532 Burton, M. 1158 Buschena, D.E. 709, 885, 891 Buse, R.C. 948, 950 Bushaw, D., s e e Mittelhammer, R.C. 688,690, 730, 731n, 732 Butanlt, J., s e e Ball, V.E. 62 Butcher, K.E 497 Butler, L.J., s e e Klotz, C. 358 Buttari, EJ. 558 Butz, W.E 403 Butzer, R., s e e Larson, D. 62 Butzer, R., s e e Mundlak, Y. 24, 26 Buvinic, M. 430n Buzby, J.C. 1099, 1100 Buzby, J.C., s e e Crutchfield, S.R. 1087, 1091, 1120 Buzby, J.C., s e e Roberts, T. 1091, 1120 Buzina, R., s e e Waterlow, J.C. 429 Byerlee, D. 602, 611 Byerlee, D., s e e Traxler, G. 604 Cai, E, s e e Lin, J,Y. 296 Cain, M. 308, 309n Cakmak, E., s e e Schmitz, A. 1149 Caldwell, J.C. 403n, 422, 437n Caldwell, E, s e e Caldwell, J.C. 403n Callison, C.S. 319n Calomiris, C.W. 548 Calonius, E. 527 Calvert, J.D., s e e Barry, RJ. 556 Calvin, L., s e e Just, R.E. 139, 140 Calvo, G.A. 305 Campbell, D. 200 Canavesi, M.L., s e e Adams, D.W. 533 Candler, W. 710 Candler, W., s e e Just, R.E. 634 Candler, W.V., s e e McCarl, B.A. 637 Canoles, W.B. 765 Capalbo, S.M. 26, 31n, 35n, 272, 366 Capalbo, S.M., s e e Autle, J.M. 366, 634 Caplin, A.S. 849 Caprio, G. 554 Capule, C.A. 591 Card, D. 428, 497
Author
Index
Card, D., s e e Altonji, J. 497 Card, D., s e e Butcher, K.F. 497 Cardenas, M. 884, 1167 Cargill, T.E 798 Carletto, C. 252 Carlin, RS. 403 Carlson, G.A., s e e Clark, J.S. 648 Carlson, J. 193 Carman, H.E, s e e Alston, J.M. 880 Carman, H.E, s e e Kinney, W. 882 Carman, H.E, s e e Pick, D.H. 882n Carman, H.E, s e e Sexton, R.J. 904n, 1011, 1012, 1012n, 1014 Cart, D.L., s e e Bilsborrow, R.E. 500 Carriker, G.L., s e e Williams, J.R. 110 Carriquiry, A.L. 1092 Canon, A., s e e Bosworth, B. 557 Carter, C.A. 774, 798, 808, 884, 902n, 1151-1153, 1157-1159, 1169, 1170 Carter, C.A., s e e Arthur, L. 519 Carter, C.A., s e e Bjomson, B. 775 Carter, C.A., s e e Blank, S.C. 1151 Carter, C.A., s e e Ransser, G.C. 805 Carter, H.O., s e e Cocks, K.D. 536 Carter, H.O., s e e Halter, A.N. 1190 Carter, M.R. 299, 300, 305, 305n, 306n, 307, 308, 316, 530 Carter, M.R., s e e Zimmerman, F. 294n, 306 Carvajal, M.J. 473 Carvalho, J.L. 173n Carvalho, J.L., s e e Nerlove, M. 161n, 175, 180, 181 Case, A., s e e Besley, T. 354 Casella, A. 281 Cassel, G. 975 Cassels, J.M. 47, 865, 1198 Castillo, E, s e e Parker, D. 254 Castillo-Freeman, A.J. 482, 488 Castle, E.N. 1204 Caswell, J.A. 1086, 1090, 1100, 1112, 1114, 1119 Caswell, J.A., s e e Colatore, C. 1125 Caswell, M.E 234, 252 Cato, J.C. 1125 Cavallo, D. 12, 72, 251,252 Cavallo, D., s e e Mundlak, Y. 18, 25, 27n, 62, 72 Cave, J. 880 Caves, D.W. 31n Chakravorty, U.N., s e e Roumasset, J.A. 122n Chalamwong, Y., s e e Feder, G. 296, 299 Chalfant, J.A. 35n, 45, 873, 1202
Author
I-7
Index
Chalfant, J.A., s e e Alston, J.M. 710, 721 Chalfant, J.A., s e e Finkelshtain, I. 103n Chalfant, J.A., s e e Rausser, G.C. 1192 Chamberlain, E.H. 1153 Chambers, M.J. 852 Chambers, R.G. 31n, 36, 42, 104, 136, 137, 632, 647, 648,650, 661,669, 672, 681n, 687, 689, 697, 701,707, 709, 718n, 731,938,975, 1101, 1114, 1124, 1190 Chambers, R.G., s e e Ball, V.E. 697, 700, 947, 962 Chambers, R.G., s e e Lee, H. 70 Chambers, R.G., s e e Pope, R.D. 650, 661,718 Chambers, R.G., s e e Vasavada, U. 64, 65, 65n, 278, 549, 649 Chambolle, C., s e e A l l a l n , M.-L. 869, 869n Chamley, C. 830n Chamrathfithirong, A., s e e Knodel, J. 419 Chanakanyuka, K., s e e Macmillan, J. 611 Chang, C.C. 56, 66 Chang, C.C., s e e Hsu, S. 549 Chang, E.C. 807 Chang, S.U. 598 Chatrath, A. 772 Chatrath, A., s e e Adrangi, B. 752n Chavas, J.-E 43, 44, 55, 105, 109, 113, 115, l16n, 118, 182, 244, 267, 270-272, 273n, 274, 275, 278, 366, 549, 604, 637n, 638, 641, 642, 648, 694, 706, 709, 1158, 1166, 1186, 1188, 1192 Chavas, J.-E, s e e Brorsen, B.W. 115,961, 962, 999, 1149, 1159 Chavas, J.-E, s e e Cox, T.L. 43 Chavas, J.-E, s e e Helmberger, EG. 1148, 1150 Chavas, J.-E, s e e Pope, R.D. 97, 98, 103, 104 Chavas, J.-E, s e e Shiha, A. 278 Chavas, J.-E, s e e Smith, L.C. 405n, 430n, 433 Chert, C.L., s e e Thomas, D. 397n, 409, 437n Chen, D.T. 1145 Chen, K. 919 Chen, L. 414, 415, 424 Chen, W.-H., s e e Dixon, B.L. 826 Chen, Z. 891n Chenery, H.B. 57 Chenery, H.B., s e e Arrow, K.J. 23 Cheng, C., s e e Sundquist, W.B. 601 Chennareddy, V. 7n Chem, W.S., s e e Just, R.E. 226, 890, 904, 956, 1156 Chemichovsky, D. 416, 417, 437n Cheung, N.S. 310
Chevalier, J.A. 911 Chhikara, R. 529 Chhikara, R.K. 525 Chiappori, E-A. 385, 396-398, 401,410, 419 Chiappori, E-A., s e e Alderman, H. 410 Chiappori, E-A., s e e Bourguignon, E 475 Chiappori, E-A., s e e Browning, M. 396, 397, 399, 412 Chin, O.EL., s e e Giles, D.E.A. 787 Chirinko, R.S. 58, 69 Chishfi, S., s e e Alderman, H. 395n Chisi, M. 611,612 Chiswick, C.U. 430 Chitalu, G., s e e Howard, J. 594 Chiwele, D., s e e Deininger, K. 294n Choe, Y., s e e Akgunkov, S. 604 Choi, E.K. 1092 Choi, E.K., s e e Feinerman, E. 105 Chotigeat, T . , s e e Rao, V. 268 Chou, E.C. 592 Chowdhury, A., s e e Chen, L. 414 Chowdhury, M.E., s e e Keplinger, K.O. 637 Christensen, L.A., s e e Lasley, EA. 276 Christensen, L.R. 23, 1190 Christensen, L.R., s e e Caves, D.W. 31n Christian, J.E., s e e Alston, J.M. 880 Christian, J.W., s e e Jones, L.S. 480 Christiano, L.J. 839 Christina-Tsigas, E., s e e Goletti, E 1010 Chuma, H., s e e Otsuka, K. 310, 313 Chung, Y., s e e Chambers, R.G. 687, 697 Claffey, B.A., s e e Clayton, K.C. 1159 Clair, J.S.St., s e e Menkhans, D.J. 903 Clark, C. 7n, 8n Clark, LM. 865 Clark, J.S. 35, 648 Clark, J.S., s e e Reed, A.J. 939, 965 Clarke, R. 866n Clayton, K.C. 1159 Cline, EL. 600 Cline, EL., s e e Lu, Y.C. 594, 600 Cline, W.R., s e e Berry, A. 268 Cline, W.R., s e e Berry, R.A. 305, 305n Clodius, R.L. 866 Coase, R.H. 723, 870, 1172 Coate, S., s e e Besley, T. 422 Cobb, C.W. 6, 7, 45 Coble, K.H. 138, 140 Coble, K.H., s e e Hudson, D. 804 Coble, K.H., s e e Knight, T.O. 135, 140n Cochrane, S.H. 435, 436, 437n
I-8 Cochrane, W.W. 209, 213, 244, 251,274, 826 Cochrane, W.W., s e e Wetmore, J.M. 1202 Cocks, K.D. 536 Coeymans, J.E. 18, 62, 72, 252 Coggins, J.S. 1150 Cogill, B., s e e Kennedy, E.T. 418, 433,437n Colander, D. 1187 Colatore, C. 1125 Cole, W.E. 466 Coleman, J.S. 532 Collendel, R.N. 556, 560 Collender, R.N., s e e Ahrendsen, B.L. 541 Collier, E 303n Colling, EL. 193,798 Colfins, A., s e e Oustapassidis, K. 868 Collins, K.J., s e e Bredahl, M.E. 943n, 976 Collins, N. 866 Collins, N.R., s e e Schrader, L. 866 Collins, R.A. 120, 534, 540-542 Collins, R.A., s e e Shepard, L. 529 Colman, D., s e e Traill, B. 549 Colyer, D. 8n Commodity Exchange Authority 799 Connor, J.M. 867, 909, 910, 916, 916n, 953, 1085 Connor, J.M., s e e Binkley, J.K. 905,906n Connol, J.M., s e e Parker, R.C. 915 Connor, J.M., s e e Peterson, E.B. 916 Constantatos, C. 1119 Conway, R., s e e LeBlanc, M. 546 Cooley, T.E 1004 Cooper, R.J. 1048 Cooper, R.J., s e e McLaren, K.J. 1048 Cooper, R.J., s e e McLaren, K.R. 59 Cootner, RH. 771 Cornell, B. 800 Cothern, J., s e e Hall, L. 905,905n, 1156 Coflear, D. 591,592 Cotterill, R.W. 276, 866n, 875n, 900, 901,905, 906, 911,912, 912n Cotterill, R.W., s e e Franklin, A.W. 869 Cotterill, R.W., s e e Marion, B.W. 867 Council for Agricultural Science and Technology 1087, 1099, 1122 Council of Economic Advisers 1091 Covey, T. 183, 184 Cowling, K. 866n, 936 Cowling, K., s e e Rayner, A.J. 545 Cox, C.C. 759 Cox, D. 397, 441,442
Author
Index
Cox, J.C. 129n Cox, T.L. 43 Cox, T.L., s e e Chavas, J.-R 43, 44, 273n, 274, 275, 366, 604, 637n Coyle, B.T. 118 Cragg, J.G. 692 Craig, B.J. 273, 275, 367 Craig, B.J., s e e Alston, J.M. 577n, 588n, 604 Crain, S.J. 804 Crawford, R.G., s e e Klein, B. 877 Crego, A., s e e Larson, D. 62 Crissman, C.C., s e e Antle, J.M. 121,122n, 634 Cromarty, W.A. 544 Cropper, M.L. 1092, 1097, 1098 Cropper, M.L., s e e Arrow, K.J. 1091 Cross, H.R., s e e Knutson, R.D. 1122 Crouhy, M., s e e Crouhy-Veyrac, L. 975 Crouhy-Veyrac, L. 975 Crutchfield, S.R. 1087, 1091, 1120 Crutchfield, S.R., s e e McDonald, J.M. 1091 Cummings Jr., R.W. 992, 993 Cummings, J.T., s e e Askari, H. 48, 161 Currie, J. 422 Currie, J.R. 1011 da Cruz, E.R. 590n, 593, 596, 597, 610 da Cruz, E.R., s e e Ambrosi, I. 610 da Silva, G.L.S.R 594, 601 Dahlgran, R.A. 983, 986 Dalal, AJ. 118 Dalrymple, D.G. 950 Danthine, J.-R 124 Danthine, J.-R, s e e Anderson, R.W. 125n, 127, 131, 132, 779 Das Gupta, M. 415,424 Daughety, A.E 1111, 1124 DaVanzo, J. 419n DaVanzo, J., s e e Butz, W.R 403 David, RA. 233, 473 Davidson, C., s e e Deneckere, D. 901n Davies, J.B. 491,492 Davies, S.E, s e e Vickner, S.S. 901 Davies, S.W., s e e Clarke, R. 866n Davis, D.D. 185, 194 Davis, LS. 600 Davis, SJ., s e e Slaughter, M.J. 975 Davutyan, N. 975 Dawson, RJ., s e e Triffin, A.L. 917 Day, R.H. 111,482, 633 D'Cruz, J.R., s e e Rugman, A.M. 1172 de Finetti, B. 93, 186
Author
Index
de Gorter, H. 220, 221,251 de Janvry, A. 217, 220, 267, 278, 307, 319, 390, 391,472, 479, 646 de Janvry, A., s e e Carletto, C. 252 de Janvry, A., s e e Gordillo, G. 315 de Janvry, A., s e e Key, N. 292 de Janvry, A., s e e McCarthy, N. 292 de Janvry, A., s e e Moscardi, E. 107, 113 de Janvry, A., s e e Sadoulet, E. 310n, 313 de Koning, G.H.J. 710 De Meza, D. 300 de Rezende, G.C., s e e Brandao, A.S.P. 308 Dean, G.W., s e e Lin, W. 106, 120, 270, 272 Deardorff, A.V. 784n Deaton, A. 408, 412, 425, 592, 833-835, 835n, 837n, 852, 1027, 1032, 1202 Debavalya, N., s e e Knodel, J. 419 Debertin, D.L., s e e Goetz, S.J. 267, 278, 352 Debreu, G. 91,652, 1028 DeFritas, G. 497 Deininger, K. 292, 294n, 321,714, 1193 Deininger, K., s e e Binswanger, H.P. 265, 267, 268, 270, 297, 302n, 319 del Rey, E.C. 594, 600 Delgado, C.L., s e e Abdulai, A. 352 Dembele, I., s e e Lilja, N. 411,430n Demsetz, H. 866, 912, 953, 965, 1091 Den Haan, J.W. 838 Deneckere, D. 901n Denison, E.F. 365 Denny, M.G.S., s e e Capalbo, S.M. 366 Denny, M.G.S., s e e Epstein, L.G. 63, 64, 66, 1048 Deodhar, S.Y. 891 Deolalikar, A. 391,423 Deolalikar, A., s e e Behrman, J.R. 437n, 437n Department of Health and Human Services, U.S. 410 Dercon, S. 306n, 415 DeSilva, S. 390, 441 DeVuyst, C., s e e Miller, L.H. 529, 530 Dey, J. 430n, 433 Dey, M.M. 602 Dhar, R., s e e Cotterill, R.W. 901 Dhar, S.K., s e e Raju, J.S. 875n Dhrymes, P.J. 691n Diamond, J. 234 Diarra, M.B., s e e Henry de Frahan, B. 611 Dickens, W.T. 478 Diebold, F.X. 187n
I-9 Diewert, W.E. 30n, 637n, 657, 657n, 661,664, 665, 669, 732, 945, 952n, 956n, 956n, 957 Dillon, J.L. 89, 106, 107 Dillon, J.L., s e e Anderson, J.R. 89 Dillon, J.L., s e e Heady, E.O. 7, 23n, 360, 431 Dinar, A., s e e Zilberman, D. 244 DiNovi, M., s e e Olempska-Beer, Z.S. 1087 Diop, H., s e e Kazmierczak, R.E 887 DiPietre, D.D. 125n Dirkse, S.P., s e e Billups, S.C. 983 Dixit, A.K. 106, 243, 278,909, 976 Dixit, P.M., s e e Ackerman, K. 883, 1167 Dixon, B.L. 559, 826 Dixon, B.L., s e e Ahrendsen, B.L. 541 Dixon, B.L., s e e Barry, P.J. 556 Dixon, B.L., s e e Elam, E. 806n Dixon, B.L., s e e Lufburrow, J. 529 Dixon, B.L., s e e Sonka, S.T. 525 Dixon, B.L., s e e Splett, N.S. 529 Djajic, S. 492 Djata, K.K., s e e Alesina, A.A. 430n Doll, J.P. 646 Doll, J.P., s e e McQuigg, J.D. 646 Domenech, R., s e e Mundlak, Y. 18, 25, 27n, 62, 72 Domingo, L.J., s e e King, E.M. 419, 435,437n Donald, S.G., s e e Cragg, J.G. 692 Dong, X.-Y. 293 Donnelly, J.T., s e e Mittelhammer, R.C. 8n Dorfman, J.E., s e e Alston, J.M. 880 Dorfman, R. 534 Dorner, P. 319n Doss, C.R. 405n, 409 Doster, D.H., s e e McCarl, B.A. 637 Douglas, P.H. 6n Douglas, P.H., s e e Cobb, C.W. 6, 7, 45 Dow, J.C.R. 769 Downs, D., s e e Beckman, S.R. 190, 197, 200 Downs, R.W. 294 Doye, D., s e e Pederson, G. 559 Doyle, C.J. 601 Doyle, C.J., s e e Dryburgh, C.R. 919 Drabenstott, M. 1160, 1193 Drabenstott, M., s e e Barkema, A. 870, 874, 1160 Drake, W., s e e Heller, P. 435 Driscoll, P.J., s e e Karnbhampaty, S.M. 903, 1156 Dryburgh, C.R. 919 D'Souza, S., s e e Chen, L. 415,424 Dubin, H.J., s e e Morris, M.L. 604, 611 Dubin, H.J., s e e Smale, M. 611 Duewer, L.A. 1126
1-10 Duncan, J. 141 Duncan, R.C. 600 Duncan, T., s e e Strauss, J. 1123 Dunn, D. 529 Dunn, J. 952 Duraisamy, E 403,437n Durand, J., s e e Massey, D.S. 485,496 Durand, J.D. 402 Durham, C.A. 868n, 900, 904, 1154 Durham, C.A., s e e Lilja, N. 411,430n Durst, R., s e e LeBlanc, M. 546 Dusak, K. 774, 1151, 1152 Dutt, H.R. 1158 Duval, J.W.T. 799 Dvoretzky, A. 836n Dwyer, G.E 188, 190, 197 Dykes, N.S., s e e Turner, S.C. 1161 Eads, G.C., s e e Arrow, K.J. 1091 Eales, J. 182 Easter, K.W. 610 Easterking, E.H., S e e Lasley, EA. 276 Eaton, B.C. 1085, 1112, 1115, 1172 Eaton, J. 850 Echeverria, R.G. 576n, 601 EchevenSa, R.G., s e e Bojanic, A. 598 Eckard Jr., E.W. 910 Eckel, C.C. 409 Eckstein, Z. 170n, 175, 176, 180, 181,318n Eckstein, Z., s e e Aiyagari, S.R. 837n Eckstein, Z., s e e Eaton, J. 850 Economic Research Service 518, 560, 666n, 718n Eddleman, B.R. 610 Edelman, M., s e e Schmiesing, B.H. 556 Edwards, C. 55,545 Edwards, ER. 766 Eeckhoudt, L. 100, 644 Ehrlich, I. 122 Eichenbaum, M., s e e Aiyagari, S.R. 837n Eilenberg, S. 1028 Eisenstat, P.M., s e e Masson, R.T. 878, 881n Eisgruber, L.M., s e e Boehlje, M.D. 538, 539 Eisgruber, LM., s e e Patrick, G.E 536 Ejiga, N.O.O. 992 Elam, E. 779, 806n, 875 Eldor, R., s e e Benninga, S. 126, 781 Elgin, M., s e e Binswanger, H.E 300, 306n Elhorst, J. 547 Elias, V.J. 594, 600 Elitzak, H. 935, 936, 950
Author
Index
Elkin, K., s e e Ball, V.E. 39 Ellickson, R.C. 292n, 293n, 301n Ellinger, EN. 517, 529, 535, 556 Ellinger, EN., s e e Barry, EJ. 516, 517, 528-530, 534, 538, 543, 552, 556, 557 Ellinger, EN., s e e Gwinn, A.S. 525, 542 Ellinger, EN., s e e Miller, L.H. 521, 529, 530 Ellinger, EN., s e e Nasr, R. 524 Elfinger, EN., s e e Neff, D. 556 Ellinger, EN., s e e Splett, N.S. 529 Ellis, J.R., s e e Folwell, R.J. 1150 Ellsberg, D. 91n Elmer, N., s e e Salin, V. 708 Elterich, J.G., s e e Fernandez-Cornejo, J. 271, 272 Ember, C.R. 422, 433, 434 Emerson, P.M. 759 Emerson, R.D. 347, 350, 368, 473,477--479, 483, 484 Emerson, R.D., s e e Martin, EL. 348n, 502 Emery, H.C. 802 Emlano, N.E., s e e Librero, A. 601,602 Engel, P.L. 437n Engels, F. 462 Engle, B., s e e Eales, J. 182 Engle, R.E 115, 116, 1005n, 1047n Enke, S.A. 981 Ennew, C., s e e Kellard, N. 1158 Enthoven, A.C., s e e Arrow, K.J. 1028 Eom, Y.S. 1092, 1122 Epps, T.W. 805n Epstein, L.G. 59, 63, 64, 66, 132, 1048 Erickson, A., s e e Collender, R.N. 560 Ernstberger, J. 598 Esguerra, E 533 Espenshade, T.J., s e e Muller, T. 497 Espenshade, T.J., s e e White, M.J. 483 Eswaran, M. 268, 270, 305 Evangelou, E, s e e Forsythe, K. 1087 Evans, L.B., s e e Siegfried, J.J. 911n Eveleens, W.M., s e e Scobie, G.M. 594, 601 Evenson, R.E. 22, 22n, 213,214, 363, 371,425, 433,583, 583n, 587, 588n, 589, 590n, 592-594, 595n, 597, 600-604, 605n, 607-609, 640, 706, 710, 714, 1196 Evenson, R.E., s e e Azam, Q.T. 602, 608 Evenson, R.E., s e e Bindlish, V. 358 Evenson, R.E., s e e Birtswanger, H.P. 429 Evenson, R.E., s e e Birkhaeuser, D. 432, 433, 595 Evenson, R.E., s e e Birkhauser, D. 357n
Author
Index
Evenson, R.E., s e e Boyce, J.K. 575n Evenson, R.E., s e e da Cruz, E.R. 590n Evenson, R.E., s e e Dey, M.M. 602 Evenson, R.E., s e e Flores, R 600 Evenson, R.E., s e e Huffman, W.E. 38, 274, 336, 361,365, 366, 575n, 589, 589n, 603,605n, 607, 608 Evenson, R.E., s e e Johnson, D.K. 607 Evenson, R.E., s e e Judd, M.A. 575n Evenson, R.E., s e e Mohan, R. 593 Evenson, R.E., s e e Rosegrant, M.W. 27, 366, 603, 607 Evenson, R.E., s e e Rosenzweig, M.R. 437n, 469 Evenson, R.E., s e e Setboonsarng, S. 593, 594, 602 Evenson, R.E., s e e Welch, E 589, 601 Ewell, R 598
Fackler, EL. 805, 1150, 1159, 1199 Fackler, EL., s e e Frechette, D.L. 853 Fackler, RL., s e e McNew, K. 779, 985n, 1007, 1008 Fackler, RW., s e e Miranda, M.J. 839 Fafchamps, M. 318n, 395,431 Fafchamps, M., s e e de Janvry, A. 278, 390, 391, 472, 479 Fafchamps, M., s e e Gavian, S. 297 Fair, R.C. 181 Falaris, W.M. 484 Falck-Zepeda, J., s e e Traxler, G. 111 FalcoN, C. 1092, 1112 Falkner, E 429 F a l l , A . , s e e Fisher, M.G. 611,612 Fama, E.E 789n, 851,853, 1152, 1157 Faminow, M.D. 974, 983, 1001n, 1010 Fan, S. 603 Fane, G. 361 Farah, A.A. 437n Fare, R. 644, 689 Fare, R., s e e Chambers, R.G. 687, 697 Farid, N., s e e Goletti, E 1010 Farrell, M.J. 656 Farris, RL., s e e Oellermann, C.M. 787 Fausti, S.W. 1149 Fausti, S.W., s e e Feuz, D.M. 1149 Fawson, C. 43, 44 Fawson, C., s e e Bailey, D. 1161 Fazzari, S.M. 547 Featherstone, A.M. 43, 44, 535, 540, 541
1-11 Feder, G. 121,124, 177, 230, 235,237, 296, 299, 300, 303, 304n, 315, 357n, 549, 582n, 592, 594, 643,646, 713, 781, 1150, 1151 Feder, G., s e e Binswanger, H.P. 265,267, 268, 270, 297, 302n, 319 Feder, G., s e e Birkhaeuser, D. 432, 433,595 Feder, G., s e e Birkhauser, D. 357n Feder, G., s e e Deininger, K. 714, 1193 Federal Crop Insurance Corporation 135 Feeney, D. 292 Feeney, D., s e e Feder, G. 300 Fei, J., s e e Liu, T.-J. 819 Fei, J.C.H., s e e Ranis, G. 463,464, 489 Feijbo, V.M. 594, 598, 601 Feinerman, E. 105 Feldstein, H.S., s e e Meinzen-Dick, R. 434 Feldstein, M. 308, 1194 Feller, W. 846 Fenton, J., s e e Dutt, H.R. 1158 Feridhanusetyawan, T., s e e Huffman, W.E. 351 Fernald, J.G., s e e Basu, S. 959 Fernandez-Cornejo, J. 271,272 Ferris, M.C. 983 Ferris, M.C., s e e Billups, S.C. 983 Feuz, D.M. 1149 Feuz, D.M., s e e Fausti, S.W. 1149 Fichett, D.A., s e e Adams, D.W. 558 Fields, G. 430, 466, 477, 480 Findeis, J.L., s e e Hallberg, M.C. 352 Findeis, J.L., s e e Lass, D.A. 353 Finkelshtain, I. 103n Finkelshtain, I., s e e Bar-Shira, Z. 43, 44, 46, 47 Finlayson, J.A. 795 Fitch, R.S., s e e Schmitz, A. 1170 Fischer, M. 529 Fishel, W.L. 609 Fisher, B.S. 938 Fisher, E.O., s e e de Gorter, H. 251 Fisher, EM. 912, 1042 Fisher, I. 660, 665, 819 Fisher, J.D.M., s e e Christiano, L.J. 839 Fisher, M.G. 611,612 Fitzharris, J.C., s e e Peterson, W.L. 597 Fix, M. 497 Fix, M., s e e Taylor, J.E. 497-499 Flaccus, J.A., s e e Dixon, B.L. 559 Fleisher, B.M. 364 Flemming, J.M. 823 Fletcher, L.B., s e e Ulveling, E.E 8n Fletcher, L.B., s e e Ward, R.W. 779 Fletcher, P.L. 469
1-12 Fletcher, S.M., s e e Misra, S.K. 1088 Flinn, J.C. 364 Florencio, C.A., s e e Binswanger, H.E 429 Flores, E 600 Flores, E, s e e Evenson, R.E. 600, 608 Floud, R. 409, 429 Floud, R., s e e Steckel, R.H. 429 Floyd, J.E. 50, 1188 Flyma, E.M., s e e Dixon, B.L. 559 Fogel, R.W. 392, 409, 427, 429 Folbre, N. 402, 442 Folwell, R.J. 1150 Fonseca, M.A.S. 597, 610 Food and Drug Administration 1089, 1125 Food Safety and Inspection Service 1089, 1105, 1120, 1121, 1125, 1128 Foote, R.J. 939n Forker, O.D., s e e Kinnucan, H.W. 959, 960 Forker, O.D., s e e Suzuki, N. 905, 919 Fornari, I., s e e Nerlove, M. 159n, 166, 166n, 179n, 180n, 181 Forsythe, K. 1087 Fort, R. 773n Fortenbery, T.R. 1158 Fortenbery, T.R., s e e Garcia, P. 805 Fortin, B. 398 Fortin, B., s e e Chiappori, P.-A. 397, 398,419 Foster, A.D. 347, 356, 362, 363, 394, 434, 435, 437n, 442, 643, 713 Foster, A.D., s e e Behrman, J.R. 395,435, 437n Foster, K.A. 633 Foster, K.A., s e e Johnson, C.S. 874, 1166 Foster, K.A., s e e Walburger, A.M. 1159 Foster, W.E. 123n, 520 Fox, G. 31n, 598, 601 Fox, G., s e e Haque, A.K.E. 598 Fox, G., s e e Hust, M. 598 Fox, G., s e e Zachariah, O.E.R. 598 Fox, J.A. 1099, 1100 Fox, K . , s e e Strauss, J. 427 Fox, K.A. 545,939, 949, 1190 Fox, L., s e e Burros, R. 422 France, V.G., s e e Canoles, W.B. 765 Franco, G.R. 884 Frank, S.D. 870 Franklin, A.W. 869 Franks, J.R. 529 Frechette, D.L. 853 Frederic, G., s e e Brasselle, A.-S. 296 Freebairn, J. 960, 1145-1147 Freed, R.D., s e e Schwartz, L. 598
Author
Index
Freeman HI, A.M., s e e Cropper, M.L. 1092, 1098 Freeman, R.B., s e e Castillo-Freeman, A.J. 482, 488 French, B. 707, 880, 882, 1125, 1188 French, K., s e e Fama, E.E 789n, 851,853, 1152 Freshwater, D. 517 Freshwater, D., s e e Peoples, K. 559 Freund, R.J. 120 Frey, T., s e e Dunn, D. 529 Fried, H.O. 637n, 655 Frieden, A. 398,419n Friedman, M. 178, 41l, 942n Frisch, R. 1202 Frisvold, G. 275, 305n Froeb, L.M., s e e Werden, G.J. 974 Froot, K.A. 123n Frydman, R. 160 Fuchs, V.R. 400, 409 Fudenberg, D. 906n Fuglie, K., s e e Frisvold, G. 275 Fujimoto, A. 309n Fulati, S., s e e Sadoulet, E. 310n, 313 Fnkuyama, E 532 Fulgiuiti, L. 68 Fulton, M. 1155 Fung, H.-G., s e e Wilson, W. 804 Funkhouser, E. 476, 483 Furtan, W.H., s e e Kraft, D.E 886, 1149, 1169 Furtan, W.H., s e e Nagy, J.G. 600 Furtan, W.H., s e e Schmitz, A. 1168, 1169 Furtan, W.H., s e e Ulrich, A. 598, 601,607, 610 Fttrtan, W.H., s e e van Kooten, G.C. 1151 Fuss, M. 23n, 29n, 31n, 707 Gabbard, S. 348 Gabbard, S., s e e Mines, R. 459, 498 Gabbard, S., s e e Perloff, J.M. 350, 473,478, 479, 484 Gabriel, S.C. 540 Gabriel, S.C., s e e Hughes, D.W. 559 Gabriel, S.C., s e e Lee, J. 551,558 Galbraith, J.K. 47, 918, 1204 Gale, H.E 267, 278, 279 Galeotti, M. 58 Gallagher, P.W. 111 Galopin, C.A., s e e Carter, C.A. 798, 1159 Galor, O. 318n Ganoza, V., s e e Norton, G.W. 594, 610 Garbade, K.D. 787, 999 Garcia, M., s e e Senauer, B. 415
Author
Index
Garcia, P. 193, 805 Garcia, E , s e e Hurt, C.A. 115 Garcia, R, s e e Koontz, S.R. 907, 907n, 999 Garcia, R, s e e Martin, L. 182-184 Garcia, E, s e e Yumkella, K.K. 886 Garcia, R. 268 Gardner, B.D. 270, 278 Gardner, B.L. 134, 135, 140, 181,198n, 245, 375,464, 481,499, 792, 793n, 829, 835, 837, 837n, 887, 913,914n, 936, 938,944, 948n, 951,976, 1168 Gardner, B.L, s e e McNew, K. 839 Gardner, G., s e e Brown, L.R. 209 Gardner, R., s e e Stover, R. 529 Garoyan, L. 877n Gasmi, E 901, 913 Gaspart, E, s e e Baland, J.-M. 317 Gautam, M. 588n, 595n Gavian, S. 297 Gay, G.D. 752n Gbetibouo, M., s e e Evenson, R.E. 592, 594 Geertz, C. 294 Geithman, D.T., s e e Carvajal, M.J. 473 Geithman, E, s e e Marion, B.W. 867, 903 Geithman, E, s e e Quail, G. 903 Gellynck, X., s e e Viaene, J. 868 Gemente, A.C., s e e Pinazza, A.H. 598 Gempesaw lI, C.M., s e e Femandez-Comejo, J. 271,272 Gempesaw II, C.M., s e e Lass, D.A. 352, 353, 370 Genesove, D. 915 George, P.S. 887, 943,943n, 948, 950, 1202 Gersovitz, M., s e e Eaton, J. 850 Gertler, M. 549 Gertler, E 1108 Gertler, E, s e e Banerjee, A. 318 Gertler, R, s e e Newman, J.L. 412n, 429, 443 Gertler, E, s e e Strauss, J. 427 Geweke, J. 116 Ghatak, M., s e e Banerjee, A. 318 Ghez, G.R. 338, 368 Ghosh, S. 826 Gibbons, R. 335,369n Gibson, S. 539 Gilbert, A., s e e Belongia, M. 548, 556 Gilbert, C.L. 759, 820n, 848 Gilbert, C.L., s e e Ghosh, S. 826 Gilbert, R.J. 909 Giles, D.E.A. 787 Gillespie, J.M. 875
1-13 Gilpin, J., s e e Oustapassidis, K. 868 Gintis, H., s e e Bardhan, P.K. 311 Gisser, M. 427, 915,917 Glauber, J.W., s e e Miranda, M.J. 119, 141,839, 850 Glewwe, E 437n Glick, E 430n Glover, D. 304n Goetz, S.J. 267,278, 352 Golan, A. 1150 Goldberg, RK. 886 Goldberg, R.A. 1160 Goldfarb, D., s e e Bigman, D. 802 Goldin, C. 346, 422 Goldring, L.E, s e e Massey, D.S. 496 Goldstein, D.A., s e e Siegel, S. 185 Goletti, E 1010 Gollier, C. 103 Gollier, C., s e e Eeckhoudt, L. 644 Gollin, D., s e e Evenson, R.E. 603 Gollop, EM. 898n Gollop, EM., s e e Ball, V.E. 661,668, 672 Gollop, EM., s e e Jorgenson, D.W. 27, 273, 365 Gonzfilez, H., s e e Massey, D.S. 485 Gonzalez-Vega, C., s e e Aguilera-Alfred, N. 529 Goodger, W.J., s e e Antle, J.M. 111,117 Goodhue, R.E. 228, 874, 1193, 1200, 1201 Goodhue, R.E., s e e Alexander, C. 1201 Goodwin, B.K. 139, 953,963,965,975,999, 1004, 1006, 1007, 1010, 1013, 1014 Goodwin, B.K., s e e Fackler, P.L. 1150, 1159, 1199 Goodwin, B.K., s e e Featherstone, A.M. 43, 44 Goodwin, B.K., s e e Mishra, A.K. 410, 411 Goodwin, B.K., s e e Schroeder, T.C. 787 Goodwin, B.K., s e e Smith, V.H. 138 Goodwin, R.M. 167 Goodwin, T.H. 181, 182 Gopinath, M. 604, 607 Gordillo, G. 315 Gordon, M. 1171, l171n Gorman, W.M. 1030, 1043n Goss, B.A., s e e Giles, D.E.A. 787 Gotsch, N., s e e Regev, U. 647 Gottret, RE., s e e Shumway, C.R. 37, 38 Gould, B.W. 352, 353, 370 Gould, J.P. 51 Gould, J.R., s e e De Meza, D. 300 Grabowski, R., s e e Belbase, K. 364 Graham, D.A. 1092 Graham, D.H. 533
1-14 Graham, D.H., s e e Adams, D.W. 558 Graham, J.W., s e e Beller, A.H. 422 Graham-Tomasi, T., s e e Roe, T.L. 390 Grandmont, J.-M. 172n Granger, C.W.J. 190, 998, 998n, 1000, 1000n Granger, C.WJ., s e e Ashley, R. 1000 Granger, C.W.J., s e e Engle, R.E 1005n Grant, W.R., s e e Brorsen, B.W. 115,961,962, 999, 1149, 1159 Gray, R., s e e Fulton, M. 1155 Gray, R., s e e Schmitz, A. 1149, 1154, 1168, 1169, 1169n Gray, R.W. 759, 765, 769, 771,772, 780, 802, 803, 808, 1152, 1153 Gray, R.W., s e e Tomek, W.G. 177, 182, 184, 794, 801 Green, E.J. 906, 907, 907n Green, J.R., s e e Mas-CoM1, A. 92 Green, R. 1202 Green, R., s e e Antonovitz, E 115, 183 Green, R., s e e Kinney, W. 882 Green, R., s e e Moschini, G. 1202 Green, W.H. 374 Greenhut, M.L. 1153, 1154 Greenwood, M.J. 485,501 Greenwood, M.J., s e e Hunt, G. 477 Gregerson, H., s e e Haygreen, J. 598 Gregory, A., s e e Flond, R. 409, 429 Gregory, P. 421,490 Grennes, T.J. 884 Grennes, T.J., s e e Goodwin, B.K. 999, 1004, 1013, 1014 Grether, D.M., s e e Nerlove, M. 161n, 175, 180, 181 Grey, J.S. 421 Griffith, G.R. 960 Griliches, Z. 8n, 14, 14n, 15, 15n, 18, 22, 51, 62, 218n, 230, 231,274, 336, 360, 365, 388, 428, 544, 545,597, 599, 600, 605, 664n, 1192 Griliches, Z., s e e Klette, T.J. 225 Grimard, J., s e e Bamard, C.H. 517 Grimes, G.A., s e e Hayenga, M.L. 874 Gronau, R. 425 Groote, H., s e e Lilja, N. 411,430n Grossbard-Shechtman, S. 398 Grossfield, K. 597 Grossman, J.B. 497 Grossman, P.J., s e e Eckel, C.C. 409 Grossman, S.J. 872, 1109, 1113, 1119, 1172 Grubel, H.B. 490 Gmnewald, O. 798
Author
Index
Gu, D. 519 GnBaochang, s e e Zeng, Yi 423n Guinnane, T.W. 320, 538 Guinnane, T.W., s e e Besley, T. 422 Gunjal, K. 308 Gunter, L., s e e Hearn, D.H. 267,278 Guo, L., s e e Rozelle, S. 297, 298 Gupta, R.C. 992 Gupta, S. 998, 999 Gustafson, C. 547, 550 Gustafson, R.L. 825, 833, 835, 836, 836n, 837, 840, 855, 1191, 1198 Guttman, J.M. 221 Guveya, E., s e e Macmillan, J. 611 Guyer, J. 430n, 433 Gwilliams, K. 532 Gwinn, A.S. 525, 542 Haavelmo, T. 8 Habib, A. 495 Habib, A., s e e Stahl, C. 495 Hackner, J. 1119 Hadar, J. 95 Haddad, L. 389, 399, 401,437n Haddad, L., s e e Alderman, H. 410 Haddad, L., s e e Hoddinott, J. 409, 437n Hahn, R.W., s e e Arrow, K.J. 1091 Haidacher, R.C., s e e Wohlgenant, M.K. 942, 943,945,946, 948 Halbrendt, C. 1100 Halcrow, H.G. 141 Halim, A. 591 Hall, B.E 268, 269 Hall, L. 905, 905n, 1156 Hall, R.E. 41, 42, 959, 1039, 1040, 1102 Hall, R.E., s e e Slaughter, M.J. 975 HaUam, A., s e e Orazem, RE 336 Hallam, A., s e e Pope, R.D. 631 Hallberg, M.C. 352, 1090 Hallberg, M.C., s e e Lass, D.A. 353 Hailer, L.E. 878 Haller, L.E., s e e Cotterill, R.W. 900, 911 Halter, A.N. 1190 Halweil, B., s e e Brown, L.R. 209 Hamal, K.B. 106 Hamermesh, D.S. 55 Hamilton, J., s e e Kim, C.S. 919 Hamilton, J.D. 183n, 854 Hamilton, S.E 226, 227, 891n, 919 Hammond, J.W., s e e Coggins, J.S. 1150 Handy, C., s e e Kaufman, R 905
Author
Index
Hanf, C.H., s e e von Witzke, H. 1087, 1112 Hangladoran, C., s e e Feder, G. 296, 299 Hannemann, W.M. 1042, 1092 Hanoch, G. 31, 43, 95, 892 Hansen, B.E., s e e Cox, D. 441,442 Hansen, L.E 180, 181 Hansen, E, s e e Eeckhoudt, L. 100 Hanson, G., s e e Peoples, K. 559 Hanson, J.A., s e e Caprio, G. 554 Hanson, S.D. 533 Hanson, S.D., s e e Lapan, H. 127, 129, 130 Hanson, S.D., s e e Myers, R.J. 131,132 Hanson, S.D., s e e Siles, M. 532 Hanssen, H., s e e de Koning, G.H.J. 710 Haque, A.K.E. 598 Hardaker, B., s e e Anderson, J.R. 89 Hardy, W. 529 Harken, B.R. 591 Harl, N.E. 539, 559 Harl, N.E., s e e Lence, S.H. 751n Harp, H.H. 936, 939n Harper, C.D., s e e Cotterill, R.W. 905 Harper, J.K., s e e Williams, J.R. 110 Harrington, W. 1097 Harris, J.R. 466 Harris, T., s e e Arrow, K.J. 836n Harrison, G. 187n Harriss, B. 394, 976, 979, 992, 993, 1002 Hart, O.D. 519, 522, 850 Hart, O.D., s e e Grossman, S.J. 872, 1119, 1172 Hartman, R. 105, 132 Hartmann, EA., s e e Leuthold, R.M. 805 Hartzmark, M.L. 765, 766, 766n, 774, 807 Harvey, A. 594, 598 Harvey, A.C. 852n Hassan, M.D.N., s e e Pitt, M. 389, 395 Hasset, K.A. 243 Hasting, T. 600 Haszler, H.C. 848 Hatchett, S., s e e Antle, J.M. 635 Hatton, T.J. 482 Hauser, R. 804 Hauser, R., s e e Eales, J. 182 Hausker, K. 1161 Hausman, J. 900 Hausman, J.A. 1099 Haveman, R. 430, 437n Havlicek Jr., J., s e e Otto 601 Havlicek Jr., J., s e e Smith, B. 601 Havlicek Jr., J., s e e White, J.E 594, 600, 601 Hay, M.J. 473
1-15 Hayami, Y. 20, 21, 23n, 210, 273, 274, 316, 362, 366, 367, 597 Hayami, Y., s e e Flores, E 600 Hayami, Y., s e e Kawagoe, T. 21,367 Hayami, Y., s e e Morooka, Y. 309n Hayami, Y., s e e Otsuka, K. 310, 313 Hayashi, F. 404 Hayashi, E, s e e Altonji, J. 441 Hayek, EA. 819 Hayenga, M.L. 868n, 874, 974, 1156 Hayenga, M.L., s e e DiPietre, D.D. 125n Hayenga, M.L., s e e I ~ m l e , K.L. 1152 Hayenga, M.L., s e e Lence, S.H. 751n Hayes, D.J., s e e Fox, J.A. 1099, 1100 Hayes, D.J., s e e Hennessy, D.A. 141 Hayes, D.J., s e e Lence, S.H. 779 Hayes, D.J., s e e Shin, S.Y. 1100 Haygreen, J. 598 Hazel1, E 108, 120, 138 Hazell, E, s e e Blarel, B. 293 Hazuka, T.B. 802 Headley, J.C. 7n Heady, E.O. 6, 6n, 7, 8n, 23n, 62, 191,196, 360, 431,481,544 Hearn, D.H. 267, 278 Heath, J.B., s e e Grossfield, K. 597 Heckman, J.J. 373,391,401,407, 408n, 412, 427, 438,478, 483 Heckman, J.J., s e e Ashenfelter, O. 391,407, 408 Hefler, C., s e e Youssef, N. 419, 422 Heien, D.M. 960 Heien, D.M., s e e Dunn, J. 952 Heiman, A. 239 Heiman, A., s e e Zilberman, D. 253,257 Heimforth, K., s e e Marion, B.W. 905,905n Heiner, R.A. 938, 942 Heisey, P., s e e Smale, M. 599 Helfand, G., s e e Berck, P. 633 Heller, P. 435 Hellinghausen, R., s e e Mundlak, Y. 21, 22 Helmberger, P.G. 876n, 1148, 1150 Helmberger, P.G., s e e Imel, B. 866 Helmberger, P.G., s e e Miranda, M.J. 792, 831, 845 Helmberger, P.G., s e e Mueller, W.E 878, 1156 Helmers, G., s e e Mapp, H.P. 535 Helms, B.P., s e e Martell, T.E 768 Henderson, D.R. 870 Henderson, D.R., s e e Frank, S.D. 870 Hendrikse, G.W.J. 876 Hendry, D. 1063n
1-16 Hendry, D., s e e Engle, R.E 1047n Hennessy, D.A. 101, 141,870, 870n, 873,963, 1118, 1162, 1166, 1192, 1193 Hennessy, D.A., s e e Babcock, B.A. 112, 138, 141 Hennessy, D.A., s e e Moschini, G. 644, 647, 709, 712, 726, 1191 Henrichsmeyer, W., s e e Weinschenck, G. 974 Henriques, M.H., s e e Thomas, D. 415, 437n Henry de Frahan, B. 611 Henry de Frahan, B., s e e Boughton, D. 599 Herdt, R.W. 7n Herdt, R.W., s e e Evenson, R.E. 609 Herring, EJ. 554 Herruzo, A.C. 598 Hertel, T.W., s e e Lanclos, D.K. 920 Hertel, T.W., s e e Peterson, E.B. 1149 Hertford, R. 597 Hesp, E, s e e Arhin, K. 883, 884 Hewitt, J.D., s e e Wright, B.D. 134 Hey, J. 187, 190, 191,196, 200 Hicks, J.R. 158, 658, 1151 Hieronymus, T.A. 799 Higgin, E 389, 416 Higgins, M. 410 Higinbotham, H.N., s e e Telser, L.G. 754 Hildebrand, J.R. 7, 8n Hildenbrand, W. 159n Hildreth, C. 939n, 943n Hill, M.A., s e e Anderson, K.H. 419 Hill, M.A., s e e King, E.M. 416, 429 Hill, E 433 Hilliard, J.E. 1158 Hillman, J.S., s e e Bredahl, M.E. 1170, 1171 Hillman, J.S., s e e Schmitz, A. 1170 Hines, J. 597 Hinloopen, J. 916n Hinojosa-Ojeda, R., s e e Robinson, S. 464 Hirshleifer, J. 91,158n Ho, ES., s e e King, R.A. 983 Hoch, I. 8, 8n Hoch, I., s e e Mundlak, Y. 8n, 431 Hochman, E. 720 Hochman, E., s e e Just, R.E. 42, 640, 690, 696, 710 Hochman, E., s e e Rausser, G.C. 106, 854, 1197 Hocking, J.G., s e e Halter, A.N. 1190 Hoddinott, J. 409, 437n, 476, 486, 492 Hoddinott, J., s e e Alderman, H. 410 Hoddinott, J., s e e Haddad, L. 389, 399, 401, 437n
Author
Index
Hodgman, D.R. 527 Hoehn, J.R, s e e van Ravenswaay, E.O. 1092 Hoff, K. 246, 316, 530 Hoffman, A.C. 865,918 Hoffman, G.W. 808 Hoffman, G.W., s e e Duval, J.W.T. 799 Hoffman, M., s e e Kislev, Y. 597,600 Hoffman, S., s e e Chen, L. 414 Holden, K. 1146 Holland, D. 1100 Holland, I., s e e Haygreen, J. 598 Hollander, A. 1163 Holloway, G.J. 887, 889, 890, 908,913, 945, 958, 1117 Holmes, J. 437n Holt, C.A. 187 Holt, C.A., s e e Davis, D.D. 185, 194 Holt, J., s e e Purvis, A. 106, 549 Holt, M.T. 115, 117, 961,962, 1149 Holt, M.T., s e e Aradhyula, S.V. 115, 117 Holt, M.T., s e e Chavas, J.-E 109, 113, 115, 116n, 118, 270, 642, 648, 709, 1158 Holt, M.T., s e e Green, R. 1202 Holthausen, D.M. 124, 177, 781 Holthausen, D.M., s e e Vukina, T. 129n Holtmann, A.G., s e e MacMinn, R.D. 98 Hong, A., s e e ZeUner, A. 187n Hong, K.Y. 592 Hoofnagle, W.S., s e e Mighell, R.L. 870n Hoos, S. 884 Hoos, S., s e e Helmberger, EG. 876n Hopcraft, EN. 591 Hopkin, J.A., s e e Baker, C.B. 525 Hopkin, J.A., s e e Barry, EJ. 516, 517, 529, 534, 538, 543, 552, 556 Hopper, W.D. 7n Homey, M.J. 403 Homey, M.J., s e e McElroy, M.B. 385, 397, 398, 410, 472, 475 Horowitz, A.W. 320n Horowitz, J.K. 138, 647 Horvath, B. 158, 172, 196 Hossain, M., s e e Evenson, R.E. 609 Hotelling, H. 1153 Houck, J.P. 549, 1186 House, W.J. 473,480 Houthakker, H.S. 765, 766n, 772, 777 Howard, J. 594 Howard, W., s e e Van Duren, E. 1160 Howard, W.H. 65, 66, 66n Howell, L.D. 824
Author
1-17
Index
Howitt, R.E. 1187 Howitt, R.E., s e e Paris, Q. 637n Howitt, R.E., s e e Zilberman, D. 244 Hrubovcak, J., s e e LeBlanc, M. 546 Hsu, S. 549 Huang, C.J., s e e Spiller, P.T. 974 Huang, C.L., s e e Misra, S.K. 1088 Huang, K.S. 953 Huang, S.-Y. 276, 896, 904, 919 Huang, T.-L 351 Huang, Y. 7n Huanlt, C. 868 Hubbard, R.G. 544, 547, 548 Hubbard, R.G., s e e Calomiris, C.W. 548 Hubbard, R.G., s e e Fazzari, S.M. 547 Hudson, D. 804 Hudson, M.A., s e e Koontz, S.R. 907, 907n, 999 Hudson, M.A., s e e Staeeter, D.H. 1163 Hueth, B. 1200 Hueth, D. 648 Hueth, D., s e e Just, R.E. 1119 Hueth, L. 1166 Huffman, W.E. 38, 218, 219, 274, 336-338, 344, 346-348, 351-354, 360, 361,365, 366, 370, 371, 375,408, 427,432, 440, 575n, 589, 589n, 593,596, 603, 605n, 607, 608, 714, 1194
Huffman, W.E., s e e Abdulai, A. 364 Huffman, W.E., s e e Evenson, R.E. 605n Huffman, W.E., s e e Martin, P.L. 348n, 502 Huffman, W.E., s e e Rahm, M.R. 355,356 Huffman, W.E., s e e ToNe, J.G. 352, 353,440 Huffman, W.E., s e e Torok, S.J. 483 Hug, E., s e e Chen, L. 415, 424 Hughes Hallett, A.J., s e e Ghosh, S. 826 Hughes, D.R. 558, 1163 Hughes, D.W. 555, 559 Hughes, D.W., s e e Penson, J.B. 545 Hugo, G., s e e Massey, D.S. 482, 485, 488 Hugo, G., s e e Taylor, J.E. 494, 495 Hung, C.S., s e e Greenhut, M.L 1153, 1154 Hunt, G. 477 Hunter, W.C., s e e Gay, G.D. 752n Hurt, C. 1165 Hurt, C.A. 115 Hushak, L.J., s e e Shih, J.T. 8n Hust, M. 598 Hutabarat, B., s e e Evenson, R.E. 603 Huthoefer, L.S., s e e Tronstad, R. 1150 Huu-Vo, D., s e e Roe, T.L. 976 Hyde, C.E. 138, 905n, 914, 959
Hyun, O.-S. 495 Illy, L., s e e Ou6draego, S. 599 Imel, B. 866 Industry Canada 867 Irmes, R. 98, 123n, 138, 265, 270, 877n, 1111 Ippolito, R.A. 881 Iqbal, M. 602 Ireland, N., s e e Stoneman, P. 246 Irias, L.J., s e e Avila, A.ED. 610 Irwin, G. 517, 536 Irwin, G., s e e Lee, W. 556, 559 Irwin, G., s e e White, T. 638 Irwin, H.S. 761 Irwin, S.H. 196, 766 Irwin, S.H., s e e Canoles, W.B. 765 Irwin, S.H., s e e Colling, P.L. 193, 798 Ise, S. 368 Ishii, Y. 103, 126 Isinika, A.C. 604 Jacinto, E., s e e Senauer, B. 415 Jacobs, R.L. 193 Jacobs, S.H. 1091 Jacoby, H. 363, 394, 403, 411,417, 419n, 428, 431,437n Jacoby, H., s e e Glewwe, E 437n Jacquemin, A. 879 Jagannathan, R. 775n Jalan, J. 318n James, J.S., s e e Chalfant, J.A. 873 James, S., s e e Newell, A. 305, 305n Jamison, D. 362, 431,432, 591, 592 Jamison, D., s e e Perraton, H.D. 591 Jarrett, EG., s e e Hildreth, C. 939n, 943n Jarvis, L.S. 166 Jarvis, L.S., s e e Sere, C. 611 Jasdanwalla, Z.Y. 990 Jeffrey, S.R., s e e Richards, T.J. 68 Jelin, E., s e e Balan, J. 487 Jenkins, J.C. 483 Jensen, EE. 548, 721 Jensen, H. 631 Jensen, H., s e e Unnevehr, L.J. 1091, 1114 Jensen, H.H. 353,370, 1126 Jensen, H.H., s e e Carriquiry, A.L. 1092 Jensen, H.H., s e e Choi, E.K. 1092 Jensen, M. 304, 305,519, 520, 524 Jesse, E.V. 877n Jewitt, I. 103 Jha, D., s e e Evenson, R.E. 593,600
1-18 ]ha, D., s e e Kahlon, A.S. 600 Jimenez, E., s e e Cox, D. 397, 441,442 Jimenez, G., s e e Colyer, D. 8n Joakin, J. 320n Jodha, N.S. 301n Johansen, L. 706, 707 Johansen, S. 1006 Johnson Jr., A.C., s e e Jesse, E.V. 877n Johnson, C. 517 Johnson, C.S. 874, 1166 Johnson, D.G. 47, 177, 182, 184, 347, 372, 462, 481,545, 1191 Johnson, D.K. 607 Johnson, G.E. 492 Johnson, G.L. 55, 277, 278, 545,631,707 Johnson, G.V., s e e Caswell, J.A. 1112, 1119 Johnson, G.V., s e e Kolstad, C.D. 1111 Johnson, H.G. 491,826 Johnson, H.G., s e e Blejer, M.I. 483 Johnson, L.L. 777 Johnson, ER., s e e Grennes, TJ. 884 Johnson, S.R., s e e Feinerman, E. 105 Johnson, S.R., s e e Rausser, G.C. 1192 Jolliffe, D. 432 Jolly, R., s e e Pederson, G. 559 Jones Jr., H.B., s e e Lasley, EA. 276 Jones, B.L., s e e Sonka, S.T. 525 Jones, C.I. 335, 336 Jones, C.N. 389, 401,405, 433 Jones, E. 1163 Jones, E., s e e Kenyon, D.E. 802 Jones, L.A., s e e Mighell, R.L. 870 Jones, L.S. 480 Jones, R., s e e Schroeder, T.C. 875 Jones, R.A., s e e Jacobs, R.L. 193 Jones-Lee, M.W. 1098 Jordan, J., s e e Kenyon, D.E. 804 Jorgenson, D.W. 27, 29n, 30n, 52, 54, 57,273, 365,464, 1027, 1031 Jorgenson, D.W., s e e Christensen, L.R. 23, 1190 Jorgenson, D.W., s e e Griliches, Z. 14, 18 Judd, K.L. 839, 853 Judd, M.A. 575n Judge, G.G. 1187 Judge, G.G., s e e Nordin, J.A. 1202 Judge, G.G., s e e Takayama, T. 981, 1153, 1154 Junior, R.G., s e e Strauss, J. 357 Jusefius, K., s e e Johansen, S. 1006 Just, D.R., s e e Wolf, S. 708, 719 Just, R.E. 42, 104, 110-112, 115, 139, 140, 161, 182-184, 226, 235,236, 246, 250, 256n, 308,
Author
Index
478, 632, 634, 640, 644, 647, 650, 690, 696, 703,706, 708,710, 714n, 715-720, 805, 885n, 890, 904, 956, 1119, 1156, 1194, 1196 Just, R.E., s e e Antle, J.M. 717, 720 Just, R.E., s e e Bar-Shira, Z. 709 Just, R.E, s e e Bockstael, N.E. 1122 Just, R.E., s e e Chambers, R.G. 36, 42, 632, 669, 687, 697, 701,975 Just, R.E., s e e Feder, G. 121,124, 177, 230, 237, 357n, 643,713,781, 1150, 1151 Just, R.E., s e e Huffman, W.E. 219 Just, R.E., s e e Pope, R.D. 109, 112, 115, 675, 703n, 704, 705, 705n, 709, 718 Just, R.E., s e e Rausser, G.C. 805n, 1193, 1201 Just, R.E., s e e Smale, M. 121, 710, 721 Kagan, A., s e e Richards, T.J. 882n, 963 Kahl, K.H. 778n, 801n Kahlon, A.S. 600 Kahneman, D. 108, 709 Kaiser, H.M., s e e Kawaguchi, T. 1154 Kaiser, H.M., s e e Liu, D.J. 905 Kaiser, H.M., s e e Suzuki, N. 905, 919 Kako, T. 34 Kalat, K.L., s e e Salant, S.W. 832n Kaldor, D.R., s e e Heady, E.O. 191,196 Kaldor, N. 769, 851, 1151 Kalirajan, K. 268 Kallio, EK. 887 Kalonge, S., s e e Howard, J. 594 Kamara, A. 1153 Kambhampaty, S.M. 903, 1156 Kamien, M.I. 60 Kanbttr, R. 418 Kanbur, R., s e e Alderman, H. 410 Kanbttr, R., s e e Haddad, L. 389 Kanbur, S.M.R. 826 Kao, R., s e e Chavas, J.-E 182 Kapteyn, A. 159n Karagiannis, G., s e e Qniggin, J. 140 Karanja, D.D. 602, 611 Karantininis, K., s e e Gillespie, J.M. 875 Karmajou, E 558 Karp, L.S. 121, 127, 131,132, 907, 908,913 Karp, L.S., s e e Beghin, J.C. 884 Karp, L.S., s e e Collins, R.A. 534, 542 Karrenbrock, J., s e e Pick, D.H. 882n Kashyap, A.K., s e e Hubbard, R.G. 548 Kastens, T.L. 1145n, 1147 Katz, E. 100 Katz, E., s e e Stark, O. 470, 474
Author Index
Katz, L.E, s e e Goldin, C. 346 Katz, M.L. 1119 Kaufman, E 905 Kawagoe, T. 21,367 Kawaguchi, T. 1154 Kawai, M. 759 Kaylen, M.S. 1147 Kazmierczak, R.E 887 Keane, M.R 193 Kehrberg, E.W., s e e Patrick, G.E 591 Kellard, N. 1158 Kelley, T.G., s e e Bera, A.K. 121 Kelly, A., s e e Ball, V.E. 661,668, 672 Kemp, M.C. 491 Kemp, M.C., s e e Flemming, J.M. 823 Kendrick, J.W. 365 Kenkel, D. 1096, 1097 Kenkel, D., s e e Berger, M.C. 1097 Kennedy, E.T. 418,433,437n, 437n Kennedy, J., s e e Vanzetti, D. 1153 Kenyon, D.E. 793n, 802, 804 Kenyon, D.E., s e e Yun, W.-C. 762n Keon, M., s e e Kanbur, R. 418 Keplinger, K.O. 637 Kerr, J.M., s e e Pender, J.L. 299n Kevane, M. 306 Key, N. 292 Keynes, J.M. 769, 770, 819, 820, 825, 856, 1151 Klaaldi, N. 361 Khan, M.H. 594, 601 Khandker, S.R. 429 Khandker, S.R., s e e Pitt, M. 418, 439n Khanna, M. 216, 216n, 253 Khanna, M., s e e Zilberman, D. 253,255 Khatri, Y. 604 Khoju, M.R. 556 Khor, L.B., s e e Winegarden, C.R. 497 Khoury, N., s e e Perrakis, S. 1152 Kiefer, J., s e e Dvoretzky, A. 836n Kiefer, N. 158 Klefer, N., s e e Kapteyn, A. 159n Kllfingsworth, M. 408, 440 Kllmer, R.L., s e e Taylor, T.G. 881n, 904 Klm, C.S. 919 Klm, S. 495 Kimball, M.S. 109n Kimhi, A. 352, 353,408, 429, 440, 538 Kimle, K.L. 1152 Kimnyu, P . K . , s e e Pinckney, T.C. 299 King, E.M. 416, 419, 429, 435,437n King, G.A., s e e French, B. 707
1-19 King, G.A., s e e George, RS. 887, 943,943n, 948,950, 1202 King, R. 319n King, R.A. 983 King, R.A., s e e Bressler, R.G. 887, 974 King, R.R, s e e Fackler, EL. 805 Kinney, W. 882 Kinnucan, H.W. 959, 960, 1165 Kinsey, J. 1163 K i r a n , R , s e e Newell, A. 305, 305n Kirman, A.E 159 Kislev, Y. 8n, 15, 22, 245,268, 597, 600 Kislev, Y., s e e Evenson, R.E. 22, 22n, 213, 214, 583, 583n Kivanda, L., s e e Fox, G. 31n Klasen, S. 415, 424 Kleibenstein, J.B., s e e Fox, J.A. 1099, 1100 Klein, B. 873n, 877, 1109, 1113 Klein, L.R. 8, 677, 688 Klein, N.L. 1091, 1101, 1127 Klemperer, R 909 Klette, T.J. 225 Kietzer, K.M. 850 Kliebenstein, J.B. 874, 1165 Kliebenstein, J.B., s e e Shin, S.Y. 1100 Kling, C.L., s e e Sexton, R.J. 904n, 1011, 1012, 1012n, 1014 Kling, J. 187n Kling, K., s e e Kenyon, D.E. 804 Klotz, C. 358 Klotz-Ingram, C., s e e Frisvold, G. 275 Knapp, K.C. 850 Knaul, E 429 Knetter, M.M. 886 Knetter, M.M., s e e Goldberg, RK. 886 Knight, E 91 Knight, T.O. 135, 140n Knight, T.O., s e e Coble, K.H. 138, 140 Knodel, J. 419 Knoeber, C.R. 874, 1165, 1166, 1200, 1201 Knowles, J.C. 473,485, 496 Knudsen, N. 677n Knutson, M. 600 Knutson, R.D. 1122 Kobayashi, K., s e e Suzuki, N. 919 Kocagil, A.E. 800, 808 Kochar, A. 404, 411 Kofi, T.A. 802 Kohls, R.L. 1139, l160n Kohzadi, N. 1158 Kolb, R.W. 771,774
1-20 Kolb, R.W., s e e Barrett, W.B. 1158 Kolb, R.W., s e e Gay, G.D. 752n Kolner, D., s e e Schmiesing, B.H. 556 Kolstad, C.D. 884, 1092, 1111 Koo, A.Y.C. 319n Koontz, S.R. 907, 907n, 999 Koontz, S.R., s e e Hayenga, M.L. 868n, 974, 1156
Koontz, S.R., s e e Unterschultz, J. 1152 Koontz, S.R., s e e Ward, C.E. 875, 1156, 1157 Kooreman, R 400 Koppenhaver, G.D. 802 Kortum, S. 583 Kostecki, M.M. 884 Kosters, M. 391,401 Kotlikoff, L., s e e Altonji, J. 441 Kotwal, A., s e e Eswaran, M. 268, 270, 305 Kouaouci, A., s e e Massey, D.S. 482, 485,488 Kouaouci, A., s e e Taylor, J.E. 494, 495 Koyck, L. 57 Kraft, D.F. 886, 1149, 1169 Kramer, R.A., s e e Gardner, B.L. 140 Kramer, R.A., s e e Pope, R.D. 98 Kranton, R.E. 308 Krause, M. 100, 101 Kremer, M. 848 Kreps, D.M. 873 Kreps, D.M., s e e Hart, O.D. 850 Krishna, K. 885, 1167 Krishnan, D., s e e Dercon, S. 415 Krishnan, R, s e e Dercon, S. 306n Kroner, K.E, s e e Brenner, RJ. 806n Krueger, A.B., s e e Angrist, J. 428 Krugman, E, s e e Brander, J.A. 1154 Kukanza, M.J., s e e Epps, T.W. 805n Kumar, R 602 Kung, J.K. 301n Kupfuma, B. 594 Kupfuma, B., s e e Mudhara, M. 594, 611 Kuroda, Y. 34 Kuserk, G.J. 768 Kutcher, G.R 305, 305n, 637 Kuyvenhoven, A. 611,612 Kuznesof, RM., s e e Olempska-Beer, Z.S. 1087 Kuznets, S. 427 Kwoka, J.E. 881,882 Lacewell, R.D., s e e Bryant, KJ. 633 Lacewell, R.D., s e e Keplinger, K.O. 637 Lachaal, L. 18, 72 Lacroix, G., s e e Chiappori, R-A. 397, 398, 419
Author
Index
Lacroix, G., s e e Fortin, B. 398 Laderman, E. 556 LaDue, E. 558 LaDue, E., s e e Miller, L.H. 529, 530 LaDue, E., s e e Novak, M. 529 Laffont, J.-J. 311 Laffont, J.-J., s e e Gasmi, E 901,913 LaFrance, J. 1045, 1053, 1070n, 1092, 1191, 1202 LaFrance, J., s e e Green, R. 1202 Lajili, K., s e e Barry, EJ. 520 Lajili, K., s e e Miller, L.H. 521,529, 530 Laker-Ojok, R. 599, 611 LaLonde, R. 497 Lain, D. 412, 413, 428 Lamm, R.M. 905,905n, 960 Lancaster, K.J. 1030 Lanclos, D.K. 920 Landefeld, J.S. 1098 Landes, E.M., s e e Becker, G.S. 413,419n, 421 Lane, J., s e e Waterlow, J.C. 429 Lang, K., s e e Dickens, W.T. 478 Lange, M.D., s e e Huffman, W.E. 352, 353, 370, 440 Langemeier, L.N., s e e Jensen, EE. 548, 721 Langemeier, M.R. 536 Lansink, A.O. 56, 67 Lanzona, L.A. 416, 417 Lapan, H. 98, 123n, 127-130, 132, 134, 779 Lapan, H., s e e Moschini, G. 130, 132, 133 Laroque, G., s e e Deaton, A. 833-835, 835n, 837n, 852 Larson, D. 62, 472 Larson, D., s e e Mundlak, Y. 24, 26 Lasley, EA. 276 Lass, D.A. 352, 353, 370 Lass, D.A., s e e Hallberg, M.C. 352 Latimer, R. 600 Lau, L., s e e Feder, G. 582n, 592, 594 Lau, L.I., s e e Jamison, D. 362, 431,591,592 Lau, L.J. 8n, 32, 42, 657, 689, 890, 956 Lan, L.J., s e e Chou, E.C. 592 Lan, L.J., s e e Christensen, L.R. 23, 1190 Lau, L.J., s e e Jorgenson, D.W. 1031 Lan, L.J., s e e Yotopoulos, RA. 8n, 32, 268 Laufer, L. 391,431 Lave, L.B., s e e Arrow, K.J. 1091 Lavergne, R 868,915 Lavoie, N., s e e Chalfant, J.A. 873 Lavoie, N., s e e Sexton, R.J. 1117, 1142, 1154, 1155, 1162, 1198
Author
1-21
Index
LaW, V. 437n Law, L., s e e Feder, G. 549 Lawrence, J.D., s e e Hayenga, M.L. 874 Lawrence, J.D., s e e Hennessy, D.A. 1166 Lawrence, J.D., s e e Kliebenstein, J.B. 874, 1165 Lawson, J.S., s e e Jensen, EE. 548, 721 Layard, R. 419 Leach, J. 850 Leahy, J.V. 106 Learner, E.E. 975, 1004 Learn, E.W., s e e Wetmore, J.M. 1202 Leatham, D.J. 541 Leathers, H.D. 42, 640, 677n Leathers, H.D., s e e Smale, M. 121,710, 721 LeBlanc, M. 546 Lechine, V., s e e Browning, M. 396, 397, 399, 412 Lee, H. 70 Lee, J. 551,558 Lee, J.-W., s e e Barro, R.J. 337n Lee, LH., s e e Crain, S.J. 804 Lee, L.-E 478, 483 Lee, M.-J., s e e Kimhi, A. 408, 440 Lee, W. 517, 556, 559 Lee, W., s e e Barry, P.J. 556, 559 Leffler, K.B., s e e Klein, B. 873n, 1109, 1113 Lehmann, B., s e e Adler, M. 993 Lehmann-Grube, U. 1119 Lehvall, P. 231 Leiby, J.D., s e e Sumner, D.A. 270 Leland, H.E. 1189 Lele, U.J. 992, 993 Lence, S.H. 126n, 134, 751n, 779, 780 Lent, R., s e e Chen, Z. 891n Lentzner, H., s e e Mensch, B. 435, 437n Lenz, J.E. 1150 Lenz, J.E., s e e Suzuki, N. 905, 919 Leonard, G., s e e Hausman, J. 900 Leontief, W. 719, 1190, 1204 Lerman, Z. 269 Lerner, A.P. 885, 885n LeRoy, S.E, s e e Cooley, T.E 1004 Leslie, J., s e e Cochrane, S.H. 435,436, 437n Leslie, J., s e e Martorell, R. 415 Lesser, W.H., s e e Madhavan, A.N. 878 Leuthold, R.M. 182-184, 779, 802, 805, 1146, 1152
Leuthold, R.M., s e e Garcia, P. 193, 805 Leuthold, R.M., s e e Taylor, G.S. 759 Leveen, E.P., s e e de Janvry, A. 217, 220 Leveen, E.P., s e e Hall, B.E 268, 269
Lever, B.G. 591 Levhari, D., s e e Stark, O. 470, 474 Levine, R. 549, 550 Levinsohn, J., s e e Berry, S.T. 902 Levy, H., s e e Hanoch, G. 95 Levy, M.E. 480 Levy, S. 464 Lewis, W.A. 463,489-491 Li, D., s e e Vukina, T. 129n Li, Z., s e e Lin, J.Y. 296 Liang, J.N. 901 Liang, Y., s e e Chatrath, A. 772 Llanos, T.E 267, 278 Libecap, G.D., s e e Alston, L.J. 297 Librero, A. 593,601,602 Lichtenberg, E. 251 Lichtenberg, E., s e e Chambers, R.G. 648, 1190 Lichtenberg, E., s e e Horowitz, J.K. 138, 647 Liefert, W.M. 1087, 1090 Lieten, G.K. 319n Liew, J., s e e Edwards, ER. 766 Lifran, R. 536 Ligon, E. 850 Ligon, E., s e e Hueth, B. 1200 Ligon, E., s e e Hueth, L. 1166 Lilburn, M.S., s e e Barefoot, S.E 1087 Lilja, N. 411,430n Lim, H., s e e Shumway, C.R. 633 Lima dos Santos, C.A., s e e Cato, J.C. 1125 Lin, B.H. 1150 Lin, C.-T.J. 1099 Lin, C.-T.J., s e e Crutchfield, S.R. 1087, 1091, 1120
Lin, J., s e e Feder, G. 549 Lin, J.Y. 296, 357 Lin, W. 106, 115, 120, 270, 272 Lin, W.L., s e e Yotopoulos, EA. 8n, 32 Lindner, R., s e e Halbrendt, C. 1100 Lindrooth, R.C., s e e Anderson, D.W. 911 Lins, D.A. 550 Lins, D.A., s e e Barry, EJ. 556 Lins, D.A., s e e Ellinger, EN. 535,556 Lins, D.A., s e e Miller, L.H. 529, 530 Lipsey, R.G., s e e Eaton, B.C. 1085, 1112, 1115, 1172 Lipton, M. 496, 826 Litan, R.E. 1111 Litan, R.E., s e e Herring, EJ. 554 Liu, D.J. 905 Liu, T.-J. 819 Liu, Y., s e e Fleisher, B.M. 364
1-22 Lloyd, C.B. 437n Llnch, C. 1068 Loaharanu, E 1088 Lobdell, R., s e e Rempel, H. 492 Locke, RR. 768 Locke, ER., s e e Kuserk, G.J. 768 Loehman, E. 647 Lompo, E, s e e Ou6draego, S. 599 Looney, J. 539 Lopez, R.A., s e e Bhuyan, S. 890, 914n, 916, 917, 917n Lopez, R.E. 34, 35, 35n, 36, 64n, 269, 890, 953 Losq, E. 127 Love, H.A. 113, 647, 886, 891,892, 892n, 959 Love, H.A., s e e Raper, K.C. 893, 914 Love, H.A., s e e Ransser, G.C. 1192 Love, H.A., s e e Saha, A. 549 Loveless, R., s e e Bare, B.B. 598 Lovell, C.A.K., s e e Fried, H.O. 637n, 655 Lovell, M.C. 195 Lowell, B.L., s e e Bean, ED. 497 Lowenberg, D.J. 270, 278 Lowenberg-DeBoer, J., s e e Aghib, A. 611,612 Loyns, R.M., s e e Carter, C.A. 884, 1169, 1170 Lozano Ascencio, E 492 Lu, Y.C. 594, 600 Lubben, R., s e e Sherrick, BJ. 531 Lucas, R.E. 51,882, 1038, 1041 Lucas, R.E., s e e Stokey, N.L. 164, 165n Lucas, R.E.B. 411,474, 476, 478, 486, 487, 492 Lueck, D., s e e Allen, D.W. 531,633, 636, 723, 1166, 1201 Lufburrow, J. 529 Luh, Y.H. 65, 67, 68 Lulu, N.M., s e e Trovato, E 424 Lundberg, S. 385,397,400, 401,407, 410 Luo, H. 140 Luo, X., s e e Feder, G. 549 Lurie, J. 754 Luz Barbosa, M.K.T. 598 Ly, S., s e e Mazzueato, V. 599, 611,612 Lycette, M., s e e Buvinic, M. 430n Lynch, L., s e e Perloff, J.M. 350, 473, 478, 479, 484 Lyon, C.C. 963, 964 Lyon, C.C., s e e Thompson, G.D. 881,963 Lyon, R.M. 1161 MacArthur, J.D., s e e Scott, M.F. 321n MacAulay, T.G., s e e Batterham, R.L. 1153n
Author
Index
Maccini, L.J., s e e Bfinder, A.S. 832 MacCormick, A.J., s e e Leuthold, R.M. 1146 MacDonald, J.M. 911,912 MacDougal, G.D.A. 491 MacDougall, N., s e e Zilberman, D. 244 Machina, M.J. 91,709 MacLaren, D., s e e Carter, C.A. 902n Macmillan, J. 611 MacMinn, R.D. 98 MacRobert, J., s e e Macmillan, J. 611 Maddala, G.S. 478, 483 Maddox, J.G. 481 Madhavan, A.N. 878 Magat, W.A. 1090 Mahajan, V. 249 Mahmud, W. 495 Mahul, O. 141 Mairesse, J. 615 Makana, D.W. 604 Makanda, D., s e e Akgunkov, S. 604 Makau, B.E 601 Makki, S.S. 604, 839 Malathy, R. 403,437n Malathy, R., s e e Duraisamy, P. 437n Maldonado, R. 482 Malik, A. 301 Malinvaud, E. 162 Malliaris, A.G. 1152, 1158 Malthus, T.R 422 Maluccio, J. 390, 441 Manalo, A. 1150 Manaster, S. 767n Manchester, A.C. 1193 Manchester, A.C., s e e Jesse, E.V. 877n Mann, S.C., s e e Manaster, S. 767n Manser, M. 398, 401 Mansfield, E. 231 Mapp, H.E 535 Mapp, H.R, s e e Teague, M.L. 120 Marcet, A., s e e Den Haan, J.W. 838 Marchant, M.A., s e e Luo, H. 140 Marcus, A.J. 106, 774 Marion, B.W. 276, 867, 903, 905, 905n Marion, B.W., s e e Connor, J.M. 867, 909, 910, 953 Marion, B.W., s e e Jesse, E.V. 877n Marion, B.W., s e e Quail, G. 903 Markowitz, H. 95 Marquardt, J., s e e Quail, G. 903 Marquardt, R. 805n Man-a, M.C., s e e Alston, J.M. 576n
Author
Index
Marschak, J. 6 Marschak, J., s e e Arrow, K.J. 836n Marshall, A. 975,977, 977n, 1189 Marshall, R.C., s e e Baldwin, L.H. 1161 Martell, T.E 768 Martella, D., s e e Anandajayasekeram, P. 611, 612 Martella, D., s e e Chisi, M. 611,612 Martin, J.R. 536 Martin, L. 182-184, 1201 Martin, EL. 348n, 482, 493,498, 499, 502 Martin, P.L., s e e Taylor, J.E. 497-499, 1188, 1195 Martin, S., s e e Hinloopen, J. 916n Martinez, J.C. 597 Martinez, S. 610 Martorell, R. 415 Marttila, J. 915 Maruszko, L.M., s e e Todaro, M.P. 466 Mas-Colell, A. 92 Mason, T.I., s e e Dwyer, G.P. 188, 190, 197 Massell, B.F. 823 MassengilI, H.E., s e e Shuford, E. 186n Massey, D.S. 482, 485,488, 496 Massey, D.S., s e e Taylor, J.E. 494, 495 Masson, R.T. 878,881n Masson, R.T., s e e Baumer, D.L. 878n, 878n Masson, R.T., s e e Ippolito, R.A. 881 Masson, R.T., s e e Madhavan, A.N. 878 Masters, W.A., s e e Ahmed, M. 599 Matoussi, M.-S., s e e Laffont, J.-J. 311 Matsuoka, S., s e e Pinazza, A.H. 598 Mattila, J.P., s e e Orazem, P.E 348 Matulich, S.C. 268 Matulich, S.C., s e e Mittelhammer, R.C. 688, 690, 730, 731n, 732 Mazhangara, E., s e e Mudhara, M. 594, 611 Mazzueato, V. 598, 599, 611,612 McAfee, R.P. 918n Mccabe, N., s e e Kenyon, D.E. 804 McCalla, A.E 884 McCarl, B.A. 637 McCarl, B.A., s e e Baker, T.G. 639 McCarl, B.A., s e e Brink, L. 107 McCarl, B.A., s e e Keplinger, K.O. 637 McCarthy, N. 292 McClennen, E.E 158n McCloskey, D. 293, 710, 1204 McCorriston, S. 276, 875,920 McCracken, V.A., s e e Folwell, R.J. 1150 McCurdy, C., s e e Goodwin, B.K. 999, 1004
1-23 McDonald, J.M. 1091 McDonald, R. 243 McElroy, M.B. 385, 397-399, 410, 472, 475, 702 McElroy, M.B., s e e Homey, M.J. 403 McFadden, D. 29n, 196n, 725, 1039 McFadden, D., s e e Fuss, M. 23n, 29n, 31n McGowan, J.J., s e e Fishel, EM. 912 McGreevy, W.E, s e e Buvinic, M. 430n McGuckin, T., s e e Antle, J.M. 209n, 218n McGuire, J.S. 436 McGuirk, A. 25, 27, 72, 217, 249, 250 McGuirk, A., s e e Kenyon, D.E. 802 McGuirk, A., s e e Yun, W.-C. 762n Mclntire, J., s e e Binswanger, H.E 211 McKay, H., s e e Van Duren, E. 1160 McKinnon, R.I. 127 McKinsey, J., s e e Evenson, R.E. 593, 602 McKissick, J., s e e Turner, S.C. 1161 McLaren, J. 850 McLaren, K.J. 1048 McLaren, K.R. 59 McLaren, K.R., s e e Cooper, R.J. 1048 McLaughlin, E.W. 876 McMillan, J. 296 McMillan, J., s e e McAfee, R.E 918n McNamara, K.T., s e e Hearn, D.H. 267, 278 McNeil, T., s e e Tronstad, R. 182 McNew, K. 779, 839, 985n, 1007, 1008 Mcnulty, M.S., s e e Grunewald, O. 798 McQuigg, J.D. 646 McWilliams, B. 234 Mearns, R. 293 Meckling, W., s e e Jensen, M. 304, 305, 519, 520 Medema, S.G. 1187 Meehan, J.W., s e e Rosengren, E.S. 1164 Meehl, E 196 Mehl, E 753 Meinzen-Dick, R. 434 Melichar, E. 517 Melitz, J,, s e e Cronhy-Veyrac, L. 975 Melnick, R. 894, 904 Mendonca, R., s e e Barros, R. 422 Menger, K. 95n Menkhaus, D.J. 903 Mensch, B. 435,437n Mercier, S., s e e Huffman, W.E. 354 Mesbah, D., s e e Carter, M.R. 306n, 316 Metcalf, D., s e e Nickell, S.J. 915 Metcalf, G.E., s e e Hasset, K.A. 243
1-24 Metternick-Jones, M.A., s e e Buffier, B.D. 517, 556 Meyer, J. 96, 100, 103,539 Meyer, R.L. 558 Meyer, R.L., s e e Esguerra, E 533 Meyers, W., s e e Bredahl, M.E. 976 Michael, E 975 Michael, R.T. 430 Michael, R.T., s e e Becket, G.S. 413,419n, 421 Miedema, A.K. 962 Mighell, R.L. 870, 870n Migot-Adholla, S. 299 Milg-rom, E 873,909 Mill, J.S. 975 Miller, B.D. 414, 415,423n, 424 Miller, L.H. 521, 529, 530 Miller, R.I., s e e Guinnane, T.W. 320 Mills, D.E. 875n Mills, E.S. 170 Milon, J.W., s e e Lin, C.-T.J. 1099 Min, C., s e e Zellner, A. 187n Minami, D., s e e French, B. 707 Mincer, J. 338, 339, 391,401,405,430, 467,486 Mincer, J., s e e Layard, R. 419 Mines, R. 459, 498 Mines, R., s e e Gabbard, S. 348 Minhas, B.S., s e e Arrow, KJ. 23 Mintert, J., s e e Schroeder, T.C. 875 Miracle, D.S. 749 Miranda, M.J. 119, 141,159n, 160n, 792, 831, 839, 845, 850, 852, 853 Miranda, M.J., s e e Makki, S.S. 839 Miranowski, J., s e e Just, R.E. 308, 1194 Miranowski, J., s e e Orazem, EE 180 Mirrlees, J.A. 822 Mischen, E, s e e Richards, T.J. 882n, 963 Mishra, A.K. 410, 411 Misra, S.K. 1088 Mittelhammer, R.C. 8n, 688, 690, 730, 731n, 732 Mittelhammer, R.C., s e e Lenz, J.E. 1150 Mittelhammer, R.C., s e e Wahl, T.I. 1150 Mjelde, J.W., s e e Bryant, K.J. 633 Modest, D.M., s e e Marcus, A.J. 106 Moghnieh, G.A., s e e Featherstone, A.M. 43, 44 Mohan, R. 420, 421,593 Mohendru, I.D. 990 Mohnen, E, s e e Mairesse, J. 615 Mojduszka, E.M., s e e Caswell, J.A. 1086, 1090, 1114 Mokhtari, M. 975
Author
Index
Mokler, R.S., s e e Leuthold, R.M. 779 Monares, A. 598 Monier-Dilhan, S., s e e Hollander, A. 1163 Monke, E., s e e Tronstad, R. 1150 Monson, M.J., s e e Taylor, T.G. 65 Monteiro, A. 597, 610 Montgomery, M.R. 419 Moock, E 395n, 430n, 432, 591 Moock, E, s e e Jamison, D. 432, 591,592 Moock, E, s e e Martorell, R. 415 Mookherjee, D. 311 Mookherjee, D., s e e Banerjee, A. 311n Moore, C.V., s e e Bessler, D.A. 186n Moore, C.V., s e e Lin, W. 106, 120, 270, 272 Moore, K., s e e Fischer, M. 529 Moore, S., s e e Simon, J.L. 497 Mora, M. 764 Morcom, C., s e e Kremer, M. 848 Morgan, C.W., s e e McCorriston, S. 276 Morgan, W., s e e Strak, J. 868 Morgenstem, O., s e e yon Neumann, J. 93n Moil, H., s e e Lin, B.H. 1150 Moricochi, E 597, 610 Moro, D., s e e Moschini, G. 1202 Morooka, Y. 309n Morris, M.L. 604, 611 Morrison, CJ. 649, 963, 966 Mosak, J.L. 942n Moscardi, E. 107, 113 Moschini, G. 41,112, 130, 132, 133, 644, 647, 704, 705n, 709, 712, 726, 1191, 1202 Moschini, G., s e e Holt, M.T. 115, 117 Moschini, G., s e e Lapan, H. 98, 123n, 127-130, 132, 134, 779 Moss, C.B. 112, 1172 Moss, C.B., s e e Featherstone, A.M. 535,540, 541 Moss, C.B., s e e Purvis, A. 106, 549 Moss, C.B., s e e Thttrow, A.E 243 Moss, L.M., s e e Barry, EJ. 528 Motta, M. 1119 Mruthyunjaya, s e e Kumar, E 602 Muchnik, E. 598, 610 Mudhara, M. 594, 611 Mudimuk, G., s e e Macmillan, J. 611 Muellbauer, J. 1038, 1040 Muellbauer, J., s e e Deaton, A. 408, 412, 425, 1032, 1202 Mueller, B. 300 Mueller, R.A.E., s e e Gupta, S. 998, 999 Mueller, R.A.E., s e e Sumner, D.A. 797
Author
Index
Mueller, W.E 878, 1156 Mueller, W.E, s e e Clodius, R.L. 866 Mueller, W.F., s e e Connor, J.M. 867, 909, 910, 953 Mueller, W.E, s e e Marion, B.W. 867 Mueller, W.E, s e e Wills, R.L. 909 Muirhead, S. 1156 Mukhopadhyay, S. 394, 395 Mulherin, J.H. 754 Mullen, J.D,, s e e Wohlgenant, M.K. 951,962, 964 Muller, T. 497 Mullin, W.R, s e e Genesove, D. 915 Mundlak, Y. 8, 8n, 9, 10n, 11, 18, 21, 22, 23n, 24-26, 27n, 30, 30n, 33, 34n, 41, 46, 47, 47n, 48-50, 53, 57, 57n, 62, 68, 72, 72n, 158n, 209n, 431,633, 637, 651,691,698, 709, 712, 713, 723,726, 1190 Mundlak, Y., s e e Cavallo, D. 72, 251,252 Mundlak, Y., s e e Coeymans, J.E. 18, 62, 72, 252 Mundlak, Y., s e e Fuss, M. 23n, 31n Mundlak, Y., s e e Larson, D. 62, 472 Mundlak, Y., s e e McGuirk, A. 25, 27, 72, 217, 249, 250 Mundlak, Y., s e e Rausser, G.C. 1192 Mufioz-Pifia, C., s e e Key, N. 292 Munshi, K., s e e Banerjee, A. 311n Murdock, G.R 433 Murniningtyas, E., s e e Love, H.A. 886, 891, 892n Murphy, A. 186, 186n, 187, 187n Murphy, J.A. 766, 775n Murphy, K.M., s e e Becker, G.S. 335 Murray, B.C. 956n Murray, B.C., s e e Anderson, D.W. 911 Murray, C. 422 Murty, A.R., s e e Bidinger, RD. 308 Murua, J.-R., s e e Alston, J.M. 880 Musick, D.C., s e e Brester, G.W. 962 Mutemeri, L., s e e Macmillan, J. 611 Muth, J.E 162, 167, 172, 175, 178, 195, 825, 1198 Muth, M.K. 891,892, 903,913, 955,956, 959n Mwabu, G. 429 Mwabu, G., s e e Evenson, R.E. 363,425 Mwape, M., s e e Chisi, M. 611,612 Myers, R.J. 109, 123n, 131,132, 779, 1005 Myers, R.J., s e e Akgunkov, S. 604 Myers, R.J., s e e Duncan, J. 141 Myers, R.J., s e e Tomek, W.G. 1005 Myers, W.H., s e e Bredahl, M.E. 943n
1-25 Nabi, I. 487 Nadiri, M.I. 57, 1027 Nagarajan, G. 309n Nagase, N., s e e Nawata, K. 373 Nagy, J.G. 594, 597, 600-602 Nakosteen, R.A. 484 NaRanong, V. 416, 428, 437n, 439 Narasimhan, C. 875n Nartea, G., s e e Barry, RJ. 537 Nash, E.K., s e e Shumway, C.R. 42, 640, 653, 671n, 674, 690, 693,696 Nash, J.F. 398 Nasr, R. 524 National Commission on Food Marketing 866, 953 National Research Council 436, 1086-1090, 1115 Nawata, K. 373 Neff, D. 556 Neff, D., s e e Hauser, R. 804 Nehring, R., s e e Ball, V.E. 26, 26n, 209n, 272, 273, 365, 661 Nelson, C.H. 111,113, 549,647 Nelson, C.H., s e e Khoju, M.R. 556 Nelson, C.H., s e e Loehman, E. 647 Nelson, D.B. 116 Nelson, J. 485 Nelson, K.E., s e e Duewer, L.A. 1126 Nelson, R 910, 1112 Nelson, R.G. 187, 189, 190, 194, 196, 197, 200 Nelson, R.G., s e e Kinnucan, H.W. 1165 Nelton, S. 527 Nerlove, M. 36n, 48, 115, 158, 159, 159n, 160, 160n, 161,161n, 162, 163, 166, 166n, 167 .... 169, 170, 173n, 175, 176, 179n, 180, 180n, 181,194-196, 198, 418, 419n, 648,652, 706, 708, 712, 713, 1191, 1203 Nerlove, M., s e e Horvath, B. 158, 172, 196 Netter, J.M., s e e Mulherin, J.H. 754 Netz, J.S. 1150 Nevo, A. 902 Newbery, D.M.G. 89, 98, 113, 127, 128,265, 270, 310n, 826, 828, 829, 831,837n, 849 Newbery, D.M.G., s e e Scott, M.F. 321n Newbold, P., s e e Kellard, N. 1158 Newell, A. 305, 305n Newman, A.E, s e e Banerjee, A.V. 318, 318n Newman, D.H. 598 Newman, D.H., s e e Seldon, B.J. 601 Newman, J.L. 412n, 429, 443
1-26 Newmark, C.M. 905, 906 Ngenge, A.W., s e e Brorsen, B.W. 999 Nguyen, D. 21 Nichman, M., s e e Waterlow, J.C. 429 Nicholls, W.H. 865, 1198 Nickell, S.J. 915 Nishio, A., s e e Feder, G. 315 Nobay, A.R., s e e Michael, E 975 Noeme, C., s e e Oustapassidis, K. 868 Noll, R.G., s e e Arrow, K.J. 1091 Nordin, J.A. 1202 Norgaard, R.B. 217, 611 Norman, G., s e e Greenhut, M.L. 1153, 1154 Norman, V., s e e Dixit, A.K. 976 Norton, G.W. 593, 594, 598, 600, 604, 610 Norton, G.W., s e e Alston, J.M. 218, 225, 918, 1119 Norton G.W., s e e Bouchet, E 38 Norton G.W., s e e Easter, K.W. 610 Norton G.W., s e e Martinez, S. 610 Norton G.W., s e e Smith, B. 601 Norton G.W., s e e Sundquist, W.B. 601 Nourse E.G. 871,876 Novak E 538 Novak E, s e e Unterschultz, J. 1152 Novak M. 529 Nuckton, C.E, s e e French, B. 882 Nugent, J. 293 Nunez, J., s e e Ribero, R. 429 Nusser, S.M., s e e Carriquiry, A.L. 1092 Oberal, A.S. 485, 496 Obsffeld, M. 1012 Ocampo, M.B., s e e Librero, A. 601 O'Connell, J., s e e Kinney, W. 882 O'Donnell, C.J. 98 OECD 273-275, 347, 352 Oehmke, J.E 604 Oehmke, J.E, s e e Akgunkov, S. 604 Oehmke, J.E, s e e Makana, D.W. 604 Oehmke, J.E, s e e Schwartz, L. 598,611 Oehmke, J.E, s e e Sterns, J.A. 611 Oellermann, C.M. 787 Officer, L. 975 O'Hara, D.J., s e e Cochrane, S.H. 435,436, 437n Oi, W.Y. 822 Olempska-Beer, Z.S. 1087 Olinto, E 304n, 305 Olinto, E, s e e Carter, M.R. 300 Olinto, E, s e e Deininger, K. 294n Ollinger, M. 1128
Author
Index
Ollinger, M., s e e Crutchfield, S.R. 1087, 1091, 1120
Ollinger, M., s e e Roberts, T. 1091, 1120 Olmstead, A.L. 212, 213,233 Olmstead, A.L., s e e Martin, EL. 482 Olmstead, J. 243 Olson, M. 352 Olson-Lanjouw, J. 304n, 310n O'Mara, G.T., s e e Feder, G. 235 Onchan, T., s e e Feder, G. 296, 299 Orazem, P.E 180, 336, 348 Orazem, EE, s e e Baur, R.E 797 Orazem, EE, s e e Huang, T.-L. 351 Orden, D., s e e Bouchet, E 38 Orivel, E, s e e Perraton, H.D. 591 Ormiston, M.B. 101,103 Ormiston, M.B., s e e Meyer, J. 100, 103 Ortalo-Magn6, E, s e e Goodwin, B.K. 975 Ortiz, J., s e e Norton, G.W. 598, 604 Ortiz-Monasterio, R.J.I., s e e Traxler, G. 111 Osborne, N., s e e Hughes, D.R. 558 Ossard, H., s e e Hollander, A. 1163 Otsuka, K. 310, 313, 319n Otsuka, K., s e e Hayami, Y. 316 Otsuka, K., s e e Nagarajan, G. 309n Otto 601 O t t o , D . , s e e White, J.E 600 Ou6draego, S. 599 Ou6draego, S., s e e Bertelsen, M. 611,612 Oustapassidis, K. 868 Oustapassidis, K, s e e Vlachvei, A. 910 Overdahl, J.A., s e e Mulherin, J.H. 754 Paarsch, H. 850 Pachico, D.H. 591 Paczkowski, R., s e e Norton, G.W. 593, 598 Padberg, D.I., s e e Caswell, J.A. 1090, 1112 Pagan, A.R. 117 Pagoulatos, E. 909, 911,917 Pagoulatos, E., s e e Azzam, A.M. 898, 903, 919, 955 Pakes, A., s e e Berry, S.T. 902 Palma, G. 819 Palma, V., s e e da Cruz, E.R. 593,596, 597, 610 Palmer, J.L. 422, 423 Palmquist, R.B. 1092, 1107 Pang, J.S., s e e Ferris, M.C. 983 Panzar, J.C. 1101, 1117 Panzar, J.C., s e e Baumol, W.J. 267n, 639, 908, 1117 Pardey, P.G. 273, 275, 575n
Author
Index
Pardey, EG., s e e Alston, J.M. 218, 225, 576n, 577n, 588n, 604, 918, 1119 Pardey, EG., s e e Craig, B.J. 273,275, 367 Pardey, EG., s e e Fan, S. 603 Pardey, EG., s e e Norton, G.W. 598, 604 Paris, Q. 118, 633, 637n Parish, R.M. 960 Park, A. 819, 839 Park, A., s e e Williams, J.C. 763n Park, T., s e e Azzam, A.M. 891,907 Park, T., s e e Pick, D.H. 886 Parker, D. 239, 254, 963, 1150 Parker, D., s e e Just, R.E. 250, 256n Parker, R.C. 915 Parliarou, D., s e e Lianos, T.E 267,278 Parsons, A., s e e Halbrendt, C. 1100 Parsons, H.L., s e e Brewster, J.M. 47 Pashardes, P. 1068 Pashigian, B.E 789n Passel, J.S., s e e Fix, M. 497 Paterno, E.M., s e e Orazem, EE 336 Paterson, T.W., s e e Mueller, W.E 878, 1156 Patrick, G.E 518, 536, 591 Patrick, G.F., s e e Langemeier, M.R. 536 Patterson, E. 1087 Patterson, EM. 886, 886n Paul, A.B. 782, 832 Paul, C.J.M. 1190, 1197 Paxson, C. 408n Pebley, A.R., s e e Amin, S. 414 Peck, A.E. 752n, 761,764, 779, 783, 803n, 853, 1153 Peck, A.E., s e e Williams, J.C. 763n Pederson, G. 556, 559 Pee, T.Y. 597 Peel, D., s e e Michael, P. 975 Pellegrino, A., s e e Massey, D.S. 482, 485,488 Pellegrino, A., s e e Taylor, J.E. 494, 495 Pender, J.L. 299n Pender, J.L., s e e Fafchamps, M. 318n Penson, J.B. 545 Penson, J.B., s e e Hughes, D.W. 555 Peoples, K. 559 Pepper, H.A., s e e Barry, EJ. 556 Perez, M., s e e Librero, A. 593, 601 Perloff, J.M. 349, 350, 473,478, 479, 484, 1193 Perloff, J.M., s e e Berck, E 212, 880 Perloff, J.M., s e e Buschena, D.E. 885, 891 Perloff, J.M., s e e Hyde, C.E. 905n, 914, 959 Perloff, J.M., s e e Ise, S. 368 Perloff, J.M., s e e Karl?, L.S. 907, 908, 913
1-27 Perloff, J.M., s e e Rausser, G.C. 1203 Perloff, J.M., s e e Rubin, D.K. 369 Perrakis, S. 1152 Perrakis, S., s e e Constantatos, C. 1119 Perraton, H.D. 591 Perrin, R.K. 544, 962, 1101, 1111, 1112, 1126 Perrin, R.K., s e e Fulginiti, L. 68 Perry, M.K. 870, 872n Pesaran, M.H. 116n, 173, 178, 193 Pesek, J., s e e Haibrendt, C. 1100 Peters, H.E. 397, 421 Peters, E, s e e Kennedy, E.T. 437n Petersen, B., s e e Fazzari, S.M. 547 Petersen, M. 517, 526, 528 Peterson, E.B. 916, 1149 Peterson, E.B., s e e Connor, J.M. 916, 916n Peterson, E.B., s e e Kambhampaty, S.M. 903, 1156 Peterson, J.R., s e e King, E.M. 419, 435,437n Peterson, M.C., s e e Bailey, D. 1161 Peterson, R.A., s e e Mahajan, V. 249 Peterson, W.L. 597, 600 Peterson, W.L., s e e Bredahl, M.E. 600 Petersoni W.L., s e e Davis, J.S. 600 Peterson, W.L., s e e Kislev, Y. 8n, 15, 22, 268 Petraglia, L.M. 879 Petzel, T.E. 799 Pfann, G.A., s e e Hamermesh, D.S. 55 Pflueger, B.W. 526 Pfouts, R.W. 677 Phelps, E.S., s e e Frydman, R. 160 Phillips, M., s e e Just, R.E. 250, 256n Phimister, E. 536, 537 Pick, D.H. 882n, 886 Piesse, J., s e e Thirtle, C. 604 Piggott, R.R., s e e Myers, R.J. 1005 Pinazza, A.H. 598 Pinches, G.E. 539n Pinckney, T.C. 299 Pindyck, R.S. 544, 851 Pindyck, R.S., s e e Dixit, A.K. 106, 243,278 Ping, Tu, s e e Zeng, Yi 423n Pingali, E, s e e Antle, J.M. 359 Pingali, E, s e e Smale, M. 611 Pingali, E, s e e Traxlel; G. 604 Pinherio, A.E., s e e Bravo-Ureta, B.E. 364 Piore, M.J. 498 Pippenger, J., s e e Davutyan, N. 975 Pitt, M. 121,357, 389, 390, 395,415,418,439n, 441 Place, F., s e e Baland, J.-M. 317
1-28 Place, E, s e e Blarel, B. 293 Plain, R., s e e Kastens, T.L. 1145n, 1147 Platteau, J.-E 291,297n, 301,314 Platteau, J.-R, s e e Andre, C. 294 Platteau, J.-R, s e e Baland, J.-M. 317 Platteau, J.-R, s e e Brasselle, A.-S. 296 Plaxico, J.S., s e e Martin, J.R. 536 Plott, C. 188 Pokhrel, T., s e e Morris, M.L. 604, 611 Pollak, R.A. 1032, 1033, 1040-1042 Pollak, R.A., s e e Behrman, J.R. 393 Pollak, R.A., s e e Lundberg, S. 385, 397, 400, 401,410 Pomareda, C., s e e Norton, G.W. 594, 610 Pope, A., s e e Karp, L.S. 121 Pope, R.D. 97, 98, 103, 104, 109, 112, 115, 118, 119, 631,639, 650, 661,675, 694, 703n, 704, 705,705n, 709, 718 Pope, R.D., s e e Chambers, R.G. 31n, 650, 661, 718n Pope, R.D., s e e Chavas, J.-R 118, 182 Pope, R.D., s e e Coble, K.H. 138, 140 Pope, R.D., s e e Gardner, B.D. 270, 278 Pope, R.D., s e e Just, R.E. 104, 110, 111,478, 647, 650, 703,714n, 715-718, 1196 Pope, R.D., s e e Shumway, C.R. 42, 640, 653, 671n, 674, 690, 693,696 Pope, R.D., s e e Tolley, H.D. 110 Popkin, B.M. 415 Popldn, B.M., s e e McGuire, J.S. 436 Porter, R.H. 889n Porter, R.H., s e e Green, E.J. 906, 907, 907n Portes, A. 496, 532 Portney, ER., s e e Arrow, K.J. 1091 Portney, RR., s e e Harrington, W. 1097 Posada, R.T., s e e ScoNe, G.M. 597 Posner, R.A. 915 Powell, M. 1087, 1090 Power, A.E 598 Powers, M.J. 749, 759 Powers, N.J. 881,882 Prakash, G. 1012 Pratt, J. 94, 270 Prautzsch, H., s e e Boehm, W. 839 Pray, C.E. 593, 594, 597,602 Pray, C.E., s e e Evenson, R.E. 608 Prebisch, R. 819, 825 Preckel, EV., s e e Featherstone, A.M. 535, 540, 541 Preckel, RV., s e e Nelson, C.H. 111, 113, 647 Preckel, RV., s e e Peterson, E.B. 1149
Author
Index
Prentice, B.E., s e e Brinkman, G.L. 598 Prentice, R, s e e Peoples, K. 559 Prescott, R., s e e Pope, R.D. 639 President's National Advisory Commission on Rural Poverty 480, 481 Preston, L., s e e Collins, N. 866 Preston, S. 421,423,424 Preston, S., s e e Farah, A.A. 437n Preston, S., s e e Mensch, B. 435,437n Primont, D., s e e Blackorby, C. 635n, 658, 668, 725 Priolon, J., s e e Huault, C. 868 Protopapadakis, A.A. 975 Provost, C., s e e Murdock, G.R 433 Prozecanski, A.C., s e e Blejer, M.I. 483 Pruitt, S.W. 798 Pudasaini, S.E 362, 591 Purcell, D.L. 576n, 608n Purcell, W.D. 903 Purcell, W.D., s e e Kambhampaty, S.M. 903, 1156 Purcell, W.D., s e e Yun, W.-C. 762n Purvis, A. 106, 549 Putler, D.S. 355 Pumam, JJ. 947n Pumam, R.D. 532 Putsis, W.R 911 Putsis, W.R, s e e Cotterill, R.W. 901 Pyatt, G. 832 Pyle, D.H. 120 Pyle, D.H., s e e Leland, H.E. 1189 Quail, G. 903 Quance, L., s e e Johnson, G.L. 55,277, 278, 545, 707 Quance, L., s e e Lu, Y.C. 594, 600 Quance, L., s e e Tweeten, L.G. 8n, 549 Quibria, M.G. 311,491 Quiggin, J. 91, 140, 709 Quiggin, J., s e e Blarel, B. 293 Quiggin, J., s e e Chambers, R.G. 104, 647, 709 Quirk, J., s e e Fort, R. 773n Quisumbing, A,R. 406, 411,416, 431,442 Quisumbing, A.R., s e e Fafchamps, M. 395, 431 Quisumbing, A,R., s e e Meinzen-Dick, R. 434 Quisumbing, M.A., s e e Nagarajan, G. 309n Quizon, J., s e e Evenson, R.E. 593,602 Rabbinge, R., s e e de Koning, G.H.J. 710 Rader, T. 1028 Rahm, M.R. 355, 356
Author
1-29
Index
Rahman, M.L. 556 Rahman, O., s e e Strauss, J. 427 Rajan, R., s e e Petersen, M. 517, 526, 528 Rajaram, S., s e e Smale, M. 611 Rajaraman, I. 802 Raju, J.S. 875n Ram, R. 410 Ramaswami, B. 101,111 Ram/rez, O.A. 112 Ramos, EA. 482, 488 Rand and Demographic Institute 403 Raney, L., s e e Subbarao, K. 439 Ranis, G. 463,464, 489 Rao, V. 268,412, 424n Rao, V.R., s e e McLaughlin, E.W. 876 Raper, K.C. 893,914 Rasche, R.H., s e e Meyer, J. 539 Rashid, S., s e e Quibria, M.G. 311 Rask, N., s e e Lee, W. 517 Rask, N., s e e Shih, J.T. 8n Rassekh, E, s e e Mokhtari, M. 975 Rausser, G.C. 106, 222, 225,255, 780, 794n, 805, 805n, 854, 881n, 882, 963n, 1185, 1192, 1193, 1197-1199, 1201, 1203 Rausser, G.C., s e e Alexandm, C. 1201 Rausser, G.C., s e e Berck, E 963 Rausser, G.C., s e e Cargill, T.E 798 Rausser, G.C., s e e Carter, C.A. 774 Rausser, G.C., s e e Foster, W.E. 123n, 520 Rausser, G.C., s e e Goodhue, R.E. 874, 1193, 1201 Rausser, G . C . , s e e I n n e s , R. 98,123n, 265,270 Rausser, G . C . , s e e Just, R.E. 182-184, 250, 708, 8O5 Rausser, G.C., s e e Perloff, J.M. 1193 Raut, L., s e e Nerlove, M. 163 Ravallion, M. 193, 194, 976, 1000, 1001, 1002n, 1007, 1009 Ravallion, M., s e e Jalan, J. 318n Ravenstein, E.G. 462 Rawling, L., s e e Newman, J.L. 429, 443 Ray, D. 121 Ray, D., s e e Banerjee, A. 311n Ray, S.C. 33 Rayner, A.J. 545 Rayner, A.J., s e e MeCorriston, S. 276 Rayner, T., s e e Kellard, N. 1158 Razin, A., s e e Mundlak, Y. 4l, 46 Ready, R.C,, s e e Buzby, J.C. 1099, 1100 Reardon, T., s e e Sakurai, T. 138 Reca, A., see Patterson, EM. 886
Reder, M.W. 6 Redford, A. 462 Reed, A.J. 939, 965 Reed, M.R., s e e Skees, J.R. 139 Rees, R., s e e Apps, EE 398 Regev, U. 647 Regev, U., s e e Hueth, D. 648 Reinganum, J.E 1111, 1124 Reinganum, J.E, s e e Danghety, A.E 11 l 1, 1124 Reis, J.A., s e e Hilliard, J.E. 1158 Rempel, H. 492 Rempel, H., s e e House, W.J. 473,480 R6qnillart, V., s e e Lavergne, E 868, 915 Reviron, S., s e e Huault, C. 868 Reyna, S.E, s e e Downs, R.W. 294 Rhode, E, s e e Olmstead, A.L. 212, 213,233 Rhodes, J.V. 1165 Rhodes, V.J., s e e Hayenga, M.L. 874 Rhyne, E., s e e Bosworth, B. 557 Ribeiro, J.L. 602, 610 Ribero, R. 418,429 Ricardo, D. 975 Richard, J.-E, s e e Baldwin, L.H. 1161 Richard, J.-E, s e e Engle, R.E 1047n Richards, T.L 68, 882n, 963 Richardson, D.J. 994, 1007 Ricks, M., s e e Wilson, W. 804 Ridout, M.S., s e e Doyle, C.J. 601 Rieder, E, s e e Regev, U. 647 Riley, J.G., s e e Hirshleifer, J. 91, 158n Ritson, C. 1139 Rivera-Batiz, EL. 491 Rivlin, T.J. 839 Ro, K.K. 495 Robbins, ER., s e e McCarl, B.A. 637 Roberts, B., s e e Barry, EJ. 525 Roberts, J., s e e Milgrom, E 873,909 Roberts, K.D. 459 Roberts, M.J., s e e Gollop, EM. 898n Roberts, R., s e e Fox, G. 598 Roberts, T. 1091, 1120 Roberts, T., s e e Crutchfield, S.R. 1087, 1091, 1120
Robertson, A.E 309n Robinson, C. 484 Robinson, K.L., s e e Tomek, W.G. 946, 948, 959, 962, 963 Robinson, S. 464 Robinson, W.C. 464 Robison, LJ. 91,520, 539, 544, 5 5 6
1-30 Robison, L.J., s e e Barry, RJ. 517, 525,537,539, 539n, 540, 541,710, 712, 713, 1189, 1195 Robison, L.J., s e e Hanson, S.D. 533 Robison, L.J., s e e Schmid, A.A. 527 Robison, L.J., s e e Siles, M. 532 Robison, EJ. 532 Rocha, A., s e e Hertford, R. 597 Rochin, R.I., s e e Martin, EL. 502 Rockafellar, R.T. 1031 Rockin, R., s e e Martin, EL. 348n Rockwell, C.S. 765,766n, 772 Rodrigues da Cruz, E., s e e Luz Barbosa, M.K.T. 598 Roe, T.L. 390, 976 Roe, T.L., s e e Falconi, C. 1092, 1112 Roe, T.L., s e e Gopinath, M. 604, 607 Roessing, A.C. 598 Rogers, E. 229, 234 Rogers, R.T. 867, 868, 868n, 953,965 Rogers, R.T., s e e Connor, J.M. 867, 909, 910, 953 Rogers, R.T., s e e Petraglia, L.M. 879 Rogerson, W. 872 Rob, J., s e e Nelson, C.H. 549 Rolfo, J. 127, 128, 779 Roll, R. 797, 980 Romain, R., s e e Gunjal, K. 308 Romain, R., s e e Penson, J.B. 545 Romans, J.T. 501 Romer, E 336, 582n Rose, A., s e e Gertler, M. 549 Rose, E. 394, 395,423 Rose, E., s e e Deolalikar, A. 423 Rose, E 430n Roseboom, J., s e e Craig, B.J. 273,275, 367 Roseboom, J., s e e Pardey, EG. 273, 275, 575n Rosegrant, M.W. 27,366, 603,607 Rosegrant, M.W., s e e Evenson, R.E. 608 Rosegrant, M.W., s e e Roumasset, J.A. 122n Rosen, S. 166, 1038, 1041, 1092, 1105, 1107, 1113 Rosen, S., s e e Nadiri, M.I. 57 Rosen, S., s e e Willis, R. 478 Rosengren, E.S. 1164 Roserthouse~ S. 420, 420n, 421n Rosenzweig, M.R. 121,306n, 370, 371,388, 395,405,408n, 411,414, 424, 437n, 464, 466, 468, 469, 474, 486-488, 538 Rosenzweig, M.R., s e e Behrman, J.R. 395,435, 437n Rosenzweig, M.R., s e e Boulier, B.L. 419n, 437n
Author
Index
Rosenzweig, M.R., s e e Foster, A.D. 347, 356, 362, 363, 434, 435, 643,713 Rosenzweig, M.R., s e e Pitt, M. 389, 390, 395, 415,441 Ross, S.A. 544 Rothschild, M. 95, 96 Rothschild, M., s e e Hanoch, G. 43,892 Roumasset, J.A. 122n, 235 Rouse, R. 469 Roy, E, s e e Bhalla, S.S. 305n Rozelle, S. 297, 298 Rozelle, S., s e e Turner, M.A. 302n Rozelle, S., s e e Williams, J.C. 763n Ruben, R., s e e Kuyvenhoven, A. 611,612 Rubin, D.K. 369 Rubinstein, M., s e e Cox, J.C. 129n Rucker, R.R. 559, 883n Rudebusch, G.D., s e e Diebold, F.X. 187n Rugman, A.M. 1172 Rugube, L., s e e Macmillan, J. 611 Rui, X., s e e Miranda, M.J. 852, 853 Ruiz-Castillo, J., s e e Deaton, A. 412, 425 Rumbant, R.G., s e e Portes, A. 496 Runkle, D.E. 193 Runkle, D.E., s e e Keane, M.E 193 Runsten, D., s e e de Janvry, A. 217, 220 Russell, M., s e e Arrow, K.J. 1091 Russell, N.E, s e e Power, A.R 598 Russell, R.R., s e e Blackorby, C. 635n, 658,668, 725 Russell, W., s e e Hadar, J. 95 Rust, J., s e e Kapteyn, A. 159n Rustco, EW. 1161 Rutledge, D.J.S. 786, 795 Rutledge, D.J.S., s e e Gray, R.W. 808, 1152 Ruttan, V.W. 14, 577n Ruttan, V.W., s e e Hayami, Y. 20, 21,210, 273, 274, 362, 366, 367 Ruttan, V.W., s e e Kawagoe, T. 21,367 Ruud, EA., s e e McFadden, D. 196n Sabot, R.H., s e e Barnum, H.N. 480 Sadan, E. 8n, 9 Sadoulet,
E. 31On, 313
Sadoulet, E., s e e Carletto, C. 252 Sadoulet, E., s e e de Janvry, A, 278, 307, 319, 390, 391,472, 479 Sadoulet, E., s e e Gordillo, G. 315 Sadoulet, E., s e e Key, N. 292 Sadoulet, E., s e e McCarthy, N. 292 Saez, R.R., s e e Shumway, C.R. 37, 38
Author
Index
Safarian, A.E., s e e Eaton, B.C. 1172 Saha, A. 113, 118, 549, 721 Saha, A., s e e Klotz, C. 358 Sahn, D. 429 Sahn, D., s e e Gfick, R 430n Sahn, D., s e e Senauer, B. 415,437n Sahota, G.S. 7n Sain, C., s e e Martinez, J.C. 597 Sakurai, T. 138 Salant, R, s e e Jensen, H.H. 353, 370 Salant, S.W. 832n, 847 Salant, S.W., s e e Cave, J. 880 Salin, V. 708 Salmon, D. 601 Salop, S.C. 909, 1153 Samuels, W.J., s e e Medema, S.G. 1187 Samuelson, RA. 92, 391,656, 659, 687, 688n, 792, 794, 795,822, 831,833,975, 981, 1040, 1042 Sanchez, N., s e e Nugent, J. 293 Sanders, J.H. 599 Sanders, J.H., s e e Ahmed, M. 599 Sanders, J.H., s e e Lilja, N. 411,430n Sanders, R.D., s e e Cole, W.E. 466 Sandmo, A. 97, 102, 126, 824 Sanint, L.R., s e e Barry, EJ. 525,541,542 Sarap, K. 309 Sarassoro, G.E, s e e Garcia, E 805 Sargent, T.J. 175, 180, 180n Sargent, T.J., s e e Hansen, L.R 180, 181 Sarkar, B., s e e Bidinger, RD. 308 Sass, T.R. 910 Saupe, W.E., s e e Gould, B.W. 352, 353, 370 Saurman, D.S., s e e Sass, T.R. 910 Savage, L.J. 93, 185 Sawyer, J. 197 Saxena, RN., s e e Kahlon, A.S. 600 Sayre, K., s e e Smale, M. 611 Sayre, K., s e e Traxler, G. 111 Scandizzo, RL., s e e Dillon, J.L. 106, 107 Scandizzo, RL., s e e Kutcher, G.R 305,305n, 637 Scarf, H. 832, 849 Schaible, G., s e e Kim, C.S. 919 Scharfstein, D.S., s e e Froot, K.A. 123n Schechtman, E., s e e Bigman, D. 802 Schechtman, J., s e e Scheinkman, J.A. 833-835, 851,855 Scheffman, D.T. 900 Scheffman, D.T., s e e Salop, S.C. 909 Scheinkrnan, J.A. 833-835, 851,855
1-31 Scheinkman, J.A., s e e Benveniste, L. 834 Scherer, EM. 910 Schiff, M. 294, 471 Schmalensee, R. 189, 906n, 910 Schmalensee, R., s e e Arrow, K.J. 1091 Schmalensee, R., s e e Ashley, R. 1000 Schmelzer, J.R., s e e Marion, B.W. 867 Schmid, A.A. 527 Schmidt, R., s e e Laderman, E. 556 Schmidt, S.S., s e e Fried, H.O. 637n, 655 Schmiesing, B.H. 556 Schmiesing, B.H., s e e Blank, S.C. 1151 Schmitz, A. 220, 274, 597, 1149, 1154, 1157, 1166, 1168, 1169, 1169n, 1170 Schmitz, A., s e e Bredahl, M.E. 1170, 1171 Schmitz, A., s e e Carter, C.A. 774, 884 Schmitz, A., s e e Feder, G. 124, 177, 781, 1150, 1151 Schmitz, A., s e e Hall, L. 905, 905n, 1156 Schmitz, A., s e e Just, R.E. 885n, 1119 Schmitz, A., s e e Leuthold, R.M. 1146 Schmitz, A., s e e Moss, C.B. 1172 Schmitz, A., s e e Shalit, H. 558 Schmitz, A., s e e Tumovsky, S.J. 826 Schmitz, A., s e e Ulrich, A. 598, 601,607, 610 Schmitz, A., s e e van Kooten, G.C. 1151 Schmitz, A., s e e Vercammen, J. 1203 Schmitz, T. 1154 Schmitz, T., s e e Brooks, H. 1154, 1169 Schmitz, T., s e e Schmitz, A. 1149, 1154, 1169, 1169n Schnake, L.D., s e e Brorsen, B.W. 961,962, 1149 Schneider, R., s e e Alston, LJ. 297 Schnitkey, G.D. 534, 538 Schnitkey, G.D., s e e Miranda, M.J. 159n, 160n Schnitkey, G.D., s e e Novak, E 538 Schoeni, R.E, s e e Lain, D. 428 Schori-Bachrach, N., s e e Kislev, Y. 245 Schrader, L. 866 Schroeder, T.C. 787, 875 Schroeder, T.C., s e e Goodwin, B.K. 1007, 1010 Schroeder, T.C., s e e Hayenga, M.L. 868n, 974, 1156 Schroeder, T.C., s e e Kastens, T.L. 1145n, 1147 Schroeder, T.C., s e e Ward, C.E. 875, 1156, 1157 Schroeter, J.R. 895, 896, 903, 954, 955,961,962 Schroeter, J.R., s e e Azzam, A.M. 917, 963, 965 Schuermann, T., s e e Nerlove, M. 196 Schuh, G.E.:480, 481 Schuh, G.E., s e e Ayer, H.W. 597
1-32 Schultz, T.P. 372, 373, 386, 388, 394, 395n, 397, 399, 401,403-405,407, 409, 410, 413, 415-417, 419, 420, 422, 423,423n, 424n, 426-429, 429n, 430n, 434-436, 437n, 438-440, 473,480, 482, 488, 714, 1194 Schultz, T.E, s e e Fields, G. 430 Schultz, T.P., s e e Mwabu, G. 429 Schultz, T.E, s e e Nerlove, M. 418,419n Schultz, T.E, s e e Rosenzweig, M.R. 388, 395, 414, 424, 437n Schultz, T.W. 12, 12n, 13, 44, 184, 191,192, 196, 209, 273,277, 335, 337, 346, 365, 432, 464, 481 Schultz, T.W., s e e Ram, R. 410 Schwab, R.M., s e e Malik, A. 301 Schwart, R., s e e Saha, A. 549 Schwartz, L. 598,611 Schwartz, L., s e e Stems, J.A. 611 Schwartz, N.L., s e e Kamien, M.I. 60 Schwert, G.W., s e e Pagan, A.R. 117 Scobie, G.M. 594, 597, 601 Scobie, G.M., s e e St. Pierre, N.R. 1150 Scotchmer, S., s e e Rausser, G.C. 255 Scott, A.D., s e e Grubel, H.B. 490 Scott, M.E 321n Seale Jr., A.D., s e e Tramel, T.E. 983 Seale, W., s e e Kenyon, D.E. 804 Seavy, D. 391,441 Seck, EA. 599 Seckler, D., s e e Schmitz, Ai 220, 274, 597 Seidi, S. 599 Seldon, B.J. 601 Sen, A.K. 312, 414, 415,424 Senauer, B. 415, 437n Senauer, B., s e e Kinsey, J. 1163 Sengupta, J.I. 115 Sengupta, K. 307n Seo, J.K., s e e Ro, K.K. 495 Sere, C. 611 Seskin, E.E, s e e Landefeld, J.S. 1098 Setboonsarng, S. 593, 594, 602 Sethuraman, R., s e e Raju, J.S. 875n Sexton, R.J. 276, 871,876, 878, 896, 904n, 1011, 1012, 1012n, 1014, 1117, 1142, 1154, 1155, 1162, 1198 Sexton, R.J., s e e Alston, J.M. 226, 880, 919 Sexton, R.J., s e e Chalfant, J.A. 873 Sexton, R.J., s e e Durham, C.A. 868n, 900, 904, 1154 Sexton, R.J., s e e Huang, S.-Y. 276, 896, 904, 919
Author
Index
Sexton, R.J., s e e Innes, R. 877n Sexton, R.J., s e e Rogers, R.T. 868, 953,965 Sexton, R.J., s e e Wann, J.J. 226, 896, 897, 904, 905,955 Sexton, T.A., s e e Sexton, R.J. 876, 878 Sfeir, R.E., s e e Sengupta, J.I. 115 Shaban, R.A. 312 Shachmurove, Y., s e e Kocagil, A.E. 800, 808 Shalit, H. 558 Shalit, H., s e e Golan, A. 1150 Shalit, H., s e e Melnick, R. 894, 904 Shalit, H., s e e Turnovsky, S.J. 826 Shane, M., s e e Roe, T.L. 976 Sharpe, S.A. 528 Sharpe, W.F. 120 Shavell, S. 1101, 1111 Shearer, E., s e e Strasma, J. 316 Sheffrin, S.M., s e e Goodwin, T.H. 181, 182 Sheldon, I.M. 1159, 1162 Sheldon, I.M., s e e Deodhar, S.Y. 891 Sheldon, I.M., s e e McCorriston, S. 875,920 Shell, K., s e e Fisher, F.M. 1042 Shepard, L. 529, 881n, 882 Shephard, R. 1038 Shepherd, G.S. 950 Sherrick, B.J. 531,805 Sherrick, B.J., s e e Barry, EJ. 556 Sherrick, B.J., s e e Miller, L.H. 529, 530 Sherwin, R.A., s e e Stigler, G.J. 974 Shetty, S. 311 Shi, H., s e e Lenz, J.E. 1150 Shi, H., s e e Wahl, T.I. 1150 Shih, J.T. 8n Shiha, A. 278 Shin, S.Y. 1100 Shogren, J.E, s e e Fox, J.A. 1099, 1100 Shogren, J.E, s e e Shin, S.Y. 1100 Shonkwiler, J.S., s e e Moss, C.B. 112 Shuford, E. 186n Shumway, C.R. 21n, 30n, 31n, 37, 37n, 38, 42, 362, 633,640, 652, 653, 657, 660, 661,669, 671n, 674, 690, 693, 696, 697, 700, 723 Shumway, C.R., s e e Fawson, C. 43, 44 Shumway, C.R., s e e Howard, W.H. 65, 66, 66n Shumway, C.R., s e e Love, H.A. 892, 959 Shumway, C.R., s e e Raper, K.C. 914 Shumway, C.R., s e e Saha, A. 113, 118, 721 Siamwalla, A. 299 Sidib4, M., s e e Fisher, M.G. 611,612 Sidib6, M., s e e Seck, EA. 599 Siegel, D., s e e McDonald, R. 243
Author
Index
Siegel, D., s e e Morrison, C.J. 649 Siegel, M., s e e Evenson, R.E. 433 Siegel, S. 185 Siegfried, JJ. 911n Sierra, R., s e e Southgate, E. 300 Sigurdson, D. 135 Silber, W., s e e Garbade, K.D. 787, 999 Siles, M. 532 Siles, M., s e e Hanson, S.D. 533 Siles, M., s e e Robison, RJ. 532 Simioni, M., s e e Lavergne, R 868, 915 Simon, H.A. 197 Simon, J.L. 497 Simon, L., s e e Goodhue, R.E. 874, 1201 Simon, L., s e e Rausser, G.C. 255 Simone, M., s e e Ackerman, K. 883 Sims, C.A., s e e Sargent, T.J. 180n Sin, R., s e e Sigurdson, D. 135 Singer, H.W. 819, 825 Singh, H.K.M., s e e Oberal, A.S. 485,496 Singh, I. 269, 338, 344, 385, 390, 431,441,471, 479 Singh, R.R, s e e Smale, M. 611 Sinn, H.-W. 96n Sipahimalani, V. 437n Sjaastad, E. 296 Sjaastad, L. 427, 467, 487 Skees, J.R. 139 Skees, J.R., s e e Buzby, J.C. 1099, 1100 Skees, J.R., s e e Luo, H. 140 Skoufias, E. 309, 312, 390, 408 Skoufias, E., s e e Jacoby, H. 411 Skully, D. 883, 1090 Slade, M.E., s e e Jacquemin, A. 879 Slade, R., s e e Feder, G. 582n, 592, 594 Slaughter, M.J. 975 Smale, M. 121,599, 611,710, 721 Smallwood, D.M. 1092 Smeeding, T., s e e Palmer, J.L. 422, 423 Smidt, S. 765 Smith, B. 601 Smith, C. 521 Smith, D.E 419 Smith, J.D., s e e Dutt, H.R. 1158 Smith, K., s e e Salin, V. 708 Smith, L.C. 405n, 430n, 433 Smith, M.J., s e e Olempska-Beer, Z.S. 1087 Smith, R. 1156 Smith, V. 188 Smith, V., s e e Thirtle, C. 604 Smith, V.E. 6
1-33 Smith, V.H. 138, 140 Smith, V.K. 1091, 1092 Smith, V.K., s e e Arrow, K.J. 1091 Soedjana, T.D., s e e Nerlove, M. 160, 162 Soligo, R., s e e Berry, RA. 491,501 Solow, R.M. 14 Solow, R.M., s e e Arrow, K.J. 23 Somwaru, A., s e e Ball, V.E. 26, 26n, 39, 209n, 272, 273, 365,661 Song, E, s e e Chatrath, A. 772 Song, J.H., s e e Durham, C.A. 868n, 1154 Sonka, S.T. 525 Sonka, S.T., s e e Barry, P.J. 520 Sonka, S.T., s e e Garcia, R. 268 Sonka, S.T., s e e Gustafson, C. 547 Sonka, S.T., s e e Streeter, D.H. 1163 Sorensen, R., s e e Pagoulatos, E. 909, 911,917 Sosnick, S. 866 Soule, M.J. 356 Southgate, E. 300 Spayd, S., s e e Folwell, R.J. 1150 Spiller, P.T. 974, 1011, 1012n Spiller, P.T., s e e Bresnaharl, T.E 792, 843 Spiller, ET., s e e Scheffman, D.T. 900 Spiunewyn, E 1068 Splett, N.S. 529 Splett, N.S., s e e Ellinger, P.N. 529 Sporleder, T.L. 1160 Spurr, G. 429 Squire, L. 465 Squire, L., s e e Barnum, H.N. 385, 390, 441,471 Squire, L., s e e Singh, I. 269, 338, 344, 385, 390, 431,441,471,479 Srinivasan, T.N., s e e Bhagwati, J.N. 501 St. Pierre, N.R. 1150 Staatz, LM. 877 Stael yon Holstein, C.-A. 194 Stahl, C. 495 Stam, J. 558 Stamoulis, K.G., s e e Rausser, G.C. 1192 Stanley, J.C., s e e Campbell, D. 200 Stanton, J., s e e Quiggin, J. 140 Starbird, S.A. 1187 Stark, O. 468-470, 474, 477, 478, 485,486, 488, 496, 497, 501 Stark, O., s e e Lucas, R.E.B. 411,476, 478, 486, 492 Stark, O., s e e Rosenzweig, M.R. 411,474, 486 Stavins, R.N., s e e Arrow, K.J. 1091 Steahr, T.E. 1086, 1115, 1121 Steckel, R.H. 429
1-34 Stefanou, S.E., s e e Chang, C.C. 56, 66 Stefanou, S.E., s e e Fernandez-Cornejo, J. 271, 272 Stefanou, S.E., s e e Lansink, A.O. 56, 67 Stefanou, S.E., s e e Luh, Y.H. 65, 67, 68 Stein, J.C., s e e Froot, K.A. 123n Stein, J.L. 770, 777, 802, 853 Steirman, A., s e e Mines, R. 459, 498 Sterns, J.A. 594, 611,612 Sterns, J.A., s e e Schwartz, L. 598 Stewart, B. 765 Stiegert, K.W. 907, 956n Stigler, G.J. 906, 918, 974 Stiglitz, J.E. 305, 520-522, 547, 1109, 1112, 1117, 1189 Stiglitz, J.E., s e e Hoff, K. 246, 530 Stiglitz, J.E., s e e Newbery, D.M.G. 89, 98, 113, 127, 128, 265,270, 310n, 826, 829, 831,837n Stiglitz, J.E., s e e Rothschild, M. 95, 96 Stock, J.H. 183n Stock, J.H., s e e Calomiris, C.W. 548 Stoker, T.M. 1096 Stokey, N.L. 164, 165n Stoll, H.R., s e e Protopapadakis, A.A. 975 Stone, R., s e e Haygreen, J. 598 Stoneman, R 246 Storey, G.G., s e e Gillespie, J.M. 875 Storey, G.G., s e e Schmitz, A. 1154, 1169, 1169n Stover, R. 529 Strak, J. 868 Strasma, J. 316 Stranbhaar, T. 483 Strauss, J. 357, 390, 392, 394, 396, 409, 410, 415,427, 429, 430, 437n, 472, 1123 Strauss, J., s e e Singh, I. 269, 338, 344, 385,390, 431,441,471,479 Strauss, J., s e e Thomas, D. 415, 427, 437n Strauss, J.K., s e e Brunner, A.D. 598 Streeter, D.H. 804, 1163 Strotz, R.H. 537 Sturgess, N.H., s e e Alaouze, C.M. 884 Subbarao, K. 439 Suchanek, G., s e e Smith, V. 188 Sulak, D.B., s e e Montgomery, M.R. 419 Sullivan, D., s e e Ashenfelter, O. 959 Sullivan, R., s e e Simon, J.L. 497 Sumelius, J. 601 Sumner, D.A. 270, 278, 353, 370, 797, 893n, 938, 956 Sumner, D.A., s e e Rucker, R.R. 883n Sumodiningrat, G., s e e Pitt, M. 121,357
Author
Index
Sun, C-H., s e e Liu, D.J. 905 Sunder, S., s e e Plott, C. 188 Sunding, D.L. 227n, 640, 641,643,652, 709, 713, 1191 Sunding, D.L., s e e Hamilton, S.E 226, 227, 891n, 919 Sunding, D.L., s e e Zilberman, D. 244, 253, 255 Sundquist, W.B. 601 Sutton, J. 868, 909 Suzuki, N. 905,919 Suzuki, N., s e e Kawaguchi, T. 1154 Svenberg, P. 403n, 415 Swamy, A.V., s e e Kranton, R.E. 308 Swanson, C., s e e Schmiesing, B.H. 556 Swenson, C. 191,196, 200 Swinand, G., s e e Ball, V.E. 661,668, 672 Syed, S.H., s e e King, E.M. 419, 435, 437n Takayama, T. 981, 1153, 1154 Takayama, T., s e e Judge, G.G. 1187 Talpaz, H., s e e Saha, A. 113, 118, 721 Talpaz, H., s e e Shumway, C.R. 21n Tang, A. 600 Tanner, J.M., s e e Falkner, E 429 Tanner, J.M., s e e Waterlow, J.C. 429 Tansel, A. 437n Tansel, A., s e e Schnltz, T.R 427 Tasanasanta, D., s e e Mittelhammer, R.C. 8n Tanbman, E, s e e Behrman, J.R. 393 Taner, L.W. 43, 120, 539 Taner, L.W., s e e Weersink, A.J. 547, 548 Taussig, EW. 798 Tawarangkoon, W., s e e Pruitt, S.W. 798 Taylor, A.M., s e e Obstfeld, M. 1012 Taylor, C.R. 112 Taylor, C.R., s e e Schnitkey, G.D. 534, 538 Taylor, C.R., s e e Tronstad, R. 1150 Taylor, G.S. 759 Taylor, J.B. 838 Taylor, J.B., s e e Fair, R.C. 181 Taylor, J.E. 350, 351,474, 476-479, 483-488, 492-499, 502, 1188, 1195 Taylor, J.E., s e e Adelman, I. 464, 494, 495 Taylor, J.E., s e e Martin, EL. 348n, 493,498, 499, 502 Taylor, J.E., s e e Massey, D.S. 482, 485, 488 Taylor, J.E., s e e Stark, O. 470, 478, 485,486, 488,496, 497 Taylor, L.J., s e e Bean, ED. 497 Taylor, T.G. 65, 881n, 904 Tcha, M. 476, 487
Author
Index
Teague, J.L., s e e Anderson, D.W. 911 Teague, M.L. 120 Teas, R., s e e Stover, R. 529 Tegene, A., s e e Soule, M.J. 356 Teisl, M.E, s e e Bockstael, N.E. 1122 Teixeira, S., s e e Strauss, J. 357 Telser, L.G. 754, 771 Tennbakk, B. 877n Texas A&M Agricultural Market Research Center 903 Texas Agricultural Market Research Center 1156 Theil, H. 162, 941 Theroux, R.R, s e e Belzer, R.B. 1097 Thierfelder, K.E., s e e Robinson, S. 464 Thiesenhusen, W.C., s e e Dorner, R 319n Thijssen, G. 68 Thille, H. 1153 Thilmany, D. 502 Thilmany, D., s e e Taylor, J.E. 502 Thirtle, C. 601,604 ThiNe, C., s e e Khatri, Y. 604 Thirtle, C., s e e Townsend, R. 604 Thomala, M., s e e Kanbur, R. 418 Thomas, D. 392, 397n, 400, 403, 404, 409, 415, 427, 437n Thomas, D., s e e Deaton, A. 412, 425 Thomas, D., s e e Strauss, J. 357, 392, 409, 427, 429, 430, 437n Thomas, J.R; s e e Ligon, E. 850 Thomas, K.. 539 Thompson, G.D. 881,963 Thompson, G.D., s e e Lyon, C.C. 963, 964 Thompson, G.D., s e e Wilson, RN. 293 Thompson, R.L. 981 Thompson, S., s e e Canoles, W.B. 765 Thompson, S., s e e Eales, J. 182 Thompson, S.R. 763,768 Thompson, S.R., s e e Bond, G.E. 778n Thompson, S.R., s e e Myers, RJ. 779 Thomsen, EL. 950 Thomsen, M.R., s e e Bailey, D. 1154 Thor, E., s e e Peoples, K. 559 Thraen, C.S., s e e Irwin, S.H. 196 Thraen, C.S., s e e Makki, S.S. 604 Thurman, W.N., s e e Knoeber, C.R. 874, 1165, 1166, 1201 Thurman, W.N., s e e Rucker, R.R. 883n Thurow, A.P. 243 Thurow, A.P., s e e Salin, V. 708 Thursby, J.C., s e e Thursby, M. 884, 885 Thursby, M. 884, 885
1-35 Thursby, M., s e e Krishna, K. 885, 1167 Timmer, C.R 826, 1000, 1002, 1011 Tintner, G. 5, 6, 6n, 8n Tirole, J. 906n Tirole, J., s e e Fudenberg, D. 906n Tobin, J. 95 Todaro, M.R 464467, 470, 476, 480, 483,500, 501 Todaro, M.R, s e e Harris, J.R. 466 ToNe, J.G. 352, 353,440 Tolley, G.S., s e e Berger, M.C. 1097 Tolley, H.D. 110 Tomek, W.G. 177, 182, 184, 794, 801,946, 948, 959, 962, 963, 1005, 1145, 1147 Tomek, W.G., s e e Emerson, RM. 759 Tomek, W.G., s e e Kahl, K.H. 801n Tomek, W.G., s e e Leuthold, R.M. 1152 Tomek, W.G., s e e Myers, R.J. 1005 Tomek, W.G., s e e Streeter, D.H. 804 Tomes, N., s e e Becker, G.S. 388, 392 Tomes, N., s e e Robinson, C. 484 Topel, R.H., s e e LaLonde, R. 497 Topel, R.H., s e e Slaughter, M.J. 975 Torok, S.J. 483 Torrey, B.B., s e e Palmer, J.L. 422, 423 Townsend, R. 604 Townsend, R.M. 293,405, 846 Tozanli, S., s e e Oustapassidis, K. 868 Traill, B. 115, 549, 1160 Tramel, T.E. 983 Traore, S., s e e Hemy de Frahan, B. 611 Traxler, G. 111,604 Traxler, G., s e e Byerlee, D. 611 Tre, J.-R 611,612 Treadway, A.B. 51,158n Triffin, A.L. 917 Tronstad, R. 182, 1150 Trovato, E 424 Trujillo, G., s e e Hertford, R. 597 Tsoulouhas, T. 1165, 1200 Tubagus, A.C., s e e Evenson, R.E. 603 Turner, M.A. 302n Turner, S.C. 1161 Turnovsky, S.J. 193,759, 826 Tttrnovsky, S.J., s e e Flemming, J.M. 823 Turnovsky, S.J., s e e Pyle, D.H. 120 Turvey, C.G. 106, 141,528-530 Tversky, A., s e e Kahneman, D. 108, 709 Tweeten, L.G. 8n, 549 Tweeten, L.G., s e e Braha, H. 601 Tweeten, L.G., s e e Heady, E.O. 62, 544
1-36 Tweeten, L.G., s e e Knutson, M. 600 Tweeten, L.G., s e e Makki, S.S. 604, 839 Tyrchniewicz, E.W., s e e Kraft, D.E 886, 1149, 1169
Uchtmanu, D.L., s e e Looney, J. 539 Udry, C. 121,306, 313, 389, 400, 401,405, 405n, 406 Uhl, J.N., s e e Kohls, R.L. 1139, 1160n Uhlig, H., s e e Taylor, J.B. 838 Ulen, T.S., s e e Kolstad, C.D. 1111 Ullah, A., s e e Batra, R.N. 103 Ulrich, A. 598, 601,607, 610 Ulrich, A., s e e Schmitz, A. 1169 Ulveling, E.E 8n Ulveling, E.E, s e e Brannen, ER 802n Umbeck, J. 300n United Nations 423-425 United Nations Conference on Trade and Development (UNCTAD) 820 United States Bureau of the Census 209 United States Commission on Immigration Reform 488 United States Department of Agriculture (USDA) 135, 880, 903,918, 953, 1156, 1157, 1185 United States General Accounting Office (USGAO) 133n, 883 United States Senate 666n Unnevehr, L.J. 598, 1091, 1114 Unnevehr, L.J., s e e Jensen, H.H. 1126 Unnevehr, L.J., s e e Yumkella, K.K. 886 Unni, J. 395 Unterschultz, J. 1152 Urban, T. 1160, 1193 Urrutia, J.L., s e e Malliaris, A.G. 1152, 1158 Uzawa, H. 1038 Valdes, A., s e e Schiff, M. 294 Valdivia, C. 611 Van der Gaag, J. 430n van der Laan, L., s e e Arhin, K. 883, 884 Van Duren, E. 1160 Van Keulen, H., s e e de Koning, G.HJ. 710 van Kooten, G.C. 1151 ,/'an Kooten, G.C., s e e Vercammen, J. 141 van Ravenswaay, E.O. 1092, 1099 van Zyl, J., s e e Khatri, Y. 604 van Zyl, J., s e e Townsend, R. 604 Vandeputte, J.M. 525 Vanker, R.D. 637n, 655n
Author
Index
Vanzetti, D. 1153 Varian, H.R. 43, 44, 655n, 892 Vasavada, U. 64, 65, 65n, 278, 549, 649 Vasavada, U., s e e Chambers, R.G. 707 Veloso, R.EV., s e e Avila, A.ED. 610 Venkatesh, RC., s e e Locke, RR. 768 Verbmgge, L.M. 423 Vercammen, J. 141, 1154, 1203 Vercammen, J., s e e Hyde, C.E. 138 Verleger, EK. 853 Viaene, J. 868 Vickner, S.S. 901 Vijverberg, W.RM. 430 Vijverberg, W.EM., s e e Deolalikar, A. 391 Vijverberg, W.RM., s e e Van der Gaag, J. 430n Vila, J.L., s e e Allaz, B. 1153 Viner, J. 706 Visaria, RM. 414, 424 Viscusi, W.K. 1098 Viscusi, W.K., s e e Magat, W.A. 1090 Vlachvei, A. 910 Vo, T.T., s e e Capalbo, S.M. 26, 31n Vogel, S., s e e Adelman, I. 494, 495 Volcani, Z., s e e Mundlak, Y. 34n Vollmers, A.C. 868 Von Braun, J. 433 von Neumann, J. 93n Von Pischke, J.D. 558 Vou Pisct~ke, J.D., s e e Adams, D.W. 558 von Witzke, H. 1087, 1112 Vroman, W. 497 Vukina, T. 129n Vukina, T., s e e Tsoulouhas, T. 1165, 1200 Vuong, Q., s e e Gasmi, E 901,913 Wachter, K., s e e Floud, R. 409, 429 Wachter, M.L. 528 Wachter, M.L., s e e Pollak, R.A. 1032, 1033, 1040 Wadycki, WJ., s e e Levy, M.E. 480 Wagner, J.J., s e e Feuz, D.M. 1149 Wahl, T.I. 1150 Wahlbin, C., s e e Lehvall, R 231 Wahlby, O., s e e Nordin, J.A. 1202 Walburger, A.M. 1159 Waldman, D.M., s e e Gertler, R 1108 Waldorf, W.H. 946, 953n, 965 Waldron, I. 423 Wales, T.J., s e e Diewert, W.E. 637n Wales, T.J., s e e Lundberg, S. 397, 400, 410 Wales, T.J., s e e Pollak, R.A. 1041, 1042
Author
1-37
Index
Walker, T.S., s e e Bidinger, ED. 308 Wallace, H.A. 194 Wallace, N., s e e Sargent, T.J. 175 Waller, M.L., s e e Thompson, S.R. 768 Wallis, K.E 181 Walls, W.D., s e e Rustco, EW. 1161 Walraven, N.A., s e e Rausser, G.C. 794n Walsh, B.M. 483 Waiters, A.A. 8n Wamulume, M., s e e Deininger, K. 294n Wang, G.H., s e e Dutt, H.R. 1158 Wann, J.J. 226, 896, 897, 904, 905, 955 Ward, C.E. 875, 903, 1156, 1157 Ward, R.W. 779, 959, 960 Warner, J., s e e Smith, C. 521 Waterlow, J.C. 429 Waterson, M., s e e Cowling, K. 866n, 936 Watson, A.S., s e e Alaouze, C.M. 884 Watson, M.W., s e e Stock, J.H. 183n Watts, D.G., s e e Leuthold, R.M. 1146 Waugh, EV. 821,846, 939, 943,948-950 Waugh, EV., s e e Nerlove, M. 1203 Weaver, R.D. 37, 362, 669, 697, 700, 1092 Webb, E, s e e Von Braun, L 433 Weed, J.A., s e e Preston, S. 421,423,424 Weed, J.B., s e e Hardy, W. 529 Weeks, M., s e e Nerlove, M. 196 Weerahewa, J., s e e Chen, K. 919 Weersink, A.J. 547, 548 Weersink, A.J., s e e Turvey, C.G. 528 Wei, K.C.J., s e e Pruitt, S.W. 798 Weinschenck, G. 974 Weiss, A., s e e Stiglitz, J.E. 305, 521,522, 547, 1189 Weiss, C.R. 267, 278 Welch, E 359-361,395n, 432, 589, 601 Welch, K., s e e Barkema, A. 870, 874 Weliwita, A. 907 Wellisz, S., s e e Calvo, G.A. 305 Wendt, H., s e e Oustapassidis, K. 868 Weninger, Q., s e e Just, R.E. 112, 644, 720 Wennergren, E.B. 597 Werden, G.J. 974 Wessells, C.R. 1099 Wessells, C.R., s e e Holland, D. 1100 Westcott, EC., s e e Lamm, R.M. 960 Westgate, R.A. 598, 610 Wetmore, J.M. 1202 Whalley, J., s e e McMillan, J. 296 Wheatcroft, A.-M., s e e Salant, S.W. 832n Whinston, M.D., s e e Mas-Colell, A. 92
Whitaker, M.D., s e e Wennergren, E.B. 597 White, B.N.E, s e e Binswanger, H.R 429 White, J.E 594, 600, 601 White, M.J. 483 White, T. 638 White, T., s e e Boehlje, M.D. 536 Whitelaw, W., s e e Johnson, G.E. 492 Wiebe, K.D., s e e Carter, M.R. 299 Wiebe, K.D., s e e Soule, M.J. 356 Wijnberger, S., s e e Levy, S. 464 Wilcox, R.T., s e e Narasimhan, C. 875n Wilkinson, M., s e e Arzac, E.R. 826 Williams, A.W. 188, 196, 197, 200 Williams, A.W., s e e Dwyer, G.E 188, 190, 197 Williams, A.W., s e e Smith, V. 188 Williams, C. 1004 Williams, J.B. 825 Williams, J.C. 125, 177, 748, 763n, 780, 783, 792, 802, 837n, 838, 843,847-850, 853,988, 1197
Williams, J.C., s e e Brennan, D. 763, 851,853, 1152 Williams, J.C., s e e Peck, A.E. 764 Williams, J.C., s e e Wright, B.D. 763,771n, 825, 826, 831,835, 837, 838, 845, 849, 85l, 853, 1152 Williams, J.R. 110 Williams, J.R., s e e Coble, K.H. 138, 140 Williams, S., s e e Gunjal, K. 308 Williamson, B., s e e Wachter, M.L. 528 Williamson, J. 975 Williamson, J.G. 466 Williamson, J.G., s e e Hatton, T.J. 482 Williamson, J.G., s e e Higgins, M. 410 Williamson, O. 336 Williamson, O.E. 519, 523, 870, 1117, 1172 Willig, R., s e e Baumol, W.J. 267n, 639, 908, 1117 Willig, R., s e e Schmalensee, R. 906n Willis, R. 339, 478 Willmann, D.R., s e e Barry, EJ. 526 Wills, R.L. 878, 909 Willson, D., s e e Horvath, B. 196 Wilson, EN. 293, 556 Wilson, EN., s e e Patrick, G.E 518 Wilson, R., s e e Kreps, D.M. 873 Wilson, W. 804 Wilson, W., s e e Yang, S.R. 557 Winegarden, C.R. 497 Winkler, R., s e e Murphy, A. 186, 186n, 187, 187n
1-38 Winter, C.K., s e e Archibald, S.O. 1088 Wise, W.S. 601 Witzke, H.E, s e e Ball, V.E. 62, 545 Wohl, J., s e e van Ravenswaay, E.O. 1099 Wohlgemuth, D., s e e Huang, T.-L. 351 Wohlgenant, M.K. 913,942-948, 950, 951,958, 960-962, 964-966, 1148, 1155, 1199 Wohlgenant, M.K., s e e Goodwin, B.K. 1014 Wohlgenant, M.K., s e e Muth, M.K. 891,892, 903,913,955, 959n Wohlgenant, M.K., s e e Sumner, D.A. 938 Woldstein, A., s e e Strasma, J. 316 Wolf, S. 708, 719 Wolfe, B.L., s e e Behrman, J.R. 437n Wolfe, B.L., s e e Haveman, R. 430, 437n Wolfowitz, J., s e e Dvoretzky, A. 836n Wolfson, RJ. 8 Wolpin, K.I. 408n Wolpin, K.I., s e e Rosenzweig, M.R. 306n, 488, 538 Womack, A.W., s e e Lachaal, L. 18, 72 Wong, K.Y. 491 Wood, J.H. 527 Wood, R.O., s e e Spiller, ET. 974, 1011, 1012n Woodland, A.D., s e e O'Donnell, C.J. 98 Woodward, S. 633,648 Woolley, E 400 Wooton, I., s e e Davies, J.B. 491,492 Worden, K., s e e Vroman, W. 497 Working, E.J. 8 Working, H. 177, 182-184, 761,763,768, 769, 782, 788, 789, 789n, 806, 851,852, 1151 World Bank 347,500, 598 WorralI, T., s e e Ligon, E. 850 Wozniak, G.D. 355, 358 Wright, B.D. 134, 135, 224, 763,771n, 825, 826, 828, 829, 831,835, 837, 838, 845, 849, 851,853, 1150, 1152, 1197 Wright, B.D., s e e ArdeN, EG. 852n Wright, B.D., s e e Bobenrieth, E.S.A. 851,853, 855 Wright, B.D., s e e Brennan, D. 763, 851,853, 1152 Wright, B.D., s e e Chamley, C. 830n Wright, B.D., s e e Kletzer, K.M. 850 Wright, B.D., s e e Williams, J.C. 792, 802, 837n, 838, 843, 847-850, 853, 988 Wright, B.D., s e e Yoo, S.J. 854 Wu, C.C. 8n Wyatt, T.J., s e e Alston, J.M. 576n
Author
Index
Wyatt, T.J., s e e Taylor, J.E. 474, 479, 487,493, 497 Wyeth, J., s e e Alexander, C. 999 Yang, D.T. 364, 371,430n, 431 Yang, S.R. 557, 854, 1158 Yao, Y. 297, 298 Yap, L. 473,476, 480, 483 Yarkin, C., s e e Zilberman, D. 253 Yarnell, J., s e e Folwell, R.J. 1150 Yee, J. 604 Yi, Xu, s e e Zeng, Yi 423n Yitzhaki, S., s e e Stark, O. 470, 485,496 Yongping, Li, s e e Zeng, Yi 423n Yoo, M.S., s e e Garcia, R. 268 Yoo, S.J. 854 Yoshimaru, S., s e e Irwin, S.H. 766 Yotopoulos, RA. 7n, 8n, 32, 268 Yotopoulos, RA., s e e Lau, LJ. 8n, 32 Young, D.L. 108 Young, D.L., s e e Mittelhammer, R.C. 8n Young, D.L., s e e Patrick, G.E 518 Young, D.RT. 916 Young, R.E 519 Young, T., s e e Traill, B. 549 Youngblood, C.E., s e e Clark, J.S. 35 Youssef, N. 419, 422 Youssouf, D., s e e Henry de Frahan, B. 611 Yumkella, K.K. 886 Yun, W.-C. 762n Yfinez-Nande, A., s e e Taylor, J.E. 488 Zachariah, O.E.R. 598 Zacher, M.W., s e e Finlayson, J.A. 795 Zangwill, L., s e e Chemichovsky, D. 417 Zant, W.R. 848n Zapata, H.O., s e e Fortenbery, T.R. 1158 Zapata, H.O., s e e Kazmierczak, R.E 887 Zarnowitz, V. 190, 193, 196 Zegarra, E., s e e Carter, M.R. 307 Zeira, J., s e e Galor, O. 318n Zellner, A. 187n, 911 Zeng, Yi 415,423n Zenmer, R.E 594 Zhang, B., s e e Chalfant, J.A. 45 Zhang, M., s e e Alston, J.M. 226, 919 Zhang, M., s e e Sexton, R.J. 896 Zhao, J., s e e Heiman, A. 239 Zhu, L., s e e McMillan, J. 296 Zilberman, D. 244, 245,251n, 253,255, 257 Zilberman, D., s e e Bar-Shira, Z. 709 Zilberman, D., s e e Buschena, D.E. 709
Author
1-39
Index
Zilberman, D., s e e Zilberman, D., s e e Zilberman, D., s e e 357n, 643,713 Zilberman, D., s e e Zilberman, D., s e e Zilberman, D., s e e 250, 256n, 640, Zilberman, D., s e e Zilberman, D., s e e Zilberman, D., s e e
Caswell, M.F. 234 de Gorter, H. 220, 221 Feder, G. 121,230, 237, Heiman, A. 239 Hochman, E. 720 Just, R.E. 42, 235, 236, 246, 690, 696, 706, 710, 885n Khanna, M. 216, 216n, 253 McWilliams, B. 234 Parker, D. 239, 254, 963,
1150
Zilberman, D.,
see
Putler, D.S. 355
Zilberman, D., s e e Rausser, G.C. 1193 Zilberman, D., s e e Sunding, D.L. 640, 641,643, 652, 709, 713, 1191 Zilberman, D., s e e Wolf, S. 708, 719 Zilcha, I., s e e Benninga, S. 126, 781 Zilcha, I., s e e Eckstein, Z. 318n Zimmer, M., s e e Nakosteen, R.A. 484 Zimmerman, E 294n, 306 Zimmerman, G., s e e Laderman, E. 556 Zona, J.D., s e e Hausman, J. 900 Zulauf, C.R., s e e Coiling, EL. 193 Zusman, E 1198 Zusman, E, s e e Rausser, G.C. 222, 1203
SUBJECT INDEX
area yield insurance, 141 Arizona and California oranges and lemons, 879 arm's-length transacting, 869 Arrow-Pratt coefficient, 94 Associated Milk Producers, 878 asymmetric information, 137, 520, 547, 874 auction, 869 Australian Wheat Board (AWB), 883, 885 available technology, 16, 18, 23, 77
absolute risk aversion, 94, 119 acquisitions, 866, 903 actuals, 750, 764 adaptive expectations, 114, 115, 157, 161 adjustment costs, 161,907 adoption of technology, 209, 210, 219, 228, 229, 231,232, 234-244, 246-252, 256, 257 adverse selection, 139, 140, 520, 871,873, 874 advertising, 866, 867, 873, 878, 879, 901, 909, 910, 915,918,919 -TV, 910 advertising intensity, 866, 910 advertising-sales ratio, 909-911 agent reputation, 873 agent's "effort", 871 agent's opportunity cost, 872 agents, 871-873 agents-on-links, 981,983, 986, 987, 1001, 1008 aggregation, 636, 649, 651, 654, 655, 658-660, 666, 667, 679, 680, 684, 714, 724, 728, 963,964, 968 aggregation qualification condition, 668, 680, 682~586, 689, 697, 701,725, 728-730 agricultural development lending, 558 Agricultural Experiment Station system (SAES), 575 agricultural extension impacts, 590 agricultural household models, 337, 407, 441 agricultural insurance, 134 agricultural production, 265-267, 277, 280, 359 agricultural research, 575,918 agricultural supply, 159, 160 Allais paradox, 93 altruism, 390, 441 Amazon, 500 anthropometric indicators of health: height and weight, 409, 413, 427, 437 anthropometric status, 429 anticipatory hedge, 761 antitrust, 865, 876-878, 914, 915,918, 920 applied agricultural research, 596 arbitrage, 763,782, 784, 790 ARCH (autoregressive conditional heteroskedasticity), 115
backward induction, 105, 131 backwardation, 763, 770, 775,792, 807 banana market - German, 920 bargaining, 876, 904 - collective, 876 - cooperatives, 876 bargaining game, 884 bargaining models of the family, 400, 401,405, 410, 416, 442 barriers to entry, 909, 910 basis risk, 125,759 basis trading, 758, 789 Bayesian framework, 158 beef, 875, 890, 903 - U.S., 891,895,902, 911, 917 beef packer market power, 903 beef packers, 903 beef packing, 892, 902, 903, 907, 917 concentration, 911 beer, 868, 900, 909, 910 beer advertisements, 910 beer concentration, 910 benchmark, 896, 897, 905 benchmark market, 896 Bernoulli utility function, 93 Bertrand behavior, 865, 899, 900 best practice yield, 580 beta distribution, 111 beverages, 920 bilateral monopoly, 865, 876 biotechnology, 265, 271,274, 275 Botswana, 486 -
1-41
1-42 boxed-beef technology, 903,914 brand introduction, 910 brand name, 916 brand proliferation, 910, 911 brands, 869, 879, 900, 910, 911, 915 - cooperative, 878 - noncooperative, 878 brewery products, 867 brewing, 909 - U.S., 900 Brier score, 186 Britain, 483 broilers, 870, 874 buffer stock, 819, 831,844-846 butter - Canada, 919 buyer concentration, 868 buyer's market power, 868-870, 875,900, 918 California-Arizona citrus industry, 878 call option, 129, 752 Canada, 484 Canadian crop insurance, 135 Canadian Wheat Board (CWB), 883-886 cane sugar industry U.S., 915 capacity utilization, 875 capital market, 163 capital stock, 491 capital structure, 542 capital-using technical change, 55 Capper-Volstead Act, 876-878 captive supply anangements, 875 carrying charge, 763 cartel, 877, 879-881,907 cash market, 751 cattle, 749, 797, 802, 804, 805, 875 celery, 904 centralized trading authority, 886 certainty equivalent assumption, 166 certainty equivalents, 163 certification, 873 cheating, 879, 906, 907 chewing gum, 867 Chicago Board of Trade, 125,748, 753, 764 Chicago Mercantile Exchange, 125, 749, 767, 768 China, 459, 462, 493 cigarette industry, 893 U.S., 910 citrus, 881,882
Subject Index classical unobserved-components (UC) model, 175 clearinghouse, 751 closed loop strategy, 908 coalitions, 876 - farmer, 876 Coca-Cola Co, 901 cocoa, 883 cocoa industry Ghana, 884 Cocoa Marketing Board, 884 coconut Philippines, 885 coconut oil, 885 coconut trade, 891 coffee, 749, 755, 756, 761,764, 765, 768, 771, 789, 792, 795, 805, 884 coffee exports, 908 coffee roasting, 909 Coffee, Sugar and Cocoa Exchange, 750, 755 coffee-roasting, 898 cointegration, 974, 990, 991, 996-998, 10051010, 1015, 1018 cointegration analysis, 995 collateral, 299 collective action, 918 collective bargaining, 876 collective Pareto-efficient models of the family, 396, 415 collectives, 292 collusion, 887 collusive agreement, 906 collusive price leaders, 916 collusive price setting, 906 Colombia, 477, 480, 488 commercials, 760, 772, 777, 789 commitment problem, 881 commodity exchanges, 748,754 commodity funds, 766 commodity trading advisors, 766 communal tenure, 291 competitive benchmark product, 897 competitive conduct, 876 competitive fringe model, 885,916 competitiveness, 528 concavity, 20, 31 concentration, 865-868, 892, 903,905, 906, 909, 910, 912 - grocery/retailing, 869 concentration among brands, 911 concentration in beef packing, 903
Subject Index concentration in European food sector, 867, 868 concentration in meat packing, 875 concentration in North American food sector, 867 concentration ratios (CR4), 866-869, 903, 905, 906, 910, 911 conditional log-linear probability models, 196 conditional mean, 115 conditional variance, 115 conduct, 866, 868 confectionery, 920 conjectural elasticity, 899, 904 conjectural variation parameter, 901 identification, 890-892 conjectural variations, 866, 885, 888, 894, 895, 898,901,903, 906, 907,912, 913, 919 consolidation, 905,917 constant absolute risk aversion (CARA), 95, 109, 130 constant relative risk aversion (CRRA), 95, 109 constant returns to scale (CRT), 11,890, 893 contango, 763 contestability, 908, 909 contestable markets, 908 contracts, 869-875 - downstream contracts, 875 - exclusive, 875 - forward contracts, 875 - market-specification, 870 -production, 874, 875 production-management, 870 - resource-providing, 870 control over resources, 401,437 convenience yield, 763,820, 851 convexity, 31, 65-68 cooperation, 871 cooperative, 904 marketing, 871 purchasing, 871 cooperative bargaining, 876 cooperative brands, 878 cooperative entry, 877 cooperative market power, 878 cooperatives, 876-879, 881 - Central California Lettuce Producers Cooperative, 878 - dairy, 878 impact on market performance, 878, 879 - market power, 878 - marketing cooperative, 877 marketing cooperatives, 877, 878, 885 -
-
-
-
-
-
1-43 - membership, 877 - Sunkist, 881 - yardstick effect, 876, 879 coordination, 870 corn, 160, 191,797, 799, 802, 804, 805, 807, 886 correlation analysis, 990, 993 cost function, 29, 32, 34, 35, 41, 43, 58 cost minimization, 103 costs fixed, 889 set-up, 889 costs of information, 158 cottage cheese, 878 cotton, 160, 799, 804, 886 counterparty risk, 752 countervailing power, 903,918 coupling effect, 102 Cournot, 865, 877, 884, 885, 889, 906, 908, 912, 920 covariance, 8 covariance analysis, 73 credit, 515 credit market, 305 credit markets, 121 credit policies, 551 credit programs, 558 credit rationing, 547, 561 credit risks, 530 credit scoring, 529 crop insurance, 134, 526 cross elasticities of demand, 896 cross-conjectural elasticities, 896 cross-country studies, 20 customer relationship, 527 -
-
dairy, 875, 878, 883, 890, 905 - U.K., 919 881 dairy cooperatives, 878 - U.S., 905 dairy processors - U.S., 905 data aggregation problems, 887 data limitations, 672, 698, 713,719 data-generating process, 159 day trading, 767 deadweight loss, 871, 881,915,917 debt-to-asset ratios, 517 decreasing absolute risk aversion (DARA), 94, 106, 109, 113 deferred contract, 754 deflators, 590 -
U . S . ,
1-44 deforestation, 500 delivery lags, 977, 988, 995,998, 1013, 1014 demand for quality, 874 demand system, 901,902 demarcation, 300 Demsetz critique, 866, 912 departures from competitive pricing, 917 derivatives, 750, 757 derived demand, 937, 942-945, 952, 963, 964, 967, 969 differentiated products, 898, 902 diffusion, 229, 231,232, 234, 235,247, 249 disaster assistance, 136 discrimination/sex bias, 403,425,426, 433 discriminatory pricing, 886 displaced workers, 482 distress sales, 308 distributed lags, 23, 48, 57, 61, 76, 180, 587 divorce, 420, 421,437 dominant firm, 885 downside risk aversion, 109 downstream integration, 871 dual, 632, 651,653, 665, 669, 674, 680, 688, 689, 691,696, 700, 707, 709, 712, 724, 725 dual economy, 463 duality, 5, 8, 29, 30, 32, 38-40, 49, 51, 60, 63, 64, 68-75, 77 dynamic hedging, 132 dynamic limit pricing, 880 dynamic models, 906 dynamic models of agricultural supply, 157 dynamic optimization, 157, 547 dynamic programming, 538, 907 dynamic regression models, 995-997, 999, 1002, 1006, 1011, 1016, 1017 dynamic theory of the firm, 158 dynamics, 104, 820, 830, 854, 855 economic impact evaluations, 575 economies of scale, 304, 865, 892 economies of size, 866, 903,910, 918 education, 335, 338, 372, 373, 405, 409, 422, 424, 431,437, 440 effective competition, 865, 866 efficiency frontier, 41 effort, 871-873 eggs, 869, 890 Egyptian, 493 elasticity of expectations, 168 eliciting preferences, 106 Ellsberg paradox, 91
Subject Index endogenous dynamics, 56, 58, 59, 69, 71, 72, 76 endogenous sunk costs, 909 entrants, 909, 910 entry, 866, 877-880, 889, 900, 906, 908-911 entry barriers, 910 strategic, 909 structural, 909 entry cost, 908 entry deterrence, 880, 881, 911 entry period, 909 entry/exit, 911 environmental degradation, 500 equality, 45 equilibrium, 90 errors-in-optimization, 703 errors-in-variables, 112, 704 estate management, 538 Europe, 483 ex ante cost function, 112 ex ante studies of research and extension, 608 ex post flexibility, 105, 132 exchange for physicals, 764 exit, 900, 906, 908, 911 exit barriers, 868 exogenous dynamics, 57, 69, 76 exogenous sunk costs, 909, 911 expectational distributed lag (EDL), 180 expectations, 157, 650, 701,707, 708, 710, 718, 796, 801,808 expected normal price, 160, 16l, 168 expected utility, 92, 470, 472-474 expected utility theory, 88 expo-power utility, 113 Export Enhancement Program, 883 export subsidies, 883, 885, 887 export taxes, 885 extension and research "time shapes", 584 extension effects on productivity, 583 extension gap, 581 extension programs, 575, 577 externalities of family behavior, 434, 436 extrapolative expectations, 157 -
-
Factor Augmenting Technical Change (FATC), 46 factor demand, 5, 39, 48, 51, 63-65, 69, 76 factor shares, 7, 9, 11, 14, 15, 19, 27, 28, 33, 35, 39, 50, 74, 75 factor-augmenting technical change, 35 family bargaining models, 419, 438 family/household decision making, 389, 391,401
SubJect Index farm prices, 934, 935, 937, 939, 941,942, 950, 957, 959, 961,963, 965-967, 970 farm real estate lending, 557 farm-retail price spread, 882, 895 farmland leasing, 518 fed cattle, 903,907 Federal Crop Insurance Corporation, 134 Federal Trade Commission, 878 fertility, 385, 386, 388, 394, 410, 412, 416, 419, 423, 427, 434-436, 438, 439, 442 financial contracting, 521 financial management, 534 financial markets, 554, 555,560 financial reforms, 554 financial risk, 540 financial stress, 559 firm behavior/conduct assumption Bertrand, 901 collusion, 901 Cournot, 901 Stackelberg leadership, 901 firm growth, 534 first-mover advantage, 909 Fisher and McGowan's critique, 912 fixed costs, 888 fixed proportions, 893 fixed rent, 311 fixed set-up, 908 fixed-effects model, 886 flexible functional form, 913 floor broker, 768 food grain, 884 food manufacturing, 867 advertising, 867 - Canadian, 867 - concentration, 867 - consolidations, 867 diversification, 867 - entry barriers, 867 Finland, 915 - France, 915 - mergers, 867 - pricing, 867 - promotion, 867 food processing Canada, 890 food quality, 870 food retailing, 869, 905 forcing contract, 872 forecasting, 801,805, 807 forward contract, 124
1-45 forward market, 750, 757, 783 four-digit standard industrial classification (SIC) codes, 867 four-firm concentration ratio, 866-869, 903, 905, 906,910, 911 free cash flow, 524 "free form" estimates, 587 free ridership, 877, 880 fresh fruit, 890 fresh o1"chilled beef, 886 fresh tomatoes Israel, 904 fresh vegetables, 890 frozen beef exports, 886 fruits and vegetables, 904, 920 functional forms, 913 demand, 890 - locally flexible, 890 - marginal cost, 890 functional representation, 657, 687 Fundamental Axiom of Multi-output Production, 690, 699, 711,723 futures commission merchant, 749 futures markets, 157, 747, 750, 754, 784, 791 futures on soybean meal and oil, 183 futures-based models, 176, 181 -
-
-
-
-
-
-
-
-
-
-
game theory, 873, 906 games of incomplete information, 873 gamma distribution, 112 GARCH, 116 gender differences, 413, 415,424, 431 general equilibrium, 464, 494, 495 generalized Leontief form, 890 generalized method of moments, 109 geographic markets, 868, 896, 905,914 grades and standards, 873, 879 grading errors, 873 grain, 883 - rail transportation, 912 Granger causality, 974, 991, 995-1000, 1008, 1016, 1018 grocery manufacturing, 866 grocery retailing, 867, 869, 905, 911 concentration, 866 consolidations, 869 merger, 869 ~oundnuts, 883
hacienda, 319 Harberger triangle, 915-917 Hatch Act, 575
Subject Index
1-46 health, 415,429 health and nutrition, 404, 409 health investments, 394, 415,418 health investments and outcomes, 409, 410 hedge, natural, 127 hedge, ratio, 128, 779 hedge, rollover, 134, 788 hedge-to-arrive contract, 751 hedgers, 747 hedging, 123,760, 765,769, 771,775, 777, 781, 808 hedging and production, 132 hedging decisions, 126 height, 409, 416, 427, 428,442 height and weight, 392 Herfindahl index, 866, 886, 903, 905, 906, 911, 916, 917 heterogeneity of expectations, 160 heterogeneous technology, 16, 18, 22, 37, 38, 46, 64, 73, 77 hidden knowledge, 871 hit and run entry, 908 hog industry Canada, 875 hog prices, 191 homogeneity, 118 homogeneous product models, 887,893 horizontal concentration, 920 horizontal integration, 911 horizontal structure, 867 household composition, 385,412, 413,423,425 household income, 368 household model, 468,471,472, 474-476, 479 human capital, 338, 339, 341,346, 391,393,405, 407, 409, 426, 428, 430, 434436, 439 -
iceberg lettuce, 896 identification, 890, 892, 901 identification of conjectural variation parameter, 901 identification of residual demand, 900 identification principle, 891 immigration policy, 462, 502 imperfect competition, 884, 887, 897, 915, 917, 919, 92O - and trade policy, 920 static structural market models, 888 imperfect monitoring, 871 imperfect resource mobility, 277 imperfect testing, 870 -
implemented technology, 17, 19, 26, 28, 46, 71, 72 implicit expectations, 157, 170 implied volatility, 805 ampulse response analysis, 995, 1003 incentive compatibility constraint, 137,871,872 incidence, 826, 829, 830, 832, 842, 845 income inequality, 492, 496, 497 income risk, 872, 884 income stabilization, 884 income support programs, 885 mcomplete contracting, 522 incomplete information, 873 - games, 906 incomplete risk markets, 123 incumbents, 909, 910 independence axiom, 92 indirect tests of expectations, 178 individual rationality, 871,872 Indonesia, 500 industrial organization of agriculture - history, 865-867 industrial R&D spill-in, 607 informal finance, 530 information acquisition, 354 information asymmetry, 140, 871 innovation, 209-229, 231, 232, 234, 244, 246, 249, 254, 256, 257 institutional innovations, 292 insurance, 769, 808 insurance contract, 103 inteilectual property, 209, 210, 218, 254-256 antergenerational transfers, 393,413 internal rate of return, 595, 606 international commodity agreements, 795 mtertemporal models, 535 intrahousehold allocations, 385, 395, 400, 401, 406, 414, 417,423,441,442 invention models, 582 invention-to-invention spillovers, 577 inventions, rate of adoption of, 583 inventories, 761,763,781,789, 792 mverse carrying charge, 763 investment, 296, 543, 545, 648, 649, 653, 668, 706, 715,720 investment function, 57, 61, 62 Ireland, 483 irreversibility, 105, 544, 549 Japanese Food Agency, 886 Jensen's inequality, 94, 100
Subject Index Kenya, 476, 480, 486, 495 ketchup, 904 labor supply, 390-392, 398, 399, 401,404, 410, 418, 423, 427, 438, 440, 441 labor-saving, 25, 33 land disputes, 295 land records, 301 land reform, 318 land registration, 314 land rental market, 307, 309 land tax, 316 landlord estates, 319 latent variable models, 196 law of one price, 973, 974, 977, 982, 994, 1007, 1014 lemons, 882 California-Arizona, 882 Lerner index, 885, 888, 897 leveraged buyouts supermarket, 911 Lewis model, 463,464, 467, 490 licenses, 873 life cycle, 536, 538 limit pricing, 877 limited liability, 122 liquidity, 516 livestock prices, 183 loan pricing, 521 lobbying, 915 log scoring rule, 187 loss ratios, 134 lottery, 92 Lucas critique, 882 -
-
Malaysia, 500 malt beverage, 910 management, 6, 9 margin call, 752 market allocation decisions, 882 market basket, 867 market behavior, 865, 876, 889 market conduct, 889, 893 market definition, 973 market efficiency, 973, 979, 980, 1006, 1011, 1013, 1016 market for lemons, 873 market imperfections, 465, 470, 472, 475, 487, 490, 494, 501,502, 870 market integration, 973, 974, 976, 978-980, 985, 990, 992-994, 996, 997, 999-1001,
1-47 1003, 1004, 1007, 1008, 1010, 1011, 1014, 1016-1018 market intermediaries, 884 market performance, 866 market power, 870, 871,876, 877, 879, 881,884886, 889, 890, 892, 898-900, 902-904, 907, 908, 912, 913, 918, 934, 936, 937, 953-959, 963,965, 967-969 - empirical analyses, 911 - grocery/retailing, 906 - packer, 875 - retail, 905 tests, 892 - welfare losses, 871,915-917 market shares, 866, 868 market s~ucture, 868 marketing boards, 874, 883-886, 919 marketing margin, 782, 783,789, 897 marketing orders, 874, 878-882, 904 - price discrimination, 881 risk-reduction role, 880 U.S. milk, 881 markup pricing, 935,950, 951,961,964, 968 marriage, 392, 398, 411-413, 422-424, 435,437 marriage/divorce, 397, 398, 400, 401,404, 410, 416, 418, 442 mean-preserving spread, 96 mean-variance approach, 127 meat packing, 903,914 meat processing, 919 meat sector - Australia, 905 median voter decision theory, 880 membership -cooperatives, 877, 878 open membership, 885 merchandising, 760, 764, 765, 788, 789 mergers, 866, 878, 900, 901,903,905 Mexico, 459, 463,467, 470, 474, 483,485, 486, 488, 493-496, 499, 500 migrant earnings, 468,475, 477, 478, 486 migrant selectivity, 467, 474, 488 migration policy, 471,501 migration/mobility, 349, 386, 411,417, 419, 421, 429 milk fluid, 878, 881,905, 919 generic milk promotion, 919 - manufacturing, 905 -marketing orders, 881 - U.S., 878, 881,882 -
-
-
-
-
-
1-48 milk board Japan, 905 milled consumption goods, 920 mineral water, 868 minimum efficient scale, 910, 911 mobility, 277, 279 money illusion, 118 money lenders, 530 monopolistic control, 865 monopoly, 870, 871, 876, 877, 879, 880, 893, 918 monopoly power, 871, 878, 881,883, 884, 892, 915,918 monopoly/monopsony, 901 monopsony, 869, 879, 884, 904, 919 monopsony power, 870, 871,875, 885-887, 893,918 Monte Carlo studies, 189, 914 moral hazard, 136, 138, 520, 871-873 mortality, 386, 394, 410, 413,414, 418, 424, 436, 438,439 mortality/morbidity, 389, 409, 416, 429 MOTAD, 120 multiple-peril crop insurance, 135 multistage budgeting framework, 900 myopic hedging rule, 131
Subject Index
-
octopus exports Mauritania, 887 off-exchange instrument, 754 off-farm work, 352 oilseeds, 884 oligopoly, 892, 895,904, 906, 907 welfare losses, 917 oligopoly behavior, 889 oligopoly models, 901 oligopoly power, 877, 889, 890, 896, 898, 903, 904, 914, 919 - food processor, 912 - food retailer, 912 welfare losses, 916 oligopoly/oligopsony, 865,894, 901,913,919 oligopsony, 891,896, 904, 906 oligopsony model, 891 oligopsony power, 890, 891,895-898, 903, 904, 907, 912, 914, 917, 919 packer, 914 open interest, 754, 761 open-outcry, 750 opportunism, 874 option valuation, 544 options, 129, 748, 752, 804 orange, 882 881,882 - fresh, 881 processing, 881 -
-
889, 886,
-
892,
435,
-
-
naive expectations, 114 Nash-bargained family allocations, 398, 401,410 navel orange - California-Arizona, 881 Nerlove supply model, 160 net present value, 543 network models, 981, 983,984 new empirical industrial organization (NEIO), 881,882, 905, 911 912-915 - critique, 912-914 new product development, 909 new product introduction, 876 noncooperative behavior, 906 noncooperative brands, 878 noncooperative games, 909 nonnested tests, 884, 901,913 nonparametric analyses, 43, 45, 74, 892, 893, 895, 913 nonparametric approach to test for market power, 892, 893 normal distribution, 112 nutrition, 394, 403,410, 413,415,417, 426, 427, 429 nutrition and health, 392, 429, 437
C
a
l
i
f
o
r
n
i
a
-
A
r
i
z
o
n
a
,
-
packers, 875, 903 partial risk aversion, 108 participation constraint, 137, 871, 872 payoff schedule, 136 peanut, 883 pear, 904 U.S., 904 Pepsico Inc, 901 perfect collusion, 899 perfect competition, 865 Philippines Coconut Authority, 885 physicals, 750, 757, 783,787 point-location model, 983-985, 987, 988, 996, 999, 1001-1003, 1006, 1008, 1015, 1016 policy uncertainty, 90 pooling equilibrium, 873 population growth, 386, 424, 434, 436, 439 pork, 890, 903 portfolio theory, 539 Posner rectangle, 915-917 post-contractual opportunism problem, 877 -
Subject Index potatoes, 802, 803, 917 poultry, 875, 890 price contingent contracts, 123 price discovery, 787, 869 price discrimination, 865, 877, 878, 881, 886, 887 marketing orders, 881 - third-degree, 870 price discrimination in trade, 886 price equalization, 974, 975, 1004, 1007 price leadership model, 916 price premiums, 912 price risk, 97, 874 price stabilization, 821-823, 825, 826, 831,844, 855, 884 price transmission, 934, 943-945, 950, 951,960, 966-968, 989, 994, 1016 price transmission ratio, 976, 978,979, 985,989 price uncertainty, 90, 130 price wars, 909 price-cost margin, 866, 879, 911,915-917 pricing - Bertrand, 907 - dynamic, 907 - limit pricing, 877, 909 - monopsony, 877 - noncooperative, 907 - trigger pricing, 907 pricing to market, 886, 887 886, 887 model, 886, 887 studies, 887 principal, 871-873 principal-agent models, 136, 871,872 principal-agent problem, 519, 524 private label, 869, 875, 911,915, 916 processed fruits and vegetables, 890 processor market power, 909 processor oligopoly, 914 producer-packer integration, 875 product development, 866 product differentiation, 865, 866, 886, 898, 899, 902, 918 product heterogeneity, 887 product introductions, 910, 911 product proliferation, 910 product quality, 873 production efficiency, 866 production possibilities frontier, 653, 661, 664, 669, 670, 681,684, 689, 696, 700, 724 production risk, multiplicative, 98, 127 -
- h y p o t h e s i s ,
-
1-49 production stages, 647, 658, 672 production uncertainty, 89, 97 productivity, 467, 468, 471,480, 491,493, 502 profit function, 29, 36, 38, 40, 42, 50 profit maximization, 659, 661, 672, 674, 682, 684, 696, 709, 715, 725 progressivity, 866 project evaluation, 599 promotion, 866 property rights, 290, 522 prospect theory, 108 public credit programs, 557 Purchasing Power Parity, 974, 978 put, 129, 752 quadratic programming, 106, 120, 983 quality, 6, 873,912 quality differences, 886 quality standards, 874 quasi-fixed inputs, 132 quasi-rational expectations (QRE), 157, 173 quotas, 880, 883,920 - production, 875 R&D expenditure, 909 raisins, 882 - California, 882 random taste parameter, 902 rational behavior, 142 rational expectations, 114, 157, 162, 1013 rational expectations and quasi-rational expectations, 172 rational expectations hypothesis (REH), 172 reactive programming, 983 ready-to-eat breakfast cereals, 900, 902, 910 real option theory, 106 red meats, 903 regulation, 553 relative deprivation, 469, 470, 474, 486, 488, 497 relative risk aversion, 94 remittances, 458, 466, 468-470, 474, 475, 477, 479, 483,486, 492-497, 502 repeated play, 873 representative economic agent, 159, 166 reputation, 873 research, 879 research and advertising, 879 research benefits, 919 research gap, 581 residual demand, 886, 899, 900 residual supply, 904 residual technical change, 25
1-50
Subject lndex
resource mobility, 267, 277, 280, 282 retail prices, 935,950, 959 retail supply, 937, 942, 944, 945, 962 retailer concentration, 905 returns to scale, 14, 15, 22, 28 revenue insurance, 141 revenue uncertainty, 103 rice, 883 high-quality, 886 rice exports, 908 risk, 89, 465, 468-474, 478, 485, 486, 491-494, 496, 501,518, 872, 874, 882, 883 risk attitudes, 113,539, 541 risk aversion, 94, 872, 874, 882 risk management, 122, 133, 747, 782 risk neutrality, 99, 872 risk premium, 770, 774, 807, 808 risk programming, 542 risk response, 115, 117 risk-adjusted interest rates, 530 risk-sharing, 137 rotation method, 891,892 rural poverty, 480-482, 499, 502 rural wages, 466, 467, 473,478,479, 489 -
safety-first, 107 sales promotion, 866 scalpers, 767 scanner data, 900 schooling, 337, 346, 372, 373, 386, 388, 392, 394, 413, 416, 426, 428, 431, 433, 435, 436, 439, 440, 467, 487, 488, 495 (see education) scoring rules, 186, 187 screening, 873, 874 seasonal workers, 502 securitization, 554 self-insurance, 122 self-protection, 122 separability of farm production and consumption, 385, 390, 441 separating equilibrium, 873 separation, 124, 132, 157, 159, 162, 165 separation of expectations and constraints in dynamic decision making, 160 separation of expectations and optimizing behavior, 197 sequential equilibrium model, 984 set-up costs, 888 sex differences, 423 sharecropping, 310
-
sharing rules, 396, 397, 401,410 shirking, 872 signaling, 521,873, 874 simulation, 535 simultaneity, 8, 28, 890, 911 single-desk seller, 883 skewness, 111 slaughter, 903 slaughter capacity, 903 social capital, 531 soft drinks, 900 soups, 868 South Africa, 474, 492 South Korea, 495 sow farrowing response, 182 soybean meal and oil, 886 soybean trade, 891 soybeans, 797, 802, 804, 805, 807, 886 spatial arbitrage, 973, 976-980, 984, 987, 1005, 1008, 1013 spatial equilibrium, 784, 884, 910 spatial market integration, 976, 978, 981, 993, 995, 1003, 1005, 1007, 1009, 1010, 1013, 1018 spatial oligopsony, 876 spatial weights, 588 speculation, 125, 752, 766, 770, 771, 781,799, 807 speculative motive, 130 speculators, 760 spill-ins, 588 spot market, 751,759, 779, 792, 869, 874, 875 spreads, 762 St. Petersburg paradox, 93 stabilization, 794 Stackelberg, 871, 887, 902 stages of production, 633, 637, 657, 662, 667, 679 state trading, 883-885 state trading enterprises (STEs), 883-887 developing country, 884 static, or stationary, expectations, 161 stochastic dominance, 95, 99 stochastic dynamic programming, 120 stochastic production function, 111 stocks, 761,763, 784, 789, 792, 803 storage, 119, 819, 820, 825, 827, 831,832, 834-846, 848-856 storage cost, 833 straddle, 129 strategic entry barriers, 909
1-51
Subject Index strike price, 130 structural change, 550 structural entry barrier, 909 structural oligopoly, 917 structural technical efficiency, 683, 690, 691, 694, 727, 732 structure-conduct-performance paradigm (SCP), 865,866, 878, 902, 905,910, 912, 915,917 - critique, 912 of the price-cost margin, 915 -paradigm, 865, 866, 901,905, 917 regression, 917 studies, 867-869 sub-technologies, 673, 678, 681, 683, 684, 689, 697, 726, 727, 729 subgame perfection, 909 subjective probability, 93 subsidy, 557 substitution, 887 substitution of processing inputs, 887 sugar, 867 refined, 869 sunk assets, 868 sunk costs, 105, 874, 908, 909 sunk investments, 874 Sunkist Growers, 878, 881 supercenters, 869, 905 supermarket, 905 Arkansas, 905 supply decisions, 114 supply elasticity, 803 supply function, 47, 50, 54, 57, 62 supply of credit, 299 supracompetitive pricing, 918 survey and semi-survey data, 191 swaps, 776 switching regime models, 974, 1008, 1011, 1012 switching regression, 907 symmetric information, 136 symmetry, 118 system of demand equations, 900 systematic production risk, 874 systemic risk, 141 -
m
o
d
e
l
s
-
-
-
-
targeted export subsidies, 885 tariff, 920 tax policies, 546 technical allocative efficiency, 681, 682, 684, 727, 729, 732 technical change, 5, 12, 14, 18, 22, 25, 26, 33, 34, 36, 37, 40, 44, 55, 903,911,913
technical efficiency, reduced-form, 681,684 technological economies, 870 technological progress, 265 technological uncertainty, 90 technology, 265, 268-275, 278, 280, 281, 411, 432 technology adoption, 121,354, 640, 712 technology infrastructure, 580 technology transfer, 253, 254, 256 television advertising, 910 tenure security, 314 tests based on "final form" VAR or VARMA models, 180 tests in a structural context, 180 Thai long grain exports, 886 Thailand, 500 threshold autoregressive (TAR) model, 1012 time allocation, 392, 394, 406, 411,427, 440 time attitudes, 536 time weights, 584 titling, 299 rifling programs, 315 tobacco, 883, 893,917 Todaro model, 465~467, 470, 471,473,486, 490, 497 tomato harvesting mechanical, 919 tomato juice, 904 tomato processing California, 890 - Taiwan, 904, 919 total factor productivity (TFP), 13, 17, 25-28 total factor productivity decomposition, 365 tournament, 874, 875 trade financing, 531 transaction cost economics, 523, 747, 782, 870, 1012 trigger pricing, 907 -
-
U.S. Agricultural Marketing Agreement Act, 879 uncertainty, 89, 632, 634, 643, 666, 668, 669, 675,676, 701,705,708, 709, 712, 718, 872 unified family model, 404, 441,442 United States, 459, 462, 473,476, 480-488,496, 497, 499, 500, 502 unobserved action, 871 urban unemployment, 464-466, 481,490, 501 usufmctuary rights, 293 variable proportions, 887, 941, 948, 962, 965, 969 variable proportions processing technology, 898
Subject Index
1-52 variation margin, 752 veal, 890 vector autoregression (VAR), 180 vector autoregressive moving average (VARMA), 180 vertical control, 869, 870, 875 vertical control and contracting, 871 vertical coordination, 869, 875, 920 vertical integration, 869-871,874, 876, 911 - incentives vertical market arrangements, 869, 874 volume controls, 880, 882 volume regulation, 882 von Neumann-Morgenstern (vNM) utility function, 93
wealth effect, 102 weather as a source of income shocks, 408, 411 welfare costs of market power, 915 welfare effects of migration, 462, 491 welfare losses, 881,916-918, 920 wheat, 761,764, 765, 769, 771, 789, 799, 802, 804, 807, 883, 884, 886 - Canada, 886 - U.S., 160 wheat trade, 891 women's land rights, 291 workable competition, 865 World Trade Organization, 883
warranties, 873 Weak Axiom of Profit Maximization (WAPM), 44, 45
yardstick effect, 876, 879 yield futures, 129 yield variability, 140
X-inefficiency, 915, 918