
- Author / Uploaded
- Tim Kashani
- Ola Ekdahl
- Kevin Beto
- Rachel Vigier
Microsoft SharePoint 2010 PerformancePoint Services Unleashed
Tim Kashani Ola Ekdahl Kevin Beto Rachel Vigier ® Microsoft SharePoint 2010 ® PerformancePoint Services UNLEASHED 800
4,316 376 19MB
Pages 345 Page size 252 x 328.68 pts Year 2010
Recommend Papers


File loading please wait...
Citation preview
Tim Kashani Ola Ekdahl Kevin Beto Rachel Vigier
®
Microsoft SharePoint 2010 ® PerformancePoint Services UNLEASHED
800 East 96th Street, Indianapolis, Indiana 46240 USA
Download at www.wowebook.com
Microsoft® SharePoint 2010 PerformancePoint® Services Unleashed Copyright © 2011 by IT Mentors, Inc. All rights reserved. No part of this book shall be reproduced, stored in a retrieval system, or transmitted by any means, electronic, mechanical, photocopying, recording, or otherwise, without written permission from the publisher. No patent liability is assumed with respect to the use of the information contained herein. Although every precaution has been taken in the preparation of this book, the publisher and author assume no responsibility for errors or omissions. Nor is any liability assumed for damages resulting from the use of the information contained herein. ISBN-13: 978-0672-33094-0 ISBN-10: 0-672-33094-6 Library of Congress Cataloging-in-Publication Data is on file Printed in the United States of America First Printing August 2010
Trademarks All terms mentioned in this book that are known to be trademarks or service marks have been appropriately capitalized. Sams Publishing cannot attest to the accuracy of this information. Use of a term in this book should not be regarded as affecting the validity of any trademark or service mark. Microsoft is a registered trademark of Microsoft Corporation.
Warning and Disclaimer Every effort has been made to make this book as complete and as accurate as possible, but no warranty or fitness is implied. The information provided is on an “as is” basis. The authors and the publisher shall have neither liability nor responsibility to any person or entity with respect to any loss or damages arising from the information contained in this book.
Bulk Sales Sams Publishing offers excellent discounts on this book when ordered in quantity for bulk purchases or special sales. For more information, please contact U.S. Corporate and Government Sales 1-800-382-3419 [email protected] For sales outside the United States, please contact International Sales [email protected]
Associate Publisher Greg Wiegand Senior Acquisitions Editor Loretta Yates Development Editor Sondra Scott Managing Editor Kristy Hart Project Editor Andrew Beaster Copy Editor Keith Cline Technical Reviewer Alexis Jarr Indexer Brad Herriman Proofreader Apostrophe Editing Services Publishing Coordinator Cindy Teeters Interior Designer Gary Adair Cover Designer Gary Adair Page Layout Gloria Schurick
Download at www.wowebook.com
Contents at a Glance Introduction .
................................................................................................................................................
1
1
Integrated Performance. ....................................................................................................................... 5
2
PerformancePoint Services 2010 . .............................................................................................. 13
3
Case Study: Managing What You Measure . ....................................................................... 19
4
Installing Microsoft SharePoint Server 2010 and Configuring PerformancePoint Services .
............................................................................................................
39
5
Introducing PerformancePoint Dashboard Designer .
6
Data Sources
...............................................
71
. .............................................................................................................................................
89
7
Using Indicators, KPIs, and Scorecards .
121
8
Reports .
165
9
Page Filters, Dashboards, and SharePoint Integration .
199
10
Securing a PerformancePoint Installation
235
11
Working with the Monitoring API .
261
12
Maintaining a PPS Deployment .
285
.
Download at www.wowebook.com
Table of Contents Introduction
1
1
Who Should Buy This Book . .............................................................................................................. 2 How This Book Is Organized . ............................................................................................................ 2 Conventions Used in This Book . ................................................................................................... 4 Text Conventions. ......................................................................................................................... 4 Special Elements . ........................................................................................................................... 4 Integrated Performance 5 Business Intelligence as a Discipline . .......................................................................................... 5 Performance Management Methodologies . ............................................................................ 9 Business Intelligence as an Enabler . ............................................................................................ 9 Integrated Business Planning. ......................................................................................................... 10 Summary . ........................................................................................................................................................ 12
2
PerformancePoint Services 2010
13
PerformancePoint Services 2010 Architecture . ................................................................. 13 What’s New? . ............................................................................................................................................... 15 What’s the Same? . .................................................................................................................................... 16 What’s Gone? . ............................................................................................................................................. 17 Summary . ........................................................................................................................................................ 17 3
Case Study: Managing What You Measure
19
Overview and Business Background. ......................................................................................... 20 Business Situation and Requirements . ..................................................................................... 21 Market Expansion . .................................................................................................................... 22 Increase Popularity . .................................................................................................................. 24 Where to Start . ........................................................................................................................................... 24 Proposed Solution Architecture Roadmap . .......................................................................... 25 Basic Project Plan . .................................................................................................................................... 26 Gather Data . .................................................................................................................................. 26 Analyze Data and Identify Measures . ........................................................................ 29 Design KPIs and Scorecards . .............................................................................................. 30 Design Reports . ............................................................................................................................. 32 Design the Dashboard . ........................................................................................................... 34 Summary . ........................................................................................................................................................ 38 Best Practices . ............................................................................................................................................... 38
Download at www.wowebook.com
v
Contents
4
Installing Microsoft SharePoint Server 2010 and Configuring PerformancePoint Services
39
Examining PPS Installation Prerequisites . ............................................................................ 39 Examining Server Hardware Prerequisites for PPS . .......................................... 40 Examining Server Software Prerequisites for PPS . ............................................ 40 Running the Preparation Tool. ......................................................................................... 42 Installing SharePoint . ........................................................................................................................... 44 Examining the Standalone Installation for SharePoint . ............................. 44 Running the Standalone Installation for SharePoint . ................................... 45 Examining the Server Farm Installation for SharePoint . ........................... 47 Running the Server Farm Installation for SharePoint . ................................. 48 Configuring PPS. ....................................................................................................................................... 53 Configuring the Secure Store Service . ........................................................................ 53 Creating the Service Application . ................................................................................. 56 Starting the PerformancePoint Service. ..................................................................... 57 Creating the PerformancePoint Service Application . .................................... 58 Set the Unattended Service Account . ........................................................................ 61 Associating the Service Application Proxy with a Proxy Group . ......... 63 Activating the Feature in the Web Application . ............................................... 64 Validating the PPS Installation . ................................................................................................... 67 Summary . ........................................................................................................................................................ 68 Best Practices . ............................................................................................................................................... 68 5
Introducing PerformancePoint Dashboard Designer
71
Understanding PerformancePoint Dashboard Designer Prerequisites . ..................................................................................................................... 72 Installing Dashboard Designer . ..................................................................................................... 73 Uninstalling Dashboard Designer . .............................................................................................. 75 Examining Dashboard Designer . .................................................................................................. 76 Examining First Class Objects . ......................................................................................... 78 Examining the Home Tab . .................................................................................................. 79 Examining the Edit Tab . ....................................................................................................... 81 Examining the Create Tab . .................................................................................................. 82 Examining Dashboard Designer Item Properties . ............................................ 83 Content Migration with Dashboard Designer . ................................................................. 84 Importing Content with Dashboard Designer . ................................................... 84 Summary . ........................................................................................................................................................ 86 Best Practices . ............................................................................................................................................... 87 6
Data Sources
89
Overview of Data Sources . ................................................................................................................ 90 Multidimensional Data Sources. ..................................................................................... 90
Download at www.wowebook.com
vi
Microsoft® SharePoint 2010 PerformancePoint® Services Unleashed
Tabular Data Sources . .............................................................................................................. 91 Data Source Security and Trusted Locations . ...................................................... 92 Analysis Services Data Source . ....................................................................................................... 92 Create a New Analysis Services Data Source . ...................................................... 92 Authentication . ........................................................................................................................... 93 Formatting Dimension and Cache Interval . ........................................................ 95 PowerPivot Data Sources . .................................................................................................................. 95 Server Requirements . .............................................................................................................. 95 Creating a New PowerPivot Data Source . ............................................................... 96 Manipulating PowerPivot Data . ..................................................................................... 96 Excel Services Data Source . .............................................................................................................. 97 Create a New Excel Services Data Source . .............................................................. 97 Import from Excel Workbook . ................................................................................................... 102 Import Data from an Existing Workbook . .......................................................... 102 SharePoint List Data Source . ......................................................................................................... 105 SQL Server Table Data Source. ..................................................................................................... 107 Time Intelligence. .................................................................................................................................. 108 Configuring Time Intelligence for an Analysis Services Data Source . ......................................................................................................... 109 Configuring a Tabular Data Source. .......................................................................... 110 STPS Syntax . ................................................................................................................................ 111 STPS Example . ........................................................................................................................... 115 Summary . .................................................................................................................................................... 118 Best Practices . ........................................................................................................................................... 119 7
Using Indicators, KPIs, and Scorecards
121
Understanding and Working with Indicators . ............................................................... 122 Examining Indicator Styles . ............................................................................................ 122 Examining Indicator Sources . ....................................................................................... 122 Creating Custom Indicators . .......................................................................................... 123 Editing a Custom Indicator . .......................................................................................... 126 Understanding and Working with KPIs . ............................................................................ 128 Creating an Analysis Services KPI . ............................................................................ 128 Understanding Multiple Targets and Actuals. ................................................... 133 Examining Data Mapping . .............................................................................................. 135 Understanding and Working with Scoring . ..................................................................... 142 Changing a Scoring Pattern . .......................................................................................... 143 Editing Thresholds . ................................................................................................................ 146 Examining How a Score Is Calculated. ................................................................... 147 Examining a Scoring Walkthrough . ........................................................................ 150 Examining Rollup Scoring . .............................................................................................. 153
Download at www.wowebook.com
Contents
vii
Understanding and Working with Scorecards . .............................................................. 154 Creating KPIs with the Scorecard Wizard . .......................................................... 154 Adding a Dimension to a Scorecard . ....................................................................... 158 Examining the Scorecard Editor . ................................................................................ 160 Designing Scorecards . ........................................................................................................... 161 Summary . .................................................................................................................................................... 163 Best Practices . ........................................................................................................................................... 163 8
Reports
165
Overview of Reports . ........................................................................................................................... 165 Examining Analytic Chart Reports. ......................................................................................... 167 Adding Data Elements . ....................................................................................................... 169 Adding Additional Measures and Dimensions . ............................................... 170 Using Measures and Dimensions as Filters . ...................................................... 172 Using Interactivity Features and Context Menus . ........................................ 173 Examining Analytic Grid Reports . .......................................................................................... 175 Using Interactivity Features and Context Menus . ........................................ 176 Examining Excel Services Reports . .......................................................................................... 176 Examining KPI Details Reports . .................................................................................................. 180 Examining ProClarity Analytics Server Page Reports . ............................................. 183 Examining Reporting Services Reports . ................................................................................ 185 Strategy Map . ........................................................................................................................................... 188 Examining Web Page Reports . ................................................................................................... 192 Examining Decomposition Tree Reports . .......................................................................... 193 Examining Show Details Reports . ............................................................................................ 194 Summary . .................................................................................................................................................... 196 Best Practices . ........................................................................................................................................... 197 9
Page Filters, Dashboards, and SharePoint Integration
199
Overview . .................................................................................................................................................... 199 Creating Filters . ...................................................................................................................................... 200 PPS Filters . .................................................................................................................................................. 200 Creating a PPS Filter in Dashboard Designer . ................................................... 201 SharePoint 2010 Filters . .................................................................................................................... 204 Creating a SharePoint Filter from SharePoint Designer . .......................... 205 Creating Dashboards . ......................................................................................................................... 207 Web Part Connections . ..................................................................................................................... 208 Source Values . ............................................................................................................................. 209 Connect To Values . ................................................................................................................ 209 Dashboards in Dashboard Designer . ..................................................................................... 210 Creating and Deploying a Dashboard . ................................................................... 210 Dashboard Zones . .................................................................................................................... 216
Download at www.wowebook.com
viii
Microsoft® SharePoint 2010 PerformancePoint® Services Unleashed
Dashboard Pages. ..................................................................................................................... 218 Working with Filters on Dashboards . ..................................................................... 220 Using the TheGreenOrange Data Source Option . ........................................ 224 Creating Dashboards in the Browser . ................................................................................... 227 Create a Dashboard Using PPS Objects . ............................................................... 228 Summary . .................................................................................................................................................... 232 Best Practices . ........................................................................................................................................... 233 10
Securing a PerformancePoint Installation
235
Security Overview. ................................................................................................................................ 235 Applying Security to PPS Elements . ....................................................................................... 236 Defining Permissions Specific to an Element . ............................................................... 239 Applying Security to Data Connections . ............................................................................ 242 Unattended Service Account. ....................................................................................................... 244 Unattended Service Account with the Username Added to the Connection String . ......................................................................................... 244 Per-User Identity . .................................................................................................................................. 245 Authentication Troubleshooting . ............................................................................................ 251 Securing a Deployment with TLS . .......................................................................................... 252 Configuring TLS on Web Applications . .............................................................................. 253 Configuring TLS on PPS Web Services . ................................................................................ 254 Secure Connections to Data Sources . ................................................................................... 255 Configuring Per-User Authentication with Kerberos . ............................................. 255 Create SPNs for the Farm and Data Sources . ................................................................... 256 Enable Constrained Delegation for Computers and Service Accounts . .................................................................................................................... 258 Configure and Start the Claims to Windows Token Service . ............................. 259 Summary . .................................................................................................................................................... 259 Best Practices . ........................................................................................................................................... 260 11
Working with the Monitoring API
261
Introduction: Extending PPS Functionality . ................................................................... 261 Installing SharePoint on a Client Operating System. ............................................... 262 Installing Prerequisites . ....................................................................................................... 263 Setting Up Your Development Environment . ............................................................... 265 Copying PPS DLLs from the GAC . ............................................................................ 265 Working with PPS Objects . ............................................................................................................ 267 Creating Indicator Example . .......................................................................................... 267 Updating Custom Properties on KPIs. ..................................................................... 268 Custom Objects and Editors . ....................................................................................................... 269 Creating a Custom Tabular Data Source . .............................................................. 269
Download at www.wowebook.com
Contents
ix
Creating a Class Library for the Custom Tabular Data Source Provider . ....................................................................................................... 270 Signing the Assembly . ......................................................................................................... 274 Custom Object Editors . .................................................................................................................... 274 Creating a Custom Editor for the File System Data Source . ................. 275 Deploying the Data Source and Editor . ................................................................. 279 Using the Custom Object . ................................................................................................ 282 Summary . .................................................................................................................................................... 284 Best Practices . ........................................................................................................................................... 284 12
Maintaining a PPS Deployment
285
Planning for High Availability . .................................................................................................. 285 Examining the Management Pack . .......................................................................... 286 Examining Network Load Balancing . ..................................................................... 286 Configuring Multiple Application Servers . ........................................................ 287 Managing PPS . ......................................................................................................................................... 288 PerformancePoint Service Settings . .......................................................................... 288 Trusted Data Source and Content Locations . ................................................... 296 Migrating from PPS 2007 . .............................................................................................................. 299 Step-by-Step Migration from PPS 2007 . ............................................................... 300 Using Windows PowerShell and Cmdlets . ........................................................................ 302 Launching PowerShell . ....................................................................................................... 302 Cmdlet Reference . .................................................................................................................. 302 Cmdlets Available Out of the Box . ............................................................................ 303 Cmdlet Samples . ..................................................................................................................... 310 Troubleshooting . .................................................................................................................................... 312 Event Viewer. .............................................................................................................................. 312 Trace Log Files . ........................................................................................................................... 313 Summary . .................................................................................................................................................... 313 Best Practices . ........................................................................................................................................... 313 Index 315
Download at www.wowebook.com
About the Authors Tim Kashani, founder and CEO of IT Mentors and author, has trained more than 100,000 students worldwide. He builds scorecards to track how many vegetables his son consumes daily. Tim thinks increasing is better. His son wants more information before making a strategic decision on the issue. Ola Ekdahl has worked with PerformancePoint since its early alpha stages, as a trainer, content creator, and author, and has extensive experience developing business intelligence solutions. He is currently developing a KPI measuring how much catnip his cats can consume. The cats think they should use increasing is better but Ola disagrees. Kevin Beto, a 10-year Microsoft veteran, is currently a test lead on the Microsoft SharePoint BI team. He builds scorecards to track his performance in arm wrestling and twister contests. The calculations and thresholds for these scorecards test the outer limits of performance monitoring and business intelligence. Rachel Vigier is a writer. She has authored two volumes of poetry, a book about dance, and many technical and business works. She uses scorecards to track how many books her family reads. Increasing is definitely better and so far everybody consistently exceeds targets.
Download at www.wowebook.com
Dedication To my loving wife, Pamela, and laughing son, Timothy, who remind me daily that some things go way beyond anything we can plan, monitor, and analyze. Tim Kashani To my mom, dad, and brothers for always supporting my crazy ideas 100 percent. I love you all. To my newly compiled nephew Sixten. I hope you’ll live well and prosper on planet earth. Ola Ekdahl This book is dedicated to my talented wife, Rachel, who has selflessly put her own writing career on hold to raise some fine children. And don’t worry, he’ll learn to write his name eventually. Kevin Beto To my family and to the creative members of the technology community worldwide who help make our work fun and full of hope. Rachel Vigier
Download at www.wowebook.com
Acknowledgments The authors want to thank the Sams Publishing editorial and production team, particularly Loretta Yates, Andrew Beaster, and Alexis Jarr, for their diligent and thoughtful work during the process of writing and producing this book. Thank you to our colleagues at IT Mentors, particularly Joshua Eklund for his work on the case study, and to the Microsoft PerformancePoint team for their work on the product itself. And finally, we want to thank each other for our technical expertise and excellent humor during the writing of this book!
Download at www.wowebook.com
We Want to Hear from You! As the reader of this book, you are our most important critic and commentator. We value your opinion and want to know what we’re doing right, what we could do better, what areas you’d like to see us publish in, and any other words of wisdom you’re willing to pass our way. As an associate publisher for Sams, I welcome your comments. You can e-mail or write me directly to let me know what you did or didn’t like about this book—as well as what we can do to make our books better. Please note that I cannot help you with technical problems related to the topic of this book. We do have a User Services group, however, where I will forward specific technical questions related to the book. When you write, please be sure to include this book’s title and author as well as your name, e-mail address, and phone number. I will carefully review your comments and share them with the author and editors who worked on the book. Email:
[email protected]
Mail:
Greg Wiegand Associate Publisher Sams Publishing 800 East 96th Street Indianapolis, IN 46240 USA
Visit our website and register this book at informit.com/register for convenient access to any updates, downloads, or errata that might be available for this book.
Download at www.wowebook.com
Foreword Nobody chooses to work in the absence of good, supporting information. Given the choice, and to improve the decisions they make every day, most business users want relevant information about their business to be easily available. Business intelligence (BI), business information, and the tools that deliver it can provide that information, but most business users do not have BI available to them, or if they do, they don’t use it. Today, roughly 20% of information workers utilize BI. This represents only about 8% of all business users. It seems clear that having the appropriate data to support decisions could lead to superior outcomes for nearly all information workers. However, for this to happen, that data needs to be provided in an intuitive, familiar, and context-sensitive way. And it needs to be provided where the user already works, not in some hidden location. Given this, why are more people not using BI today? Business users don’t currently use BI because most BI solutions are still provided by unfamiliar, specialized software that is separate from the software with which those business users normally do their work. Typically, the BI solutions provide information related to a business process that most users infrequently perform, such as budgeting, resource planning, or product planning. You have a situation where business users must use an unfamiliar product, for an unfamiliar activity performed so infrequently that they can’t remember what they learned in the previous experience. It is no wonder that only the most advanced and data-savvy users take advantage of BI. It is for this reason that we, Microsoft, believe that broadly applicable capabilities such as dashboarding and scorecarding should appear in a familiar and commonly used product. SharePoint 2010 is that product. It makes sense to see the metrics that define your team’s success right alongside the rest of your documents and other information in your team portal. SharePoint 2010 is the culmination of several evolutionary product steps for Microsoft. Each of these intermediate products had elements of broadly applicable features, but they solved only part of the problem, and they, too, were released as software that was separate from the familiar Office and SharePoint environments. Report Builder, Business Scorecard Manager, ProClarity, Data Analyzer, and even PerformancePoint Server 2007 are all examples. But now with the 2010 release of Office and SharePoint, PowerPivot is integrated into Excel, and PerformancePoint Services is integrated into SharePoint. From this point forward, BI will be a mainstream capability available to nearly all the users of Office and SharePoint.
Download at www.wowebook.com
The authors of Microsoft SharePoint 2010 PerformancePoint Services Unleashed have done an amazing job walking the reader through the capabilities of PerformancePoint Services and touching on important learning scenarios along the way. Their approach is pragmatic and straightforward, but not superficial. By the time you complete this book, you should be well prepared to embark on your own solutions. Have fun reading the book, learn a lot, and be sure to make many great dashboards available to people who have never used them before! Together we will fix this oxymoron called business intelligence! —Russ Whitney Russ Whitney is a group program manager in the Microsoft Office organization. He and his team are responsible for BI capabilities in SharePoint and Office. He has worked as a development manager and a general manager in the four years he has been with Microsoft. Previously, Russ was the SVP of Research and Development of ProClarity Corporation. Since 1997, he has pursued the goal of bringing fact-based decision making to more people in more organizations than ever before. When not at work, you can find Russ hiking, fly-fishing, and taking pictures in the mountains of Idaho.
Download at www.wowebook.com
This page intentionally left blank
Download at www.wowebook.com
Introduction
IN THIS INTRODUCTION . Who Should Buy This Book . How This Book Is Organized
2 2
. Conventions Used in This Book 4
How is a dashboard like a poem? In the immortal words of the poet Elizabeth Barrett Browning “let me count the ways.” Like a good poem, a good dashboard is elegant, brief, and to the point. In a good dashboard, every object (word) counts, and in a good dashboard you get a lot of meaningful information compressed into a small space. How does this relate to PerformancePoint Services 2010, and why should you care? If you are reading this book, you might not care about poems, but you certainly care about business intelligence. Dashboards are at the heart of business intelligence solutions, and business intelligence solutions are at the heart of business performance. To thrive, all organizations need to understand how they are performing. This is important in all organizational areas, including financials, sales, employees, and operations. With PerformancePoint Services, you can create webbased dashboards that enable you to define key metrics such as sales, revenue, and employee head count to measure performance in these and other key area. With key metrics in place, you can monitor and analyze your organization’s performance. You can see how your business is doing, understand why it’s performing the way it is, and set real goals based on real data. Our intention with this book is to help you imagine what is possible for you and your organization in terms of business intelligence solutions. We also give you the technical knowhow you need to begin implementing a business intelligence solution with PerformancePoint Services 2010. In these chapters, we try to help you understand the different aspects of business intelligence solutions, balancing an under-the-hood look at PerformancePoint Services features
Download at www.wowebook.com
2
Introduction
with sections that will have you rolling up your sleeves to do actual work. We say here that this is the kind of introduction you get when you put the four of us together. Between the four of us, we have years of experience in technology, business intelligence solutions and products, entertainment, and (you guessed it) poetry. We bring it all to bear in this book. Emily Dickinson said that a good poem should take off the top of your head. A good dashboard may not take off the top of your head or the collective head of your business users, but it should provide you and your business users with plenty of “aha” moments. Enjoy the book and use it well. Let us know what you think and what it has enabled you to do. Write to us at [email protected] with your thoughts, comments, sample dashboards, tips, and tricks. The occasional poem is welcome, too!
Who Should Buy This Book Microsoft SharePoint 2010 PerformancePoint Services Unleashed focuses on what architects, implementers, and developers need to know to successfully deploy a business intelligence solution with PerformancePoint Services. If your organization has a SharePoint license or is considering a SharePoint license, you need to read this book. If you already have a PerformancePoint 2007 installation or other business intelligence solution, you need to read this book. If your business users ask for information and reports to help predict and analyze business performance, you need to read this book. We assume that you have basic Windows Server and SharePoint skills. We also assume you are comfortable experimenting with various features and options in a new product, that you have a safe computing environment to experiment in, and that you are curious about what PerformancePoint Services can do for you and your organization.
How This Book Is Organized Microsoft SharePoint 2010 PerformancePoint Services Unleashed is organized into 12 chapters. In this even dozen, you can go from understanding the business reasons for implementing PerformancePoint Services to getting the technical information you need to start. Read the book cover to cover to step through the entire process from planning a PerformancePoint Services deployment to implementing and maintaining your first installation. Or if you are a more experienced user, just dip into the chapters that interest you the most or that can help you fill in the gaps of your own knowledge. Chapter 1, “Integrated Performance Management,” introduces business principles of performance management and discusses the value and process of planning for a business intelligence solution in your organization. Chapter 2, “PerformancePoint Services 2010,” gives you an overview of PerformancePoint Services 2010, including a summary of what’s new and different.
Download at www.wowebook.com
How This Book Is Organized
3
Chapter 3, “Case Study: Managing What You Measure,” provides a case study that enables you to follow Apples and Oranges Productions, a fictitious production company, as they work through the process of implementing a business intelligence solution with PerformancePoint Services. Chapter 4, “Installing Microsoft SharePoint Server 2010 and Configuring PerformancePoint Services,” takes you through the first step toward implementing a business intelligence solution by installing Microsoft SharePoint Server and configuring PerformancePoint Services. Chapter 5, “Introducing PerformancePoint Dashboard Designer,” covers the specifics of the Dashboard Designer, which is the design tool you use to create and deploy dashboards on SharePoint. Chapter 6, “Data Sources,” provides information on data sources, which are the foundation of any business intelligence solution. In Chapter 6, you learn about two types of data sources, multidimensional and tabular, that you can use in PerformancePoint Services. This chapter also steps through several examples that illustrate how you can apply these data sources appropriately in various scenarios. Chapter 7, “Using Indicators, KPIs, and Scorecards,” provides an overview of how to work with indicators and KPIs and how to integrate these objects into a scorecard view. This chapter is rich in examples that explain the main features of indicators, KPIs, and scorecards. It also provides in-depth information on scoring patterns, thresholds, and methods. (If you’re not sure what a scoring pattern is or a threshold, you definitely need to read this chapter.) Chapter 8, “Reports,” illustrates how you can work with the 10 different types of PerformancePoint Services reports to visualize data. The chapter explains the main features for each report type and provides examples of appropriate implementation and usage that help you translate data into information for your business users. Chapter 9, “Page Filters, Dashboards, and SharePoint Integration,” shows you different ways to create dashboards and connect filters using Dashboard Designer, SharePoint Designer, or the browser on the SharePoint page. This chapter covers each way to create dashboards and how to connect filters to dashboards, including Time Intelligence and other typical filters. Chapter 10, “Securing a PerformancePoint Installation,” focuses on security that an organization can implement to protect information stored in a PerformancePoint Services solution. This includes PerformancePoint Services element security (that is, how to configure user access to scorecards, KPIs), data sources, and other objects; and PerformancePoint Services data security (that is, how to secure data that appears on the dashboard). Chapter 11, “Working with the Monitoring API,” illustrates how to extend native PerformancePoint Services capabilities and functionality by using the Monitoring API. The focus here is on creating custom objects and creating editors or custom ASPX pages hosted inside of SharePoint.
Download at www.wowebook.com
4
Introduction
Chapter 12, “Maintaining a PPS Deployment,” covers the tools SharePoint provides for monitoring and maintaining a PerformancePoint Services deployment. This coverage includes the PerformancePoint Service settings you can apply from the Manage PerformancePoint Services page in SharePoint.
Conventions Used in This Book The following section explains the special conventions used to help you get the most from this book and from PerformancePoint Services 2010.
Text Conventions Various typefaces in this book identify terms and other special objects. These special typefaces are as follows: . Italic: New terms or phrases when initially defined . Monospace: Examples of code that you can use
Special Elements Throughout this book, you find Tips, Notes, Cautions, and Cross References. These elements provide a variety of content, ranging from information you should not miss to information that can help you set up your own PerformancePoint Services solutions.
TIPS Tips point out features and tricks of the trade that you might otherwise miss. This is not run-of-the-mill information that you learn out-of-the-box and don’t need us to tell you about.
NOTES Notes point out items that you should be aware of. Generally, we have added notes as a way to give you some extra information on a topic without weighing you down.
CAUTIONS Pay attention to Cautions! These could save you precious hours. Don’t say we didn’t warn you.
Download at www.wowebook.com
CHAPTER
1
Integrated Performance
IN THIS CHAPTER . Business Intelligence as a Discipline 5 . Performance Management Methodologies 9 . Business Intelligence as an Enabler 9
This chapter introduces business intelligence (BI) as a
. Integrated Business Planning 10
discipline and discusses how business management and performance management strategies work hand in hand in BI solutions. You learn about the different decision types that occur across all levels of an organization and how BI products have evolved to their present capacity in which they can enable business decisions across all levels of an organization.
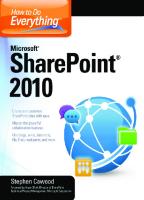
Business Intelligence as a Discipline In any organization, decisions happen daily at every level, from the person working at the front desk to the most senior executive in the corner office. And for every person in an organization, making sound and timely decisions depends on access to good and reliable information. At its best, BI exists where decisions and information converge (see Figure 1.1). The type of information needed for a decision varies depending on the decision required. The decisions themselves vary depending on who is making the decision, how much time there is to make the decision, and how much of an impact the decision may have on the organization as a whole. There are three different decision types referred to in the BI world: . Strategic . Tactical . Operational
Download at www.wowebook.com
6
CHAPTER 1
Integrated Performance
Decisions
Business Intelligence Information
FIGURE 1.1 Fundamentally, business intelligence is about decisions and information. Strategic decisions are typically made by senior management and generally impact the company as a whole. Only a few of these decisions are made during the year, and they often involve long-range planning from 1 to 3 years at the executive level. Strategic decisions might be centered on questions such as the following: . Should we start a new product line? . Should we open regional offices in Europe or the Middle East? . Should we close our plants in the Midwest? Tactical decisions are usually made more often than strategic decisions and have less of an impact on the company as a whole. They involve planning on a quarterly or semi-annual basis and might be centered on questions such as the following: . How can we adjust the budget for the Chicago office to meet projections this quarter? . Do we need to increase our sales staff for the upcoming holiday season this year? . How can we increase production in the overseas plant to meet demand next quarter? Operational decisions are made most often, and on a daily basis, by all types of employees, at all the various levels in the organization. These are like the decisions that keep the assembly plant running every shift and might be centered on questions such as the following: . Do we need to add a team to the night shift to pack the orders that need to go out tomorrow morning? . Who is available to replace Jane on her shift tonight? . Do we need to change the supplier for our store? Consider an example based on the case study of an organization called Apples and Oranges Productions detailed in Chapter 3, “Case Study: Managing What You Measure.” The executive team of Apples and Oranges Productions, a fictitious production company
Download at www.wowebook.com
Business Intelligence as a Discipline
7
with TV and film divisions, decides to grow the organization. Strategic questions might be centered on the following:
1
. How can we grow our organization? . Which division is best positioned for growth? The executive team decides to grow the organization by expanding into new markets and that compared to the Film division, the TV division is best positioned right now for this expansion. The decision to expand the TV division into new markets is an example of a decision taken at the highest level of the organization that will impact the company as a whole and will be evaluated and implemented over the long term. The executive team arrived at this decision by looking at industry performance, overall company revenue, and overall strengths and weaknesses. The decision defines a direction for Apples and Oranges for the next 2 years and will have an impact on the company as a whole as resources, financial and human, are turned toward realizing the goal of expanding the TV division into new markets. Following up on this strategic direction, the management team of the TV division looks at what they need to do to realize this strategic goal. At this level, the TV division makes tactical decisions centered on these types of questions: . Which of our shows is best positioned for expansion into new markets? . How can we increase viewership for our best shows? Looking at current viewership and advertising revenue, they decide that a show called The Green Orange that is currently in the top 10 television markets is best positioned for expansion. This is an example of a tactical decision. It is a decision taken at a lower level in the organization with the objective of enabling the strategic decisions communicated to the company. Other examples of tactical decisions at this level would be the decision to increase guest appearances on the show or to increase the presence of a particularly popular character based on viewership data. Operational decisions for The Green Orange occur on the set and are centered on these types of questions: . How do we increase viewership for The Green Orange? . What can we do to make the show as appealing as possible to our viewership? . What can we do to make the characters as appealing as possible to our viewership? The set designer makes decisions about the appropriate architecture and furnishings for the show. The costume designer makes decisions about how to dress the characters. The writers make decisions about story lines and scripts. The actors decide how to interpret their lines. These are operational decisions made by a wide variety of Apples and Oranges employees, and all are geared toward producing the best possible episodes to realize operational, tactical, and strategic goals.
Download at www.wowebook.com
8
CHAPTER 1
Integrated Performance
Information is required for each of these types of decisions. With BI, an organization can provide a continuous flow of information to business decision makers at all levels of the organization to answer questions such as the following: . What has happened? . What is happening? . Why? . What will happen? . What do we want to have happen? (From http://technet.microsoft.com/en-us/library/cc811595(office.12).aspx) BI is where information and decisions converge to provide answers to these questions. Organizations have been making business decisions from data ever since the first computer was introduced into the workplace, and in the past five years, BI products and understanding has evolved exponentially. In particular, the capacity to transform data into information has evolved. It is important to note that data and information differ in the following way: . Data equals raw numbers. . Information is repurposed data presented in a format that helps human beings make better decisions. Various products have facilitated the evolution of data into information. Let’s consider Microsoft products specifically: People have been making decisions from data since Excel was introduced to the desktop. Microsoft has offered an OLAP solution since SQL Server 7.0 and OLAP Services, which later evolved into Analysis Services with the release of SQL Server 2000. This was further enhanced by a line of BI-specific products. Again at Microsoft in particular, the Business Scorecard Manager, one of the first products in the BI line, embraced the idea of key performance indicators (KPIs) and scorecards as measures of business performance to enable better decisions. The next iteration of the product, PerformancePoint Server, extended the use of dashboards as visual decision-making support systems, and further expanded the analytic capabilities of the BI tools through the integration of ProClarity. With the most recent integration of PerformancePoint Services into SharePoint 2010, the next step in the evolution makes reliable information accessible throughout the organization in a secure, flexible, and readily available format integrated into daily activities and tools. With this more unified and familiar structure, people in organizations have the support they need to make decisions and track the impact of their decisions quickly and with ease. This does not mean that people will always make predictable decisions dictated by data. It is important to remember that people make business decisions and that this can involve impulsive and intuitive behaviors. Think of how often on a personal level you might have gone against the facts at hand. For example, every month, Sam allocates money from his paycheck to pay the bills. This month he sees that he has additional money in hand. Following the strategic plan he laid out with his accountant, he knows he should invest Download at www.wowebook.com
Business Intelligence as an Enabler
9
1
this money in his retirement account. Instead Sam decides on impulse to buy tickets for a Broadway show and enjoy a night on the town with friends. This is the human factor. As long as BI involves people making decisions, the human factor will remain as an unpredictable (and sometimes surprising and profitable) aspect of the BI discipline.
Performance Management Methodologies The BI products have matured along with the understanding by businesses of how they need a deep understanding of internal business drivers and processes. Although the products now provide a way to support the decision-making process at all levels, businesses have matured in their understanding of how business management and performance management methodologies work together to create frameworks for analyzing and understanding business performance and drivers. Starting from business management strategies such as Balanced Scorecard, Six Sigma, CMMI (Capability Maturity Model Integration), Agile Management, and CRM (Customer Relationship Management), organizations can build performance management frameworks for monitoring and analysis. As long as your organization has the supporting metrics, you can use almost any form of organizational principle and measure, including, for example, employee satisfaction, future sales, and customer satisfaction. The methodology you choose to support can provide a framework for thinking about and understanding your business and can help you maintain focus on displaying and communicating the current state of your business and its desired future state. A BI tool such as PerformancePoint Services is flexible enough to take whatever plan or methodology you choose is most appropriate and turn the analysis into tangible information that employees at all levels can use for informed decisions and actions.
Business Intelligence as an Enabler By providing information across the organization, BI enables better decisions that support organizational objectives. It also can facilitate communication that in turn can enable buy-in of organizational directives. Even though business intelligence enables better decisions, it is important to remember that BI is not a silver bullet, nor is it an exact science. Decisions are made by people, who have an amazing capacity to consume and process all kinds of data and information. A BI solution provides one part of what goes into making a decision. For example, a CFO checks her financial dashboard and sees that her company has experienced a drop of 4% in sales for this quarter. This does not necessarily mean that the best decision is to cut 4% of the staff for the coming year. Looking at her other performance measures, she sees that customer satisfaction has shot through the roof, and looking further into the overall performance of her industry, she sees that the industry as a whole lost 20% in sales. Processing all these points of information, her 4% drop in sales begins to look quite different, and she concludes that it is best to actually increase staff because she expects that sales next year will skyrocket. Download at www.wowebook.com
10
CHAPTER 1
Integrated Performance
BI also enables better communication across an organization. In another company, the CFO looks at KPIs and scorecards to measure employee productivity against revenue versus nonrevenue projects. In consultation with the Human Resources group, the company uses the scorecards to communicate to employees the necessity of moving the organization toward a more efficient operational model. Employees have access to the scorecards that track hours spent in revenue versus nonrevenue projects, and they can see the imbalance in how time is spent and the need for more effective models of work.
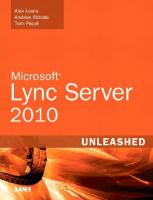
Integrated Business Planning With the maturity of the products that makes up a BI solution, organizations can create and maintain a technically integrated BI solution. With SQL Server, an organization can create a central repository for data and repurpose the data for use in PerformancePoint Services to communicate valuable business information. On the back end, SQL source systems collect and store data in normalized forms through transactional systems that provide the capacity to insert, update, and delete data. The SQL solution enables these transactional systems, and with extract and load processes provides the potential to extend the business value and potential of this data. Using extract and load processes, an organization can then transform and optimize data into cubes and prepare it for use in scorecards and dashboards. To better understand this, consider a transactional sales system that tracks and stores sales quantities and orders as they are entered (see Figure 1.2). The data elements are stored in a relational database, and the underlying architecture of the system might look something like the structure shown here.
SQL Server Reporting Services–Office/SharePoint 2010-ProClarity Transactional
Tactical
Tactical/Strategic
Source Systems
Data Warehouse Data Mart
OLAP
SQL Server Database Engine
ETL SSIS
SQL Server Database Engine
Agg BIDS
SQL Server Analysis Engine
Data mining
FIGURE 1.2 SQL Server systems collect and store data that can be transformed into valuable business information.
Download at www.wowebook.com
Integrated Business Planning
11
1
This system captures and stores valuable information that a manager may want to use when making daily or long-term decisions. The challenge is to extract the most valuable data and to transform it into a usable form for performance management—in other words, to transform the data into information. To optimize data for reporting and analysis, data elements are typically structured into measures and dimensions. Measures identify data that you want to analyze, such as sales, head count, defective products, and profit margin. Dimensions enable you to add context to one or more measures. For example, if we have a measure called Sales, and its value is $1,000, what does that mean? Is it total sales for a year, quarter, or month? Is it for all products or a specific product category? A number by itself does not mean much to most users. By adding one or more dimensions that contain information about time, products, and regions, for example, you can start to add context to the number $1,000. You can now analyze sales based on time, products, and region. A dimension can also include hierarchies that provide navigational paths. It can make it easier for the user to browse data by looking at sales for all years and then navigate to a specific year, quarter, or month. To use the data for analyses, the data elements must be converted into measures (see Figure 1.3). This is done by associating data elements with a dimension. Raw data elements are considered facts, whereas dimensions group these facts by time or geography, for example. Associating a fact with a dimension enhances its informational value. In this case, it is a fact that the sales organization sold 10,000 shoes. It is important to know that 5,000 of these shoes were sold in Quarter 4. It is also important to know that of these 5,000 shoes, 3,000 were sold in Europe. The measure that surrounds the fact communicates a dimension. In this case, Quarter is an example of the Time dimension, and Europe is an example of the Geography dimension.
KPIs display measures on Scorecard
Sales database with data elements
Dimensions transform sales data elements into measures
FIGURE 1.3 In this scenario, sales data is transformed into sales information displayed as KPIs on a Sales scorecard.
Download at www.wowebook.com
12
CHAPTER 1
Integrated Performance
Dimensions allow you to measure facts in different ways to create and communicate valuable business information. You can then use these measures in the final step in this process, which occurs in PerformancePoint Services (which is where KPIs are built on available measures and presented in scorecards and dashboards). In this example, KPIs might display sales by quarter and by region. This information is populated dynamically from the underlying transactional database reflecting at all times a current view of the organization’s sales performance.
Summary This chapter provided you with an overview of BI as a discipline, including discussion of the types of decisions and information that are part of making an organization function and thrive. You learned how BI products have matured and how businesses have also matured in their understanding of how business management and performance management methodologies can work together in a technically integrated BI solution. With this theoretical overview of BI, you should be ready to roll up your sleeves and start exploring how PPS can help you build a BI solution.
Download at www.wowebook.com
CHAPTER
2
PerformancePoint Services 2010
IN THIS CHAPTER . PerformancePoint Services 2010 Architecture 13 . What’s New?
15
. What’s the Same? . What’s Gone?
16
17
This chapter summarizes how PerformancePoint Services 2010 (PPS) integrates with SharePoint Server 2010 (SPS). The chapter identifies the new features shipped with PPS, discusses what’s the same in PPS 2010, and identifies what has been removed from PPS 2010. The goal is not to explore every detail of the PPS architecture or every new feature. Instead, this chapter provides just an overview, and directs you elsewhere in this book for more information about specific topics.
PerformancePoint Services 2010 Architecture When PerformancePoint Server 2007 was released, it was deployed as a product that integrated with Microsoft Office SharePoint Server 2007 (MOSS). PerformancePoint Server 2007 enabled you to publish dashboards to SharePoint sites, but it was not fully integrated. For example, you managed users and permissions to dashboard elements outside of SharePoint, and all definitions of key performance indicators (KPIs), reports, and scorecards were stored in a proprietary database, not in a SharePoint content database. With the release of SPS, PPS is now fully integrated into SPS as a service application (SA). SAs replace the shared service provider (SSP) architecture introduced with MOSS. The purpose of SAs is to enable for ease of deployment, management, and scalability of services deployed to application servers within a SPS farm. Figure 2.1 shows an example of SA deployment and its relationship to Web Front End (WFE) and database servers.
Download at www.wowebook.com
14
CHAPTER 2
PerformancePoint Services 2010
Typical SPS SAs include Excel Services, Business Connectivity Services, Search, and Visio Services (to name a few). You can also create your own custom SAs.
WFE APP Server
WFE
SPS Database
APP Server
WFE
FIGURE 2.1 An SPS deployment using three WFEs, two application servers, and one database server for content and configuration databases. In terms of manageability, PPS is managed using the SA page available in Central Administration (see Figure 2.2).
FIGURE 2.2 List of deployed SAs. The name of the PPS SA is PerformancePoint Service Application. Download at www.wowebook.com
What’s New?
15
2
The SA architecture makes scalability easy. You can add additional application servers into your SPS environment and deploy PPS to those servers to accommodate more users. You might want to do this to handle heavy workloads. For example, if the user response time is unacceptably high during peak load times during the workday, you can deploy another application server to handle the increased workload. You might also want to do this to provide uninterrupted service (for example, when you take an application server offline to upgrade the machine’s memory and then bring it back online without any interruption to service). For more information about these topics, see Chapter 4, “Installing Microsoft SharePoint Server 2010 and Configuring PerformancePoint Services,” and Chapter 12, “Maintaining a PPS Deployment.”
What’s New? Besides the new SA architecture described earlier in this chapter, PPS now has several new features and components. Improvements have been made to the scorecard, KPI, and report feature sets, including the following: . PPS object storage in SharePoint lists and libraries . Filters as objects that can be shared across dashboards . Calculated KPIs, which enable you to perform calculations from several different data sources . Dynamic hierarchy support, which updates a hierarchy when the data source is updated . Multiple KPI actuals . Hierarchies as connection points in the filter framework . Variance between actual and target values displayed on a scorecard . Empty-row filtering . KPIs natively on columns . Scorecard drill-down . Toolbar sorting and filtering redesign . KPI details report . Native support for the decomposition tree . Pie charts . SQL Server Analysis Services Conditional Formatting in Analytic Reports
Download at www.wowebook.com
16
CHAPTER 2
PerformancePoint Services 2010
In PPS 2010, browser support has been enhanced. Here is a list of supported browsers for dashboard viewing: . Internet Explorer 7 and 8 . Firefox 3.5 . Safari To learn how to use these new features, see the following chapters: . Chapter 7, “Using Indicators, KPIs, and Scorecards,” covers how to work with indicators and KPIs and how to integrate these objects into a scorecard view. . Chapter 8, “Reports,” covers how to work with the different types of PerformancePoint Services reports, including the new reports. . Chapter 9, “Page Filters, Dashboards, and SharePoint Integration,” examines the different ways to create dashboards and connect filters.
What’s the Same? Although the architecture of PPS is now based on SharePoint, the look and feel of PPS 2010 is not much different from the experience offered in PPS 2007. The Dashboard Designer makes an encore appearance as the primary vehicle to create and edit objects in PPS (see Figure 2.3). You can import almost all the content from PPS 2007 into PPS 2010 without loss of functionality.
FIGURE 2.3 In PPS 2010, you still use Dashboard Designer to create and edit objects. Download at www.wowebook.com
Summary
17
The following objects exist in both PPS 2007 and PPS 2010: . Scorecards, KPIs, and indicators . Analytic reports
2
. SQL Server Reporting Services, ProClarity Analytic Server (PAS), and Excel Services reports . Strategy Maps . Dashboards and filters Chapter 5, “Introducing PerformancePoint Dashboard Designer,” covers the Dashboard Designer in detail.
What’s Gone? Some features available in PPS 2007 are no longer available in PPS 2010, including the following: . Dashboard previews . OWC (Office Web Components), which include Pivot Tables and Pivot Charts . ODBC (Open Database Connectivity) data source connection . Trend analysis report
Summary This chapter is just a starting point. It briefly covered the PPS 2010 architecture and examines what’s new, what’s the same, and what’s been removed (since PPS 2007). You are encouraged to check out the various other chapters referenced herein for more information about how to make PPS 2010 work for you.
Download at www.wowebook.com
This page intentionally left blank
Download at www.wowebook.com
CHAPTER
3
Case Study: Managing What You Measure
IN THIS CHAPTER . Overview and Business Background 20 . Business Situation and Requirements 21 . Where to Start
This chapter provides a case study that enables you to follow Apples and Oranges Productions, a fictitious production company, as it begins to implement a business intelligence (BI) solution with PPS. The popular saying “You can’t manage what you can’t measure” says it all. Sometimes attributed to Peter Drucker, this saying drives home the point that appropriate metrics are at the core of BI and performance management solutions. This saying is also central to the ideas of Drs. Robert S. Kaplan and David P. Norton, the architects of the Balanced Scorecard methodology, a management system based on performance measurement that we discuss in relation to Apples and Oranges.
24
. Proposed Solution Architecture Roadmap 25 . Basic Project Plan
26
You can follow Apples and Oranges as it first examines its goals in a key area of its organization, and then plans what it needs to measure to manage effectively and reach these stated goals. You can follow its process as it moves from the work of identifying business goals and requirements to gathering and analyzing data, identifying measures, designing key performance indicators (KPIs) and scorecards, and designing reports and final dashboards using PPS. To borrow from another saying, “Rome was not built in a day.” A performance management system also cannot be built in a day or even a year. Building a performance management system is an iterative process that continues as long as your organization changes and grows. You should expect that this process will be punctuated by moments in which you need to pause to consider what you do not know but need to know to make good decisions. Further, it will be punctuated by points in which you need to make plans to collect data you need but do not yet have in place.
Download at www.wowebook.com
20
CHAPTER 3
Case Study: Managing What You Measure
In this chapter you find the story of what can happen when one company starts to implement a real-world BI solution along with a blueprint of a basic project plan that you can use as a jumping-off point for your own implementation with PPS.
Overview and Business Background Apples and Oranges, a film and television production company located in Los Angeles, has been in existence for 5 years and currently employs 250 employees. Figure 3.1 is a high-level organizational chart of Apples and Oranges.
Apples and Oranges Organization Structure CEO
Entertainment -Television
Producers
Unit Production Manager
Production Accountant
Entertainment-Film
Directors
Production Supervisor
Print AD
Production Coordinator
Second AD
Producers
Unit Production Manager
Production Accountant
Directors
Production Supervisor
Print AD
Production Coordinator
Second AD
Marketing
Sales and Marketing
CFO
Advertising
Finance
New Media
Legal
CIO
IT VPDevelopment
Human Resources
IT VPInfrastructure
Benefits
Employee and Labor Mediations
FIGURE 3.1 The organizational chart for Apples and Oranges. Since its inception, the Entertainment–Television group has created several local television shows and formed distribution and syndication relationships for these shows. Two years ago, Apples and Oranges expanded into nationwide syndication with a new show called The Green Orange (see Figure 3.2). The show was created to give people quick environmental tips in a humorous way and has just completed its second season. The Green Orange is broadcast in 10 markets across the country: New York, Los Angeles, Chicago, Philadelphia, Boston, San Francisco, Dallas, Washington DC, Atlanta, and Houston.
NOTE We have a confession to make. Apples and Oranges and The Green Orange are not entirely fictitious. For a few laughs and for tips and tricks on living green visit The Green Orange at http://www.thegreenorange.com.
As part of an overall company initiative to grow Apples and Oranges, the CEO asked the producers of The Green Orange to outline several short-term and long-term goals they would like to achieve with the show. The producers would like to start laying the foundation for these changes now, during the hiatus between the recently completed season two Download at www.wowebook.com
Business Situation and Requirements
21
3
FIGURE 3.2 The Green Orange from Apples and Oranges.
and the upcoming season three. They know that these goals relate to market expansion and increasing popularity. A BI consultant has been brought on board as an associate producer to help the producers of The Green Orange. Currently, the consultant knows that performance management is new to Apples and Oranges and that all the data captured for the show exists in numerous Excel spreadsheets. In addition to unifying the data into a central location and analyzing the show data, the consultant can help the producers of The Green Orange identify new goals for growth and understand how they can use performance management to meet these goals.
Business Situation and Requirements The BI consultant knows that if Apples and Oranges understands its goals and what it wants to measure, then most of the work has been done toward implementing a business intelligence solution that can guide the organization in making targeted, informed, and timely decisions. In his experience of working with organizations, the primary challenge is to agree on a methodology, that is to agree on what counts in an organization and how best to count it. PerformancePoint Services simplifies the creation and centralization of what counts in organizations. The difficult questions have to do with setting business goals and objectives. Having the data sources to support what an organization has decided counts is another issue that can present significant challenges. Download at www.wowebook.com
22
CHAPTER 3
Case Study: Managing What You Measure
Organizations can create scorecards and dashboards from any business management and performance management methodology. Starting from business management strategies such as Balanced Scorecard, Six Sigma, CMMI (Capability Maturity Model Integration), Agile Management, and CRM (Customer Relationship Management), organizations can build performance management frameworks for monitoring and analysis. PPS is flexible enough to capture the characteristics of each of these methodologies and the objectives and measures specific to any organization. At Apples and Oranges, the BI consultant reviews the Balanced Scorecard methodology with the CEO and her executive management team before working directly with The Green Orange producers. The Balanced Scorecard is a scorecard based on the performance management methodology developed by Drs. Robert S. Kaplan and David P. Norton. Kaplan and Norton’s comprehensive approach analyzes an organization’s performance in four areas: . Finance: Financial performance . Operations: Operational excellence . Sales: Customer satisfaction . Human Resources: People commitment Collectively, these areas are called the FOSH (Finance, Operations, Sales, and Human Resources) metrics. For now, the CEO and her management team agree to focus on the financial performance of Apples and Oranges, and specifically to focus on increasing the financial potential of The Green Orange. The CEO and her team understand that a full business intelligence system is a long-term process and that this journey of a thousand miles begins with a single step. The BI consultant is experienced in this process and knows that it is best to get the client started on the road to business intelligence as soon as possible with the data and questions it has available. He begins by interviewing the management and production teams, and a summary of the interviews can be found in the “Market Expansion” and “Increase Popularity” sections.
Market Expansion As part of their overall strategy, Apples and Oranges is planning to expand into new markets on several fronts. The production company has negotiated a license fee with 10 affiliate stations in different markets across the country. The fee is broken down into categories for the three types of broadcasts, as follows: . First Run: First run describes an episode that is shown for the first time in a specific market. First run shows can run at any time during the week, but each episode plays in all 10 markets within the same week, regardless of which day. . Ancillary: Ancillary describes an episode that already had its first run and is rebroadcast within 7 days of its first run broadcast. Often referred to as “an encore presentation” by the local affiliates, it does not necessarily air in the same week as a first run broadcast, but always airs before the next first run broadcast. For example, if Download at www.wowebook.com
Business Situation and Requirements
23
a week is considered to run from Monday to Sunday, an affiliate may broadcast a first run episode on Saturday night. The ancillary broadcast may not be until the following Wednesday. It is not uncommon for ancillary broadcast to run the hour before a new first-run episode airs. . Rerun: Rerun describes an episode that has already had a first-run and ancillary broadcast. From that point on, all broadcasts of that episode are referred to as reruns.
3
Currently in the top 10 television markets, producers of The Green Orange want to expand to the top 30 for next season. To do so, they must negotiate license fees in the 20 new markets. These should be based on the number of viewers in the market and comparable to the existing 10 markets. CEO: “We should be able to quickly glance and see a list of the top 30 markets in order of viewers.”
Affiliates make a profit by selling advertising time during the broadcast, usually to local companies. Apples and Oranges would like to land a national advertising partner. Placing a national ad into the broadcast would mean less advertising time available for the local affiliates, so the license fee needs to be renegotiated in existing markets. To understand these negotiations better, the CFO needs to have answers to the following types of questions: . How much do we need to drop the license fee to compensate for the loss of 1 minute of local advertising time? . What is the minimum we must charge for a national commercial to offset the potential drop in revenue if we discount the license fee? CFO: “It would be great to see some kind of sliding/adjustable scale so that you can fiddle with the numbers. You could adjust how much you charge for a national spot and how much you charge the affiliates to hit the perfect sweet spot.”
To get the maximum amount from a national advertiser, the show needs to have the best ratings possible. As the show is on at different times on different nights in the various markets, Apples and Oranges would like to analyze ratings data and try to figure out the best nights and spots in each market. It plans to offer a license discount if affiliates are willing to move the show to the more popular slots. Again, to understand their negotiation position better, Apples and Oranges needs to have answers to these questions: . How much can we offer while still increasing revenue? . How can the ratings from multiple markets be aggregated into an average for a national sponsor to use as a gauge? Marketing: “This key performance indicator would track ratings for the upcoming third season and compare it to the previous two seasons with the goal of increasing ratings by 10% over the previous two seasons (average).”
Download at www.wowebook.com
24
CHAPTER 3
Case Study: Managing What You Measure
Looking further into the future, Apples and Oranges will be expanding its show offerings. First, it will be creating a spin-off from The Green Orange. It needs to decide what night and spots the new show should take. Marketing: “By analyzing our ratings from the previous two seasons, we should be able to determine what the first and second best slots are for the show. We could then decide to move the current show with its loyal fans to the second best slot and put the new spin-off into the best possible slot to attract as many viewers as possible.”
Increase Popularity In addition to increasing ratings by improving the timeslots in various markets, the executives and producers also want to target the show to fit the audience’s tastes. This means analyzing the episodes with the highest ratings to try to spot trends in style, cast, and guest stars so that the most popular elements can be worked into more episodes. CFO: “This is an extension of the lower-costs initiative. By analyzing the show types and ratings, we should be able to strike a balance of lowering costs while satisfying fans. We want to analyze show demographics to determine whether certain elements increase viewership in our lower demographic categories. We need to break our ratings down into demographics to see if any show elements are more or less appealing to others than our core group of fans.”
Where to Start To better define and plan for its expansion strategies, Apples and Oranges needs to understand current performance of The Green Orange and overall market performance. Producers and executives need to answer the following questions quickly: . How is the show performing now? . How is the show performing relative to market indicators? . How is the market performing? . How can we better understand the market to position the show in the best way possible? . Which type of broadcast brings in the most viewers for The Green Orange? . What are the top markets in terms of viewers? . Based on the analysis, what targets do we want to set for the show? . Based on the analysis, what factors can help Apples and Oranges meet advertising and rating targets for the show? Asking questions such as these is a good starting point for Apples and Oranges and for the producers of The Green Orange. From these questions, executives and producers can derive straightforward metrics to build on. For example, by measuring the number of viewers per Download at www.wowebook.com
Proposed Solution Architecture Roadmap
25
episode, producers can answer the first question in this list, “How is the show performing now?” If The Green Orange is performing well, producers can start planning for market expansion and increasing advertising revenue. If the show is not performing well, the course of action needs to start with a plan to increase the show’s ratings.
TIP To start implementing a business monitoring solution: First, analyze your organization and ask what business problems you need to solve. Second, ask how your organization can quantify or measure these problems.
3
Third, go to your Information Technology group and ask how technology can support the metrics you have defined.
Proposed Solution Architecture Roadmap After consulting with senior management and key stakeholders, the IT group agrees that the best strategy is to start with a small implementation of PerformancePoint Services (PPS). Business monitoring is new to Apples and Oranges, so one of the goals of this strategy is to provide the company with a manageable start that it can build on. Its plan is to start with two servers, as shown in Figure 3.3, and create a deployment that can scale for rapid growth. At this stage, PPS and Excel Services are the only services that will be enabled on the SharePoint server.
End Users
SharePoint (WFE & App Server)
Database (OLTP & OLAP)
SSIS
Power Users
Management
FIGURE 3.3 IT proposes a two-server deployment of PPS that can scale easily for growth. Download at www.wowebook.com
26
CHAPTER 3
Case Study: Managing What You Measure
All the data that will be used is stored currently in individual spreadsheets. The plan is to load the data using SQL Server Integration Services (SSIS) and then continue to update it directly in the online transaction processing (OLTP) database. To make the data as accessible and flexible as possible, the IT group has also decided to build a dimensional data warehouse and an online analytical processing (OLAP) cube. Structuring the data in this way can make it easier to build analytics dashboards. It can also provide the producers with the business information they need to make timely, well-informed decisions.
NOTE SSIS is a tool that can manage a data Extract, Transform, and Load (ETL) process. It ships as part of the SQL Server platform.
Basic Project Plan To build monitoring solutions, organizations can begin with an examination of data or by examining existing business issues and decisions. Beginning at either end of the spectrum is appropriate and provides great flexibility. However, it is important to keep in mind that the data and business decisions must converge eventually. Regardless of the approach, appropriate metrics are at the core of BI and performancemanagement solutions. You always need to examine what you want to measure and how you plan to measure it. You always need to understand what data you currently have available to build your metrics. A basic project plan for building a BI solution needs to include the following high-level tasks: . Gather data . Analyze data and identify measures . Design KPIs and scorecards . Design reports . Design the final dashboard
Gather Data Data must be set up so that it can be used as a measure of performance. This is true regardless of the data source or storage solution. PPS can work with different types of data sources, regardless of whether your organization stores data in Analysis Services cubes or in Excel spreadsheets as Apples and Oranges does (see Figure 3.4). At Apples and Oranges, the spreadsheets contain data about actors, affiliates, regions, broadcast, characters, episode, license fees, and slots. This information is gathered from various data sources such as Nielsen ratings. The information is then consolidated manually into the spreadsheet. After the data warehouse, cube, and dashboards are built, the plan is to automate the data gathering process, too.
Download at www.wowebook.com
Basic Project Plan
27
3 FIGURE 3.4 Currently the data exists in a series of spreadsheets collected by the production team. Because the data in the spreadsheet is already fairly denormalized, the process of structuring it into a dataset that can be useful for an Analysis Services cube should be a straightforward process.
NOTE Keep in mind that when you import data from Excel, you often have to pay attention to data types. Frequently, data that you want to treat as Ints is interpreted by SSIS as Double or String. For this reason, make sure you do the proper data type conversions in SSIS.
Build Dimensional Data Warehouse The first step is to load the Excel spreadsheet data into SQL Server. This needs to be done so that Apples and Oranges can build a multidimensional data warehouse better suited to use with Analysis Services than Excel. The most straightforward way to load data from Excel into SQL Server is to use SSIS. The IT group has decided to load all the spreadsheet data, as is, into the staging area. This means it will not be doing any transformations or data conversions. The dimensional transformation will take place from the staging area. Figure 3.5 depicts the final dimensional schema.
Download at www.wowebook.com
28
CHAPTER 3
Case Study: Managing What You Measure
FIGURE 3.5 The final dimensional schema built from the data loaded from the Excel spreadsheets.
Based on the data warehouse, the IT group will build a cube that will be used to build KPIs, scorecards, reports, and dashboards. The initial structure of the cube is depicted in Figure 3.6. This cube will enable Apples and Oranges to analyze episode and viewer data. At first it might look as if the schemas in Figures 3.5 and 3.6 look almost identical. The difference is that Figure 3.5 shows the data warehouse schema and Figure 3.6 shows the schema used by SSAS.
TIP This is the initial structure of the cube that will be used to analyze episode and viewer data. Here are some points to keep in mind when building a cube: . It is easier to focus on a few measures and dimensions and make sure these are done right. Then you can add other measures and dimensions later. . It usually pays to start small. Do not try to implement all measures and dimensions at once. . After you have a solid foundation, adding more measures and dimensions is a straightforward process.
Download at www.wowebook.com
Basic Project Plan
29
3
FIGURE 3.6 The initial structure of the cube.
Analyze Data and Identify Measures When the IT team has gathered the data, it is ready to analyze it and identify from it the measures needed to answer the strategic business questions raised by the executives and producers. Fundamentally, these measures are the Key Performance Indicators (KPIs) that will be used to build scorecards and dashboards for the producers of The Green Orange. Listed here are KPIs that might assist in answering key questions: . KPI—Number of viewers for different types of broadcasts. . KPI—Advertising time for different types of markets and broadcasts. KPI displays market by advertising time. . KPI—Ratings by night and spot in each market. KPI displays market by ratings. . KPI—Most popular night. KPI displays audience numbers by day of the week. . KPI—Most popular spot. KPI displays audience numbers by spot and day of the week. . KPI—Most popular episode. KPI displays audience numbers by episode. . KPI—Most popular character in the show. KPI displays audience numbers by character appearance. . KPI—Most popular guest star. KPI displays audience numbers by guest star appearance.
Download at www.wowebook.com
30
CHAPTER 3
Case Study: Managing What You Measure
Design KPIs and Scorecards During the functional specification design process, basic concepts such as what should appear on a scorecard and which KPIs to use can be modeled using tools such as Excel or Visio. The next four figures include examples of scorecard mockups that were created using Excel. This first example, as shown in Figure 3.7, is a ratings scorecard that measures the numbers of viewers by each location and for each broadcast types. The final scorecard includes actual and target values. This can help the producers analyze and understand how The Green Orange is performing now in different locations.
FIGURE 3.7 The ratings scorecard measures numbers of viewers by each location and for each broadcast types.
In the second example, as shown in Figure 3.8, the data for each location and broadcast type in the sample ratings scorecard has been rolled up to display objectives only. In the third example, as shown in Figure 3.9, a character scorecard measures the number of viewers by each episode. The final scorecard includes actual and target values. This can help the producers of The Green Orange to determine which characters are the most popular. In the fourth example, as shown in Figure 3.10, the data for each character in the sample character scorecard has been rolled up to display objectives only.
Download at www.wowebook.com
Basic Project Plan
31
3
FIGURE 3.8 Roll up the data to the objective level to view overall values for each location.
FIGURE 3.9 The character scorecard measures the number of viewers by each character and for each episode.
Download at www.wowebook.com
32
CHAPTER 3
Case Study: Managing What You Measure
FIGURE 3.10 Roll up the data to the objective level to view overall values for each character. The first and most important KPI that the producers of The Green Orange want to analyze is viewers. As with the cube, the IT group has decided to begin with a small and simply designed scorecard that enables the producers to measure viewership against a target (see Figure 3.11). It also shows a KPI detail report on the right side of the scorecard. The KPI details report shows information such as metric, measure, and row and column path about a specific metric.
Design Reports Presenting properly designed reports is a critical aspect of a successful dashboard. Reports enable users to further investigate data and to apply visualizations that “makes sense” to them. Each person in an organization interprets and consumes information differently, and PPS makes is easy to change visualizations on-the-fly. The five figures included in this section are examples of how you can create a variety of different reports for Apples and Oranges while still using just the viewer KPI. The report shown in Figure 3.12 enables producers to analyze viewers by episode and region. It enables them to understand how the viewership trends over a season and provides answers to questions such as the following: . Does the viewership decline or increase during the course of a season? . Can a pattern be identified during the course of a season? . If so, what factors might influence a decline or an increase?
Download at www.wowebook.com
Basic Project Plan
33
3
FIGURE 3.11 This scorecard is simple but allows the producers of The Green Orange to measure a critical metric—the number of viewers.
FIGURE 3.12 Use this report to analyze viewership by episode and region.
Download at www.wowebook.com
34
CHAPTER 3
Case Study: Managing What You Measure
The stacked bar chart enables producers to analyze how the different regions proportionally compare to each other (see Figure 3.13).
FIGURE 3.13 The stacked bar chart presents a different view on the same data showing how different regions compare to each other. This second line chart, as shown in Figure 3.14, enables producers to drill into a specific region and look at viewership trends based on time and individual affiliates. The ability to analyze data in a grid format is useful when you want to drill down into data. The grid format used in Figure 3.15 enables producers to analyze data based on date and episodes. They can quickly understand how different seasons or episodes within a season compare to each other. Visio strategy maps enable producers to visualize data in many interesting ways. The strategy map shown in Figure 3.16 uses a map to inform the producers how the West, Central, and East regions compare to each other.
Design the Dashboard Fundamentally, the goal of a dashboard is to display valuable business information in the best possible way to foster and strengthen the decision-making process of an organization. The look and feel of the dashboard is critical to the success of a BI solution. PPS is a visual decision-making tool. The display of the data is just as important as how the data is stored and organized.
Download at www.wowebook.com
Basic Project Plan
35
3 FIGURE 3.14 This line chart displays viewership trends based on time and individual affiliates.
FIGURE 3.15 With the grid format, you can quickly drill down into data.
Download at www.wowebook.com
36
CHAPTER 3
Case Study: Managing What You Measure
FIGURE 3.16 Visio strategy maps enable you to present data in highly visual and accessible ways.
When designing a dashboard, it is important not to add too much information on one page. Users should analyze what is on a dashboard and figure out how the information pertains to them without spending unnecessary time scrolling up and down or trying to understand the meaning of a particular scorecard or report (see Figure 3.17). In the dashboard shown in Figure 3.17, several pages have been added, including Strategy Map, Show Details, Web Page, and Stacked Bar. This selection enables users to choose the scorecard or type of report they want to look at and makes it easy for users to navigate the data. Another good tool to use is filters, which enable the user to look at high-level information or select values that are more specific (see Figure 3.18). On the strategy map example, IT added a filter that enables the producers to analyze viewership based on all seasons, individual seasons, or individual episodes. Figure 3.18 uses the episode filter to show information for a single episode.
Download at www.wowebook.com
Summary
37
3 FIGURE 3.17 In this example, the dashboard offers the user a selection of pages, making it easy for them to navigate the data.
FIGURE 3.18 Filters enable users to specify the information they want to see.
Download at www.wowebook.com
38
CHAPTER 3
Case Study: Managing What You Measure
Summary This chapter introduced Apples and Oranges Productions and provided an overview of how the company initiated the process of implementing a BI solution with PPS. Apples and Oranges started by focusing its BI implementation in the financial area for one of its productions, The Green Orange. It already had some of the data necessary for analysis in Excel spreadsheets. The chapter covered the process of moving this data into SQL Server and transforming it into multidimensional data using SSIS. When the IT team built the data warehouse, they were building a cube that could be used to create KPIs, scorecards, reports, and dashboards. Later chapters in this book provide additional information and instructions on each of the topics introduced in this case study.
Best Practices . First, analyze your organization and ask what business problems you need to solve. . Second, ask how your organization can quantify or measure its business problems. . Third, go to your IT group and ask how technology can support the metrics defined by the business analysis. . If your company is new to BI, begin with a manageable implementation that you can then build on. . A basic project plan for building a BI solution includes the following tasks: gather data, analyze data and identify measures, design KPIs and scorecards, and design reports and final dashboards. . During the functional specification design process, use modeling tools such as Excel and Visio to diagram the basic concept for your scorecards and KPIs. . When you design a dashboard, it is important not to add too much information on one page.
Download at www.wowebook.com
CHAPTER
4
Installing Microsoft SharePoint Server 2010 and Configuring PerformancePoint Services
IN THIS CHAPTER . Examining PPS Installation Prerequisites 39 . Installing SharePoint . Configuring PPS
44
53
. Validating the PPS Installation 67
In this chapter, you take the first step toward implementing a business intelligence (BI) solution by installing Microsoft SharePoint Server (SharePoint) and configuring PerformancePoint Services (PPS). Because PPS is integrated into SharePoint, you must first install SharePoint and then configure the PPS service application. For the most part, the installation and configuration process is straightforward via various built-in tools and utilities. This chapter covers PPS installation prerequisites, how to use the Preparation tool to install SharePoint first, followed by how to configure PPS. This chapter also includes step-bystep instructions on how best to configure PPS and discusses various issues and points to consider when working through your installation and configuration. By the end of this chapter, you will have a fully functional SharePoint deployment with a properly configured PPS service application. You will be ready to start creating objects with PPS.
Examining PPS Installation Prerequisites Specific PPS server hardware and server software prerequisites must be satisfied before installation, configuration, and use can begin. These prerequisites are a subset of the prerequisites SharePoint requires.
Download at www.wowebook.com
40
CHAPTER 4
Installing Microsoft SharePoint Server 2010 . . .
Examining Server Hardware Prerequisites for PPS Component
Recommended Minimum
Processor
64 bit, dual processors at 3GHz
RAM
8GB
Hard disk
80GB
Examining Server Software Prerequisites for PPS Because PPS is integrated into SharePoint, you must begin by installing SharePoint. SharePoint is a sophisticated business server product. This chapter covers only a fraction of the supported deployment types for SharePoint, specifically the parts of SharePoint that interact with PPS. For more information about deploying SharePoint, we recommend the following book: Microsoft SharePoint 2010 Unleashed (0672333252). Examining SharePoint Operating System Prerequisites
CAUTION SharePoint 2010 dropped support for Windows Server x86 platforms. All installations need to be on x64 platforms. This is due to the enhanced scalability, reliability, and security advantages that x64 processors have over their x86 ancestors. Probably the most significant reason for dropping support for x86 platforms is the 4GB per process RAM limit inherent in the x86 platform architecture. After all, 4GB of RAM is not enough to provide reasonable performance in many SharePoint production scenarios.
To install successfully, SharePoint requires one of the following operating systems: . Windows Server 2008 x64, Standard . Windows Server 2008 x64, Datacenter . Windows Server 2008 x64, Enterprise . Windows Server 2008 x64, Web Server
NOTE Virtualization, primarily through Hyper-V, is a fully supported platform for running the operating system.
Examining SharePoint Prerequisites SharePoint requires the installation of several software components. The SharePoint installation media includes a handy SharePoint Products and Technologies 2010 Preparation tool that will install most of these components for you. There are two Download at www.wowebook.com
Examining PPS Installation Prerequisites
41
categories of prerequisites for SharePoint: ones that are installed for you automatically and ones you are expected to install on your own. The following table describes the required software components for SharePoint that are not installed automatically by the Preparation tool. How Used
Windows 2008 SP2
Contains some compatibility updates.
AMO 2008
Allows for advanced communication between SharePoint and SQL Analysis Services. Although not an enforced prerequisite, this is necessary for importing key performance indicators (KPIs) from SQL Analysis Services cubes.
4
Name
The following table describes the required software components that are installed for you through the Prerequisite Installer tool. Name
How Used
Web Server Role
Internet Information Services (IIS) components to host web applications.
Application Server Role
.NET Framework support and Windows process activation service support, which facilitates communication between servers within the farm.
SQL 2008 Native Client
Connectivity with SQL.
.NET Framework 3.5 SP1
.NET Framework compatibility fixes for SharePoint.
Windows PowerShell 2.0
Server administration via cmdlets support.
Geneva Framework Runtime
Support for Windows claims authentication. This is used for backend communication between servers in the farm.
Sync Framework Runtime v1.0
Used for Groove library synchronization.
Chart Controls for .NET 3.5
Rendering of analytic charts and grids.
Microsoft Filter Pack 2.0
Used for search functionality within SharePoint.
ADOMD.NET 2008
Connectivity with Analysis Services data sources.
Download at www.wowebook.com
42
CHAPTER 4
Installing Microsoft SharePoint Server 2010 . . .
Running the Preparation Tool All the prerequisites are installed through a standalone tool included with SharePoint. The tool installs all the prerequisites listed earlier and adds any Windows Server roles and features necessary for SharePoint to function properly. The Preparation tool requires connectivity to the Internet to install most of the components.
NOTE For SharePoint 2007, some prerequisites were installed as part of the Setup.exe process, whereas others had to be installed before launching Setup.exe. SharePoint 2010 improves this process. The PrerequisiteInstaller.exe utility installs everything necessary and configures the operating system automatically.
To run the SharePoint Products and Technologies 2010 Preparation tool, follow these steps: 1. Launch PrerequisiteInstaller.exe from the root of the installation CD. The first screen of the utility lists all components that will be installed or configured as a part of this utility (see Figure 4.1).
FIGURE 4.1 The Preparation tool checks for required products and updates. 2. Click Next to proceed to the Microsoft software license terms. The license terms here are the combined terms for all the products that will be installed. 3. Read the license terms. If you accept the terms, click I Accept the Terms of the License Agreement(s), and then click Next. The tool now checks for products and installs any required updates. Depending on your computer hardware and network connection, the installation may take several minutes to complete. Download at www.wowebook.com
Examining PPS Installation Prerequisites
43
TIP Downloading.NET Framework 3.5 SP1 from the Microsoft Download Center is the most time-consuming aspect of this part of the installation process. If the .NET Framework is installed from a local source before you run the Preparation tool, the tool will skip this step, greatly reducing the overall installation time.
4. When the tool has completed running, you see a status check (see Figure 4.2). Read the items to see whether any errors occurred or if a reboot is required before proceeding to install SharePoint. If there are no errors and you do not need to reboot, click Finish.
4
FIGURE 4.2 Review the status check carefully.
CAUTION Sometimes the Preparation tool fails or requires a reboot without clearly notifying you. Make sure you read the completion screen carefully before continuing. If you miss any error messages at this stage, you might have problems installing SharePoint.
The installation of all required software prerequisites is now complete, and you are now ready to install SharePoint.
Download at www.wowebook.com
44
CHAPTER 4
Installing Microsoft SharePoint Server 2010 . . .
Installing SharePoint SharePoint is a flexible product that you can install in a number of different ways. The methods range from a standalone installation that results in a functional deployment completed with a minimal number of clicks, to a more advanced server farm installation. The server farm installation is more complex and takes longer to complete, but it does allow for future expansion. In this section, you learn about both the standalone installation and the server farm installation. The following table outlines some of the common scenarios for each installation type. Installation Type
Scenario
Standalone
Quick setup for evaluation purposes Simplified Kerberos deployment Small datasets
Single-machine farm
Reduced hardware needs Simplified administration Simplified migration to a multimachine farm
Multimachine farm
Maximum performance scaling High security deployments High availability deployments Extranet deployments
Examining the Standalone Installation for SharePoint The standalone installation for SharePoint is intended to provide a quick evaluation of the SharePoint software and may be useful during a proof-of-concept phase. The standalone installation automatically configures many settings and makes the installation process simple and quick. This convenience does incur some risk. When doing a standalone installation, here are some issues to consider: . The standalone installation installs and uses SQL 2008 Express Edition. This edition has the following limitations: 1 CPU, 1GB of RAM, and a maximum database size of 4GB.
CAUTION If you use the standalone installation type for a production scenario or for long-term use, you will likely run into the 4GB database size limit. All content uploaded slowly eats into this limit.
Download at www.wowebook.com
Installing SharePoint
45
. When doing a repair on a standalone install, you risk overwriting previously created content. The repair process prompts the user to overwrite the default site that was created. This is the default option, which overwrites any previously created content. . The standalone installation instantiates and starts every service application. There are many of these service applications. If the server is not a high-capacity computer, this may overtax the computer’s resources and prevent the installation from completing successfully. . The standalone installation allows only a single-server configuration. This means that no expansion is possible. If you expect the single server to grow into a mission-critical application server, we recommend you go through the server farm installation.
Running the Standalone Installation for SharePoint 4
To run the standalone installation for SharePoint, follow these steps: 1. Launch Setup.exe from the SharePoint installation location. 2. Read the Microsoft software license terms. If you accept the terms, click I Accept the Terms of This Agreement, and then click Continue. 3. Enter the license key for this installation.
CAUTION Make sure the key is for an Enterprise deployment of SharePoint. The Standard SKU for SharePoint does not include PPS. If a Standard SKU key is entered here, and you want to upgrade to the Enterprise SKU later, you need to perform an SKU-to-SKU upgrade with a new license key. Consult the SharePoint documentation for more information on how to accomplish this.
4. Select Standalone as the installation you want (see Figure 4.3). The installation begins. 5. When the installation is complete, select the Run the SharePoint Products and Technologies Configuration Wizard Now check box, and then click Close (see Figure 4.4). 6. The SharePoint Configuration Wizard launches automatically. Click Next to proceed. 7. The wizard provides a warning about starting or resetting services during configuration. Review the warning carefully (see Figure 4.5). If it is acceptable to start or reset the services listed, click Yes.
CAUTION The SharePoint Configuration Wizard restarts IIS. If you run the installation on a mission-critical server, try scheduling this step during off hours or during scheduled downtime to avoid disruption of critical Internet services.
Download at www.wowebook.com
46
CHAPTER 4
Installing Microsoft SharePoint Server 2010 . . .
FIGURE 4.3 Select Standalone to install a single server standalone.
FIGURE 4.4 You are now ready to complete the configuration of your server. The wizard proceeds with configuring SharePoint. This step may take some time because it includes installing SQL Server 2008 Express and configuring SharePoint. When the wizard has completed the configuration, you see a message confirming a successful configuration. At this point, the SharePoint installation is almost functional.
Download at www.wowebook.com
Installing SharePoint
47
4
FIGURE 4.5 Review the list of services to be started or reset.
CAUTION PPS is not yet fully operational. Therefore, at this point you can create web applications and site collections. However, before a default connection to a data source can work, it is important to configure the Secure Store Service. To complete the PPS installation, see the “Configuring the Secure Store Service,” later in this chapter.
Examining the Server Farm Installation for SharePoint The server farm installation for SharePoint is intended for people who have a deeper understanding of SharePoint and how it works. The term SharePoint server farm refers to a more advanced installation. This installation has multiple machines working together from the same SharePoint configuration database. There are two main flavors of farms, both of which have the same installation steps. The differentiation comes in configuration after the installation completes. . Single-machine farm: All SharePoint components run on a single server that may or may not contain the SQL databases. . Multi-machine farm: Multiple machines with potentially varying SharePoint configurations work together from a single SharePoint configuration database. Machines within the farm can be hosting different SharePoint service applications. The server farm installation starts with a minimal configuration. You must then perform a series of steps to bring the environment to a functional state.
Download at www.wowebook.com
48
CHAPTER 4
Installing Microsoft SharePoint Server 2010 . . .
When doing a server farm installation, consider the following issues: . The server farm install requires a SQL Server 2008 or higher database. You can download the free Express Edition from Microsoft.com, or you can use an edition of SQL Server that has more appropriate database size limitations for your needs. . When setup completes, a wizard guides you through the initial configuration steps for the server farm. Depending on what you select as part of your installation, PPS may or may not be partially configured for you.
TIP For more information about how to install SQL Server for a server farm installation, we recommend the following book, Microsoft SQL Server R2 2008 Unleashed (0672330563).
Running the Server Farm Installation for SharePoint To run the server farm installation for SharePoint, follow these steps: 1. Launch Setup.exe from the SharePoint installation location. 2. Read the Microsoft software license terms. If you accept the terms, click I Accept the Terms of This Agreement, and then click Continue. 3. Select Server Farm as the installation type you want. 4. From the Server Type tab, select Complete, and then click Install Now. The installation begins (see Figure 4.6). The installation takes a few minutes to complete.
FIGURE 4.6 The installation now begins. Download at www.wowebook.com
Installing SharePoint
49
CAUTION At this point, you are again given the option between doing a farm install or a standalone install. Even though you selected a server farm install on the previous screen, the default is to do a standalone install on this screen, which negates the choice you made in the previous step and does a standalone install. Before proceeding, be sure to change the radio button selection to select Complete install. 5. When the installation is complete, select the Run the SharePoint Products and Technologies Configuration Wizard Now check box, and then click Close. 6. The wizard provides a warning about starting or resetting services during configuration. Review the warning carefully. If it is acceptable to start or reset the services listed, click Yes.
4
CAUTION The SharePoint Configuration Wizard restarts IIS. If you run the installation on a mission-critical server, try scheduling this step during off hours or during a scheduled downtime to avoid disruption of critical Internet services. 7. Select Create a New Server Farm, and then click Next. 8. In the Specify Configuration Database Settings dialog box, enter the name of the database server and the name of the database you want to use. In addition, specify the database access account in this dialog box (see Figure 4.7). This is the account that will be granted access to the database, and it will be the SharePoint server farm account. Click Next to continue.
FIGURE 4.7 Specify the SQL instance and database access account in this dialog box. Download at www.wowebook.com
50
CHAPTER 4
Installing Microsoft SharePoint Server 2010 . . .
TIP The user running setup needs system administrator level access on the database specified here. Setup uses the user’s credentials to grant minimal required permissions to the database access account.
9. The Configuration Wizard requests a passphrase that is asked for when other servers attempt to join the farm. Make sure you enter a strong passphrase, and then click Next to continue. 10. In this step, you configure the SharePoint Central Administration Web Application. The Administration Web Application is the site you use to perform all farm-level configurations. Enter a port number you can remember easily or accept the default random port. It is also possible to configure the authentication method for accessing Central Administration, with the default being NTLM. It is recommended that you use the default. Otherwise, Kerberos requires additional manual steps that need to be performed by a domain administrator to make Central Administration work after the Configuration Wizard closes. Make your choice, and then click Next. 11. Review the configuration settings that will be applied. When you are satisfied with the settings, click Next to start the installation. The installation takes several minutes to complete. 12. When the wizard has completed the configuration, you see a message confirming a successful configuration (see Figure 4.8). If configuration was successful, click Finish. 13. SharePoint Central Administration launches automatically. At this point, you can choose to participate in the Customer Experience Improvement Program. After you make your selection, click OK to continue.
FIGURE 4.8 This configuration completed successfully. Download at www.wowebook.com
Installing SharePoint
51
NOTE Microsoft uses the data collected through the Customer Experience Improvement Program to determine which bugs should get fixed in service packs and to shape testing efforts for future releases. This effort focuses on the most frequently used features. None of the data is personally identifiable information (PII). Make sure to enable this option if you want to cast a vote on which features should be tested.
14. Accept the default option, Walk Me Through the Settings Using This Wizard, and then click Next.
TIP
4
If you want to configure everything yourself, see the sections later in this chapter that explain how to configure the service application manually.
15. In the Service Account section, enter the credentials of a new account to use as an application pool for the service applications or use the SharePoint server farm account. In the Services section, select the services you want to run in the farm. Make sure to select PerformancePoint Service (see Figure 4.9).
FIGURE 4.9 In the Services section, make sure to select PerformancePoint Service.
Download at www.wowebook.com
52
CHAPTER 4
Installing Microsoft SharePoint Server 2010 . . .
TIP Regarding security, a best practice is to enter a new managed account in the Service Account section instead of using the existing server farm managed account.
CAUTION Depending on the computer hardware, this step may time out if all services are selected. This may happen especially if you select the Search service. If the process does time out, you can restart the wizard. At this point, only unconfigured services are available for configuration.
16. Enter a title for the site in the Title and Description section. In the Template Selection section, select a template for the root site of the site collection, and then click OK (see Figure 4.10).
FIGURE 4.10 In this screen, enter a title for your site, and select a template for the root site.
TIP From the Enterprise tab, select the Business Intelligence Center template for the site collection to have select features activated automatically. This can save a few configuration steps later.
Download at www.wowebook.com
Configuring PPS
53
When the Wizard has completed the configuration, you see a message confirming a successful configuration.
CAUTION Before you can begin working with PPS, you must configure the Secure Store Service and set the unattended service account properly. The following section provides information and step-by-step instructions about how to do so.
Configuring PPS 4
After SharePoint has been installed, the next step is to configure the PPS service application. You must complete this step regardless of the installation type you selected. In this example, you select to do a server farm installation in preparation for future expansion. The SharePoint farm starts as a single application server deployment. However, additional web and application servers can be added later to scale for future growth and expanding data requirements. In this type of installation, the administrator needs to complete the following tasks in the order shown here: 1. Configure the Secure Store Service. 2. Create the service application. 3. Start the PerformancePoint Service. 4. Configure all other service applications that will be useful in the deployment, such as Excel Services or SQL Server Reporting Services Integration.
Configuring the Secure Store Service The Secure Store Service is a service that encrypts selected data stored within it. A usergenerated encryption key is required to ensure that the data is secure. This is a new addition to the SharePoint feature set in SharePoint 2010.
NOTE For security reasons, PPS requires the Secure Store Service to be manually configured before it can be used. This ensures that passwords are not stored as plain text in the database.
Download at www.wowebook.com
54
CHAPTER 4
Installing Microsoft SharePoint Server 2010 . . .
The data that is encrypted is . Unattended Service Account credentials. This is a domain account used by default to access data sources. To configure the Secure Store Service, follow these steps: 1. Launch SharePoint Central Administration from the Start menu. Select Start, All Programs, Microsoft SharePoint 2010 Products, SharePoint 2010 Central Administration. 2. From Application Management, select Manage Service Applications. 3. Scroll to find and select Secure Store Service, and then click Manage on the ribbon (see Figure 4.11).
FIGURE 4.11 Select the Secure Store Service link from this screen.
TIP Two different types of Secure Store Service objects are created for you: the Secure Store service application and the Secure Store proxy. Both of these objects have links that should lead to the same page, which means that you may select either link.
Download at www.wowebook.com
Configuring PPS
55
4. From the Secure Store Service configuration page, select Generate New Key (see Figure 4.12).
4
FIGURE 4.12 Select Generate New Key from this screen. 5. Enter a secure passphrase in the dialog box (see Figure 4.13). Because it is protecting potentially sensitive data, make sure this is a strong password. Accept the check to Re-encrypt the Database Using the New Key, and then click OK. The database will be encrypted.
NOTE Wikipedia suggests the following guidelines for creating strong passwords: . Include numbers, symbols, and upper- and lowercase letters in passwords. . Password length should be between 12 and 14 characters. . Avoid any password based on repetition, dictionary words, letter or number sequences, usernames, relative or pet names, or biographical information. (“Password Strength” from Wikipedia, the free encyclopedia, http://en.wikipedia.org/ wiki/Strong_password#Examples_that_follow_guidelines)
Download at www.wowebook.com
56
CHAPTER 4
Installing Microsoft SharePoint Server 2010 . . .
FIGURE 4.13 Make sure you create a strong passphrase.
CAUTION To increase security, you should first configure the Central Administration pages to use Secure Sockets Layer (SSL). Alternatively, you need to ensure that the browser is running directly on the server so that Internet traffic is not going through a proxy server. If you do not do this, the passphrase you enter here can be viewed by a packet analyzer. A packet analyzer is a hardware or software utility that intercepts network traffic and allows an unauthorized user to see the password you are setting. The password appears in plain text on the HTTP packet. The packet analyzer can pick up the password you are sending to the server to configure the Unattended Service Account.
6. When the Secure Store Service key is generated successfully and the database is encrypted, click Home to return to the Service Application Management.
Creating the Service Application You are now ready to complete the final steps for your PerformancePoint installation. You must complete four tasks: . Start the PerformancePoint Service. . Create the PerformancePoint service application. Download at www.wowebook.com
Configuring PPS
57
. Set the Unattended Service Account. . Associate the service application proxy with a proxy group. These tasks may be performed in any order. Depending on your installation type, some of these tasks may not be required. If you selected to perform a server farm installation and bypassed the Configuration Wizard or cleared the PerformancePoint Service check box in the Configuration Wizard, you need to create the PerformancePoint Monitoring service application manually. Best practice is to verify these tasks regardless of the type of installation you performed. This can help to give you both peace of mind and ensure smooth functioning of the PerformancePoint Monitoring service application. After you perform or verify these tasks, you are ready to launch the Dashboard Designer and create your first dashboard.
4
Starting the PerformancePoint Service The PerformancePoint Service is the web service that all requests go through. This service needs to be started on at least one application server in the farm. Any server that has this service started will be servicing requests and conceptually “running” PPS. The PPS Service needs to run on at least a single application server in the server farm. Although you may choose to run it on multiple application servers in the farm, this is not necessary. Requests are load balanced equally by a round-robin distribution between all instances of the service that are running. This is a good way to help control the load and avoid performance issues.
NOTE You must start the PPS Service on every computer that shares the workload for PPS processes across the farm.
To start the PerformancePoint Service, follow these steps: 1. Browse to the SharePoint Central Administration site, and then click the System Settings tab in the navigation pane on the left. 2. From this page, click the Manage Servers in This Farm link available below the Servers option. 3. From the list of servers in the farm, click the name of the server where you want to start the service application. 4. Scroll and find PerformancePoint Service in the list of available services, and then click Start from the Action column. The status changes from Stopped to Started (see Figure 4.14).
Download at www.wowebook.com
58
CHAPTER 4
Installing Microsoft SharePoint Server 2010 . . .
FIGURE 4.14 The status changes from Stopped to Started.
CAUTION Although not an option available through the setup UI, it is possible to configure SharePoint to have web front-end (WFE) servers through command-line setup. It is possible to start the PerformancePoint Service on a WFE box that is not capable of successfully running the PerformancePoint Service. If this happens, the user periodically sees errors when using PerformancePoint whenever a web service request goes to the WFE box that has this service incorrectly running on it. Before proceeding, make sure that this is running only on the appropriate application servers.
This completes the first of the four tasks you must perform.
Creating the PerformancePoint Service Application Conceptually, the PerformancePoint service application is a collection of settings that will be used when a request is issued to PPS. For example, you might configure the following: . Unattended Service Account used to connect to data sources . Secure Store settings . Various application and timeout limits
Download at www.wowebook.com
Configuring PPS
59
The PerformancePoint service application differs from the PerformancePoint Service in one significant way. There can be multiple PerformancePoint service applications in the farm but only one PerformancePoint Service.
NOTE Creating a service application automatically creates a proxy associated with that service application.
To create the PerformancePoint service application, follow these steps: 1. Browse to the SharePoint Central Administration site, and then click Application Management in the left navigation pane.
4
2. Under Service Applications, click Manage Service Applications. 3. From the ribbon, click New. Click PerformancePoint Service Application to launch the PPS Service Application creation dialog box (see Figure 4.15).
FIGURE 4.15 This option launches the PPS Service creation dialog box. 4. Enter a name for the service application. If this is going to be the default service application, select Add This Service Application’s Proxy to the Farm’s Default Proxy List (see Figure 4.16).
Download at www.wowebook.com
60
CHAPTER 4
Installing Microsoft SharePoint Server 2010 . . .
FIGURE 4.16 Specify settings for the new PerformancePoint service application in this screen.
TIP If you select the Add This Service Application’s Proxy to the Farm’s Default Proxy List check box, the service application will be associated automatically with any web application that is created. There can be only one active service application per web application. These are managed by proxy groups, as discussed later in this chapter.
5. In the Application Pool section of this screen, you can select to either Use Existing Application Pool or Create New Application Pool. If you select Create New Application Pool, enter the application pool name. After you have made your selection, click Create to create the service application. This may take a few minutes. When the process has completed, you see a message confirming a successful creation.
Download at www.wowebook.com
Configuring PPS
61
NOTE If you use a new security account for the application pool that was not created by the SharePoint wizard, it is necessary to grant permission for that account to access the content database for each web application it will be associated with. This can be done by executing the following two PowerShell commands in a SharePoint 2010 Management Shell instance: $w = Get-SPWebApplication -Identity http://webapplicationurl $w.GrantAccessToProcessIdentity(“domain\serviceaccount”)
This completes the second of the four tasks you must perform.
4
Set the Unattended Service Account To set the Unattended Service Account, follow these steps: 1. From the Service Application Management screen, select Application Management, Manage Service Applications. 2. Scroll to find and select PerformancePoint Service Application from the list, and then select Manage from the ribbon. 3. From the PerformancePoint Service Application Management page, select PerformancePoint Services Settings (see Figure 4.17).
FIGURE 4.17 Select the PerformancePoint Services Settings link from this screen. Download at www.wowebook.com
62
CHAPTER 4
Installing Microsoft SharePoint Server 2010 . . .
4. Secure Store Service is selected as the default in this screen. If you plan to use the Unattended Service Account to access data sources, enter credentials in this screen, and then click OK (see Figure 4.18).
FIGURE 4.18 Select the default Secure Store Service or enter new credentials for the Unattended Service Account.
TIP If you do not enter credentials in this screen, the Network Service Account on any computer running PerformancePoint Service is used to connect to data sources. If you choose this method of access, ensure that the Network Service Accounts on all your application servers can access the appropriate data sources. If you are not planning to use the Unattended Service Account and do not want to use the Network Service Account method to access data sources, you likely need to configure per-user authentication via Kerberos. This complex process usually requires domain administrator level permissions to complete. See Chapter 10, “Securing a PerformancePoint Installation,” for information about how to configure per-user authentication.
This completes the third of the four tasks you must perform.
Download at www.wowebook.com
Configuring PPS
63
Associating the Service Application Proxy with a Proxy Group NOTE Only perform the task discussed in this section if you did not select the Add This Service Application’s Proxy to the Farm’s Default Proxy List check box when you created the service application. Leaving this check box clear means that the service application will not be used by any web applications by default. This step is necessary to identify which web applications use the service application.
4
Because there can be many service applications in the farm and a web application can only have one PerformancePoint service application associated with it, it is important to associate the correct service application with the correct web application. There are several ways to do this, but the easiest way is to configure the service connections while managing web applications. You can do this through the SharePoint Central Administration site.
CAUTION The following instructions assume that you have already created a web application. The Configuration Wizard also makes this assumption.
To associate the PerformancePoint service application with a proxy group, follow these steps: 1. Browse to the SharePoint Central Administration site, and then click Application Management in the left navigation pane. 2. Under Service Applications, click Configure Service Application Associations. 3. Select the name of the application proxy group next to the web application you need to edit. 4. Select the name of the service application to be associated with the web application check box, and then scroll to the end of the dialog box and click OK (see Figure 4.19).
CAUTION It is possible to put many service applications in a single proxy group. Unfortunately, it is not possible to make them all work at the same time. Therefore, be careful about where each service application is used. Only the default service application is used, which can be changed in an application proxy group.
This completes the fourth and final task that you must perform.
Download at www.wowebook.com
64
CHAPTER 4
Installing Microsoft SharePoint Server 2010 . . .
FIGURE 4.19 Configure service application associations in this screen.
Activating the Feature in the Web Application The last step to getting PPS up and running is to activate the PerformancePoint Services Site Collection and Site features in the sites or site collections that use them. A feature is a package of SharePoint settings that represent a unit of functionality. When activated, a feature adds additional functionality to a SharePoint web application, site collection, or site. PPS has features available only at the site collection or site levels. Activating the feature creates the content types, Web Parts, and site definitions necessary to launch Dashboard Designer (and to render dashboards). Feature activation must be performed inside the site collection that hosts PPS dashboards (see Figure 4.20). In addition, the activation must be performed by a site collection administrator.
CAUTION If there are many site collections in a web application, the site collection administrator must activate the feature in each site collection that will be running PPS. There is no way to do this in bulk, although it is possible to script the activation through PowerShell. See Chapter 12, “Maintaining a PPS Deployment,” for more information.
NOTE If you use the Business Intelligence Center site template as the initial template for the site collection for your web application, this step is done automatically.
Download at www.wowebook.com
Configuring PPS
65
4
FIGURE 4.20 Select to activate the site collection features in this screen. Activating the Feature at a Site Collection Level To activate the feature in the site collection, follow these steps: 1. Browse to the root of the site collection. Remember you must be the site collection administrator. 2. Click Site Actions, and then click Site Settings. 3. Under Site Collection Administration, click the Manage Site Collection Features link.
NOTE If you are not at the site settings for the root site of the site collection, this link will not be available.
4. Scroll to find PerformancePoint Services Site Collection Features. If the feature is not already activated, click the Activate button (see Figure 4.21).
NOTE The action activates the SharePoint Server Publishing Infrastructure feature automatically because this feature is a prerequisite feature for the PerformancePoint Services site collection features.
Download at www.wowebook.com
66
CHAPTER 4
Installing Microsoft SharePoint Server 2010 . . .
FIGURE 4.21 You see an Active banner after you activate the feature.
5. When activation completes, browse to each site that needs to host PerformancePoint content. For each site, go to the Site Actions menu and select the Site Settings menu item.
TIP Past this point, being a site collection administrator is no longer required. Site administrator access is required only on sites that host PerformancePoint content.
You also need to perform the steps included in the next section for any site that you want to use to host PerformancePoint content. Activating the Feature at a Site Level To activate the feature in the site, follow these steps: 1. Browse to the site at which the PPS feature is to be used. Remember that you must be the site administrator. 2. Under Site Actions, click the Manage Site Features link. 3. Scroll to find PerformancePoint Services Site Collection Features. If the feature is not already activated, click the Activate button (see Figure 4.22).
Download at www.wowebook.com
Validating the PPS Installation
67
4
FIGURE 4.22 You see the Active banner after you activate the feature.
4. When activation completes, browse to each site that needs to host PerformancePoint content. For each site, go to the Site Actions menu, and then select the Site Settings menu item.
Validating the PPS Installation With a multistep installation, a best practice is to verify that all components are configured and working properly before moving the application into full production for use by business users. You can validate the PPS installation by launching and using PerformancePoint Dashboard Designer to create a data source, scorecard, and dashboard. Dashboard Designer is the design tool you use to build these PPS objects. If you can successfully create a data source, scorecard, and dashboard, you can rest assured that you have configured PPS correctly. To prepare for validating the PPS installation, read Chapter 5, “Introducing PerformancePoint Dashboard Designer,” which serves as an introduction to Dashboard Designer. Then read Chapter 6, “Data Sources,” Chapter 7, “Using Indicators, KPIs, and Scorecards,” and Chapter 9, “Page Filters, Dashboards, and SharePoint Integration,” where you can find instructions on creating a data source, scorecard, and dashboard.
Download at www.wowebook.com
68
CHAPTER 4
Installing Microsoft SharePoint Server 2010 . . .
Summary PPS is integrated into SharePoint, so first you must install SharePoint and then configure the PPS service application. It is important to note that the installation of SharePoint 2010 is similar to the installation of SharePoint 2007, but the configuration of the PPS service application is different. The service application concept has been changed significantly in the PPS 2010 release, and these changes impact the configuration process. For the most part, the installation process is straightforward, and the Preparation tool guides you through the installation of SharePoint, including the identification and installation of software prerequisites. SharePoint can be installed as a standalone installation or a server farm installation. The server farm installation is more complex and takes longer to complete, but it allows for future expansion. Regardless of the type of installation you select, you must complete four tasks to complete the PerformancePoint installation: . Start the PerformancePoint Service. . Create the PerformancePoint service application. . Associate the service application proxy with a proxy group. . Activate the feature in the web application. Upon completion of these tasks, you will have a fully functional SharePoint deployment with a properly configured PPS service application, which means you are ready to start creating objects with PPS.
Best Practices . For more information about SharePoint and deploying SharePoint, we recommend the following book, Microsoft SharePoint 2010 Unleashed (0672333252). . Remember to use an x64 operating system; x32 is no longer supported. . Downloading .NET Framework 3.5 SP1 from the Microsoft Download Center is the most time-consuming aspect of this part of the installation process. If necessary, install the .NET Framework from a local source before running the Preparation tool (to reduce overall installation time). . Use the standalone installation for SharePoint to provide a quick evaluation of the SharePoint software during a proof-of-concept phase. . If you run the installation on a mission-critical server, run the SharePoint Configuration Wizard during off hours or during scheduled downtime to avoid disruption of critical Internet services.
Download at www.wowebook.com
Best Practices
69
. Join the Customer Experience Improvement Program to participate in helping to shape feature and testing efforts for future releases. . A best practice regarding security is to enter a new managed account in the Service Account section instead of using the existing server farm managed account. . Verify the four tasks for creating the service application regardless of the type of installation you performed. . Validate the PPS installation by launching and using PerformancePoint Dashboard Designer to create a data source, scorecard, and dashboard.
4 Download at www.wowebook.com
This page intentionally left blank
Download at www.wowebook.com
CHAPTER
5
Introducing PerformancePoint Dashboard Designer After you have deployed a fully functional Microsoft SharePoint Server 2010 installation with a proper configuration of PerformancePoint Services (PPS), you are ready to launch PerformancePoint Dashboard Designer. Dashboard Designer is the design tool you use to create and deploy dashboards on SharePoint. Dashboard Designer is a ClickOnce application, making installation a straightforward process. Dashboard Designer is a visual and intuitive design tool that also makes the creation of scorecards and dashboards for monitoring performance a straightforward process.
IN THIS CHAPTER . Understanding PerformancePoint Dashboard Designer Prerequisites 72 . Installing Dashboard Designer 73 . Uninstalling Dashboard Designer 75 . Examining Dashboard Designer 76 . Content Migration with Dashboard Designer 84
This chapter covers the specifics of launching Dashboard Designer, including understanding how to install and uninstall a ClickOnce application. It also provides an overview of the Dashboard Designer main screen and most important options and a section on migrating content with Dashboard Designer. It is recommended to review the installation chapter (Chapter 4, “Installing Microsoft SharePoint Server 2010 and Configuring PerformancePoint Services”) before launching Dashboard Designer. This chapter serves as an introduction to Dashboard Designer. For additional information and instructions on using some of the most important and most frequently used Dashboard Designer features, see . Chapter 6, “Data Sources” . Chapter 7, “Using Indicators, KPIs, and Scorecards” . Chapter 8, “Reports” . Chapter 9, “Page Filters, Dashboards, and SharePoint Integration”
Download at www.wowebook.com
72
CHAPTER 5
Introducing PerformancePoint Dashboard Designer
Understanding PerformancePoint Dashboard Designer Prerequisites PerformancePoint Dashboard Designer is the design tool you use to build key performance indicators (KPIs), indicators, scorecards, reports, filters, data sources, and dashboards. It also enables you to deploy your finished dashboards to SharePoint. Dashboard Designer is a .NET Framework ClickOnce application that requires the .NET Framework 3.5 SP1. It also has a few other optional components that enable additional functionality that users can install on their own, including the following: . Visio 2007 or 2010 Professional for creating or editing strategy map reports . Report Viewer 2008 for creating or editing SQL Server Reporting Services reports
NOTE If you deploy Dashboard Designer in a highly secure environment, it is important to ensure that the proper prerequisites are installed. If the .NET Framework 3.5 SP1 (Service Pack 1) is not installed, you see an error indicating that the System.Data.Entity assembly does not exist on the client machine (see Figure 5.1). To resolve this, ensure that the .NET Framework 3.5 is installed and has been upgraded at least to SP 1. Figure 5.1 shows the error message you see if the appropriate .NET Framework version is not installed.
FIGURE 5.1 This error appears if the .NET Framework 3.5 SP1 is not installed.
Download at www.wowebook.com
Installing Dashboard Designer
73
You can determine which service pack of the .NET Framework is installed on a client machine by querying the HKEY_LOCAL_MACHINE\SOFTWARE\Microsoft\NET Framework Setup\NDP\v3.5 Registry entry for the service pack value. The service pack value should be 1 or greater than 1. Visio 2007 or 2010 Professional is required on the client machine for creating or editing strategy maps. Strategy maps are reports that enable you to connect KPI data to Visio shapes to visualize data. Due to interoperability requirements from the .NET Framework, it is important that the processor architecture for the operating system match the processor architecture for the version of Visio that is installed. If the processor architecture does not match, it will not be possible to edit strategy maps with that particular client machine. It is possible to work with strategy maps by adding them to dashboards and creating links between the strategy map and other PPS objects on the dashboard editor, but you cannot create new ones. The following table summarizes the client processor architecture compatibility for Visio and Windows (what combinations work on the client machine). Windows x64
Visio 2007 (x86 only)
Works
Does not work
Visio 2010 x86
Works
Does not work
Visio 2010 x64
N/A
Works
5
Windows x86
Installing Dashboard Designer Dashboard Designer is a ClickOnce-deployed application. One advantage to ClickOnce technology is that the application is hosted and client deployment is lightweight. Therefore, you do not have to install the application from any type of installation media or files, and there is not an EXE file. Instead, you launch the Dashboard Designer installation by clicking a hyperlink located on the home page on a site created using the Business Intelligence template. In addition, patches are applied automatically. If the SharePoint server has a patch or service pack applied, the next time a user launches Dashboard Designer, the ClickOnce framework checks the version number on the server and downloads an updated version before launching.
CAUTION Patching, which refers to deploying a new version of Dashboard Designer on the server, works fine as long as the build version is moving forward. If the new build number is lower than the last run version on the client machine, the application will not be updated automatically. Patching breaks down in cases where the patch applied to the server has been rolled back or in a multiple server scenario where there are two environments at different patch levels. If this happens and strange behavior occurs, follow the steps for uninstalling Dashboard Designer described later in this chapter.
Download at www.wowebook.com
74
CHAPTER 5
Introducing PerformancePoint Dashboard Designer
All first class objects created by Dashboard Designer are stored in one or more SharePoint document libraries and lists. A first class object is an item that you can manage in Dashboard Designer and reuse in different dashboards. Examples of an item include a KPI, an indicator, a scorecard, reports, filters, data sources, and dashboards. You learn more about first class objects in the “Examining First Class Objects” section later in this chapter. To initiate the Dashboard Designer download and installation process, follow these steps: 1. Browse to a Business Intelligence Center site, such as http://localhost/BICenter (see Figure 5.2).
FIGURE 5.2 Click Run Dashboard Designer from this screen. 2. Under the Create Scorecards with PerformancePoint Services section, click the Start Using PerformancePoint Services link. 3. Click the Run Dashboard Designer button. Dashboard Designer downloads and starts. When this process is complete, you see the main screen of the Dashboard Designer application, as shown later in Figure 5.4. After you download and start Dashboard Designer the first time from the website, you can start it from your computer’s Start and Programs menu. Dashboard Designer does not operate in offline mode. This means you must be connected to a SharePoint instance running PPS to run Dashboard Designer. It is also possible to start Dashboard Designer when viewing a SharePoint list that supports PPS content types. You can create a new item by clicking the Add New Item button at the bottom of the web page, or you can use the New Item button on the Item tab located in the page ribbon.
Download at www.wowebook.com
Uninstalling Dashboard Designer
75
You can edit an existing item by accessing the item’s drop-down and selecting the Edit in Dashboard Designer option. In both cases, when Dashboard Designer launches, add the current list to the workspace, and any dependent items, and then open the item for editing in Dashboard Designer.
TIP It is possible to launch Dashboard Designer from Firefox. To do this, you must have the Microsoft .NET Framework Assistant 1.1 add-on for Firefox installed. This add-on ships with Windows Vista and Windows 7. You can find the add-on for Firefox by searching for add-ons on the client computer. If the add-on is not installed on your computer, you can download it from https://addons.mozilla.org/en-US/firefox/addon/9449?collection_uuid= 55afefb5-620d-ae0c-d5d1-b602b44e6428. Although Safari is supported for viewing dashboards and PPS Web Parts, it is not possible to install a ClickOnce application using Safari.
5
Uninstalling Dashboard Designer It is not possible to remove ClickOnce applications from the Windows Control Panel using the Add/Remove Programs option. However, because the files and settings created by Dashboard Designer are well contained, it is possible to remove Dashboard Designer from a client machine. To do this, perform the two steps listed here for each user who has used Dashboard Designer: 1. Delete the shortcut created on the Start menu under the SharePoint menu item. 2. Delete all files underneath %userprofile%\local settings\apps\2.0.
CAUTION Keep in mind that the second step mentioned here also removes other ClickOnce applications that have been installed. However, these ClickOnce applications should download again automatically the next time they are launched by the user.
The first step removes the shortcut to Dashboard Designer. By removing access, it appears to the end user that Dashboard Designer has been removed from the computer. Although Dashboard Designer will not be readily accessible, the Dashboard Designer files and settings will remain on the computer. These files and settings do not take up much space on the hard drive, so this step is probably sufficient for the average end user. The second step removes the Dashboard Designer binaries from the computer (see Figure 5.3 for a list of folders to delete). This should be mostly transparent to the end user.
Download at www.wowebook.com
76
CHAPTER 5
Introducing PerformancePoint Dashboard Designer
FIGURE 5.3 This is a sample list of folders to delete to remove Dashboard Designer from a client machine. Do not delete the manifest directory.
Examining Dashboard Designer When you launch Dashboard Designer, the main Dashboard Designer screen consists of the following elements: . A ribbon with three tabs: Home, Edit, and Create (see Figure 5.4) . Workspace Browser pane on the left . SharePoint tab that displays a view of the items that have been deployed to SharePoint . Workspace tab that displays a view of the items that exist in the local workspace When you select an item from the Workspace Browser on the left, the screen changes to include a view of the item in the workspace and a Details pane on the right, as shown in Figure 5.5. The Details pane appears when you select a workspace item such as a KPI, scorecard, or data source. In the example shown in Figure 5.5, you see the settings for The Green Orange Data Connection in the center of the screen. On the right, the Details pane provides information on The Green Orange item.
Download at www.wowebook.com
Examining Dashboard Designer
77
FIGURE 5.4 This is a view of the main Dashboard Designer screen with items deployed to
5
SharePoint.
FIGURE 5.5 The Details pane changes depending on the item you select from the Workspace Browser.
Download at www.wowebook.com
78
CHAPTER 5
Introducing PerformancePoint Dashboard Designer
Examining First Class Objects Dashboard Designer allows you to work with first class objects. First class objects are items that you can manage in Dashboard Designer and reuse in different dashboards. The following items are considered first class objects: . Dashboards: A compilation of KPIs, scorecards, reports, and filters. A dashboard is deployed to SharePoint. . Scorecards: A compilation of KPIs. . KPIs: KPIs enable you to measure the success of your organization, project, employees, and products. This is done by defining a goal or target value that is compared to an actual value. . Filters: Filters enable you to filter dashboard items so that you can view only select items. The filter values can be almost anything. For example, you can filter by time, region, employee, or product. . Indicators: Visual element associated with your KPIs that enables you to determine the status of a KPI. A classic example of an indicator is the red, yellow, and green traffic light indicator. . Data Sources: PPS enables you to connect to the following data sources: Analysis Services, Excel Services, Excel Workbook, SharePoint List, and SQL Server Table/View. . Reports: Reports enable you to visualize data using charts such as bar and line charts. Types of reports include analytic grid, analytic chart, strategy map, KPI details, and Reporting Services. Other reports include Excel Services, ProClarity Analytics server page, and web page.
NOTE All objects that you create are stored in a database. Objects cannot be deployed until they have been saved to the database. You can also save a workspace locally as a Dashboard Designer Workspace (DDWX) file.
You learn more about the first class objects listed here, including how to use them, in the following chapters: . Chapter 6, “Data Sources” . Chapter 7, “Using Indicators, KPIS, and Scorecards” . Chapter 8, “Reports” . Chapter 9, “Page Filters, Dashboards, and SharePoint Integration”
Download at www.wowebook.com
Examining Dashboard Designer
79
Examining the Home Tab The Home tab is made up of the following sections: . Clipboard . Workspace . Item . Changes . Import The Home tab is context sensitive, which means the options available will vary depending on the item you select. This section covers only the most important options in the Home tab. Workspace Section The Workspace section of the Home tab offers the following options, among others (see Figure 5.6):
5
. Add Items: Enables you to add an item and its related items to the local workspace. If you add a scorecard, the KPIs, data sources, and indicators that the scorecard uses will also be added. This option, which is context sensitive, will activate when you have objects highlighted in the SharePoint tab. . Add Lists: Enables you to add a SharePoint list to the workspace. You cannot create a new list. Instead, the list has to exist in SharePoint. . Refresh: Enables you to refresh the contents of a list. Use this option to update the contents of your local workspace to include items that have been added to a SharePoint list.
FIGURE 5.6 The Home tab contains the Workspace section. Download at www.wowebook.com
80
CHAPTER 5
Introducing PerformancePoint Dashboard Designer
Item Section The Item section of the Home tab offers the following options among others: . Properties: This option enables you to open the item’s properties page in SharePoint. See Chapter 10, “Securing a PerformancePoint Installation,” for more details. . Permissions: Opens the item’s permissions page in SharePoint. Because all Dashboard Designer items are SharePoint list items, the permissions from its parent, which is a site in this case, will apply. If necessary, you can break the inheritance. . Delete: Enables you to delete an item from either the local or SharePoint workspace. Changes Section The Changes section of the Home tab offers the following options: . Compare Item: Compare an item in the workspace with the latest saved version in SharePoint. This will produce a detailed report of property value differences between the workspace item and the SharePoint item. . Validate Item: Checks that all data sources are valid and available for the item you select. For example, you can use this option to verify that data is available for all the KPIs on a scorecard. . Mark Differences: Enables you to mark items in the local workspace that have a different property value compared to the SharePoint item.
Import Section The Import section of the Home tab offers the following option: . You can import content from different SharePoint lists on the same site, from different site collections on the same server, from a different SharePoint farm, or from a custom created DDWX file. . The DDWX file format is created by serializing PPS objects from the SharePoint content database into a simple XML structure. It is possible to do custom editing of DDWX files before importing them. This proves useful if you want to do bulk editing of content and are comfortable working with XML.
CAUTION The import feature in PPS 2010 works differently than the import feature in PPS 2007. In PPS 2007, you simply connected to a new server and republished the objects to import. In PPS 2010, the database and content are hosted natively in SharePoint. To import content, you must use the import user interface in Dashboard Designer. The “Content Migration with Dashboard Designer” section, later in this chapter, describes this process in more detail.
Download at www.wowebook.com
Examining Dashboard Designer
81
Examining the Edit Tab The Edit tab is context sensitive, which means the options available will vary depending on the item that you select. For example, the options available will differ if you select a KPI or if you select a scorecard. The options available when a scorecard is selected are shown in Figure 5.7. Object-specific functionality for the various objects in PPS is discussed in their respective chapters.
5
FIGURE 5.7 In this example, the Edit tab shows the options that are available when you select a scorecard. Bulk Edit Section When you select two or more items to edit, you will see the Bulk Edit section with the Bulk Edit option, as shown in Figure 5.8. The Bulk Edit option enables you to select and edit two or more items from a document library or workspace list. You can use this option to change the following properties: Description, Person Responsible, and Display Folder. This option appears when you select more than one item on the Workspace tab in Dashboard Designer. This can prove useful when you need to change the same property on a number of objects (for example, changing the display folder for 15 KPIs simultaneously).
Download at www.wowebook.com
82
CHAPTER 5
Introducing PerformancePoint Dashboard Designer
FIGURE 5.8 Use the Bulk Editing option to make changes to two or more items from a document library or workspace list.
Examining the Create Tab The Create tab, shown in Figure 5.9, enables you to create any first class object. Examples of these first class objects include items such as dashboards, scorecards, KPIs, filters, indicators, and data sources. The Create tab also enables you to create different types of reports, including analytic charts, analytic grids, strategy maps, KPI details, Reporting Services, and other report types. The details for working with each of these dashboard items and reports are discussed in their respective chapters.
FIGURE 5.9 The Create tab enables you to create dashboard items and reports. Download at www.wowebook.com
Examining Dashboard Designer
83
Examining Dashboard Designer Item Properties Every first class item, except dashboards, has the same options available on the Properties page, as shown in Figure 5.10. A dashboard has an additional section called Deployment Properties. Remember that there are SharePoint properties available, as well as security.
5 FIGURE 5.10 The Properties pane for most items consists of general properties and custom properties. The Properties pane for all items, except dashboards, consists of two sections: General Properties and Custom Properties. General Properties In the General Properties section, you can specify the following properties: . Name: The name of the item. . Description: Item description. . Person Responsible: The person who is responsible for an item. For example, you can list a person to contact if there are questions about a KPI. . Display Folder: This setting enables you to organize items into folders. Remember that these are logical folders. Everything is stored in a database, so there is no actual file folder being created anywhere.
Download at www.wowebook.com
84
CHAPTER 5
Introducing PerformancePoint Dashboard Designer
Custom Properties In the Custom Properties section, you can select and add different property types, including text, decimal, date, or hyperlink. In the example shown in Figure 5.11, a custom property type called Expiration was added. Expiration is a date property type added to indicate how long a scorecard is valid. Another example is to add a property of type Hyperlink that shows a URL linking documentation that further explains the KPI. For example, this might include information on the data sources and calculations that are being used.
FIGURE 5.11 For custom properties, select the property type from the Property Type Selector.
Content Migration with Dashboard Designer You can import content between farms, between site collections, or even within sites when you want to move content between lists. In PPS 2010, the database and content are hosted natively in SharePoint. To import content, you must use the import user interface in Dashboard Designer. First, in Dashboard Designer, you need to save the DDWX files on the source content server.
Importing Content with Dashboard Designer To import content with Dashboard Designer, follow these steps (which assume that you have saved a DDWX file with the objects you want to import): 1. Open Dashboard Designer for the site to which you want to import. Ensure that the destination lists into which you are importing have been added to your current workspace. Click the Import Items button. 2. Select a local DDWX file you want to import and click OK in the file-selection dialog box. 3. In the Import Items to SharePoint dialog box shown in Figure 5.12, you see the Import From column. This column shows the document libraries and lists that exist in the workspace you selected in the previous step. The Copy To option enables you to browse for the document library or list to which you want to copy. Click the link to specify the document library or list on SharePoint where you want to copy the items.
Download at www.wowebook.com
Content Migration with Dashboard Designer
85
FIGURE 5.12 Click the link to specify the document library or list on SharePoint where you
5
want to copy the items. Location mapping will be done automatically if there are lists with the same names in your current workspace, as in the source location specified in the DDWX file to import. If not, select the lists into which you want to import. In this example, the Data Connections option from the workspace was selected. The only valid destination on SharePoint is a document library also called Data Connections. This is the only valid destination because it is the only document library with an associated data connection document type. In addition, items from a document library cannot be imported into a list. Similarly, items from a list cannot be imported into a document library. This is because the different content types associated with the library and list are not compatible. This dialog box provides the following available options: . Import Data Sources That Already Exist in the Destination: When this item is selected, additional copies of data sources are created for any data source with the same name that already exists in the destination list. The data sources are using GUIDs as an identifier when they are being saved on the server and not the display name. That is how you can end up with two or more data sources using the same name. Do not select this option if you want to reuse existing and available data sources. . Import Items with Missing Dependencies: This option enables you to import incomplete items. For example, you can import a KPI even if its data source is not present in the workspace. Select this option if you want to import an incomplete list of objects in a working state so that you can continue development in the destination location.
Download at www.wowebook.com
86
CHAPTER 5
Introducing PerformancePoint Dashboard Designer
All document libraries and lists from the workspace must be mapped to a SharePoint destination before you can continue. When you have mapped all the items, click Next to import the items to SharePoint. When the import process is complete, you see a screen detailing the results of the import (see Figure 5.13). If something did not happen as you expected, click the View the Log to See More Details link. This opens a log file in Notepad detailing exactly what happened to each object selected for import.
FIGURE 5.13 When the process is complete, you see the results.
Summary Dashboard Designer is the design tool for building KPIs, indicators, scorecards, reports, filters, data source, and dashboards. It is also the tool used for importing content between farms, site collections, or even within sites. As a ClickOnce application, installing Dashboard Designer and keeping it up-to-date is a straightforward process. The ClickOnce framework ensures that you are always working with the most recent version of the application. There are a few prerequisites for installing Dashboard Designer, including the installation of .NET Framework 3.5 SP1 and the installation of Visio and Report Viewer for creating and editing specific report types. After you have fulfilled these prerequisites, you can take advantage of Dashboard Designer to start building a performance-monitoring system.
Download at www.wowebook.com
Best Practices
87
Best Practices . Review Chapter 4 of this book before launching Dashboard Designer. . Install .NET Framework 3.5 SP1 before launching Dashboard Designer. . Install Visio 2007 or 2010 Professional to create or edit strategy map reports. . Examine the processor architecture for the operating system to make sure it matches the processor architecture for the version of Visio that is installed. . Install Report Viewer 2008 to create or edit SQL Server Reporting Services reports. . To uninstall Dashboard Designer for the average user, just delete the shortcut. . To uninstall Dashboard Designer and delete the Dashboard Designer binaries, remove all files under %userprofile%\local settings\apps\2.0. Do not remove the manifest directory.
5 Download at www.wowebook.com
This page intentionally left blank
Download at www.wowebook.com
CHAPTER
6
Data Sources
IN THIS CHAPTER . Overview of Data Sources
90
. Analysis Services Data Sources 92 . PowerPivot Data Sources
95
. Excel Services Data Source 97
As the foundation for key performance indicators (KPIs), data sources are the most important part of business intelligence (BI) solutions. It is not an exaggeration to say that a BI solution is only as good as its underlying data. PPS supports two primary types of data sources: multidimensional and tabular. In this chapter, you learn about the differences between these two types of data sources. You also learn how these data sources can be applied appropriately in various scenarios. Each section in this chapter includes information to explain the main features of the different data sources, and examples to illustrate implementation. The chapter includes in-depth information on the following data sources:
. Import from Excel Workbook 102 . SharePoint List Data Source 105 . SQL Server Table Data Source 107 . Time Intelligence
108
. Analysis Services . Excel Services . Excel workbooks . SharePoint list data . SQL Server tables and views A final section shows how to apply time intelligence formulas to both multidimensional and tabular data sources to enable users to view data over time. Time intelligence formulas make use of the Simple Time Period Specification (STPS) syntax language. This chapter also provides examples of the most commonly used STPS expressions and operators.
Download at www.wowebook.com
90
CHAPTER 6
Data Sources
Refer to the following chapters for information on other topics relevant to this chapter: . Chapter 5, “Introducing PerformancePoint Dashboard Designer,” provides information on using PerformancePoint Dashboard Designer to create data sources. . Chapter 7, “Using Indicators, KPIs, and Scorecards,” can help you understand how data sources interact with the key components of a monitoring system. . Chapter 10, “Securing a PerformancePoint Installation,” explains how to secure your data sources.
Overview of Data Sources Data sources are an extremely important piece of any BI solution. A scorecard or dashboard can only be as good as the data it is presenting, so it is important to consider the quality, accessibility, and format of the data before embarking on a BI solution. Data sources serve as the foundation for KPIs and analytic charts and grids. In addition, data sources can be used for dashboard filters. Specifically, tabular data sources can be used for the Custom Table filter, and the Analysis Services data source can be used for the Multidimensional Expressions (MDX) query, member selection, named set, time intelligence, and time intelligence connection formula filters.
NOTE Filter configuration is discussed in more detail in Chapter 9, “Page Filters, Dashboards, and SharePoint Integration.” Time intelligence configuration is discussed in more detail in the “Time Intelligence” section of this chapter.
The following two subsections discuss the two broad categories of data sources that PPS supports: multidimensional data sources and tabular data sources.
Multidimensional Data Sources Multidimensional data sources are all variants of SQL Server Analysis Services. They feature dimensions, fact data, and support for the MDX language, as opposed to columns and values that are used in tabular data sources. Multidimensional data sources are the primary use case for PPS, and many features such as analytic charts and grids and the decomposition tree in PPS require multidimensional data to operate. If you do not have any data in multidimensional format, consider porting some of your data to a multidimensional format to take full advantage of the features of PPS. . Analysis Services (2005, 2008, and 2008 R2) . SQL Server 2008 R2 PowerPivot Download at www.wowebook.com
Overview of Data Sources
91
NOTE Online analytical processing (OLAP) data sources, which were available in PPS 2007, have been removed from PPS 2010. This is largely due to functional gaps caused by variations in features and support for the MDX language between other OLAP-supporting data sources and true Analysis Services data sources. If you have a multidimensional data source in a format other than SQL Server Analysis Services, it will not be accessible directly by PPS 2010.
Tabular Data Sources Tabular data sources come in a wide variety of formats. Tabular data sources all feature columns and values and conceptually are similar to a spreadsheet. It is also possible to create custom tabular data sources, as covered at length in Chapter 11, “Working with the Monitoring API.” Tabular data sources have limited functionality. You can represent them as KPIs on scorecards or have them appear as data values within filters to interact with various nonanalytic report types. Generally, this is the extent of their functionality. Listed here are the tabular data sources supported by PPS: . Excel Services (Excel Services 2007 or 2010)
6
. Import from Excel workbook (Excel 2007 or 2010) . SharePoint list (SharePoint 2007 or 2010) . SQL Server table (SQL Server 2005, 2008 or 2008 R2) . Custom data source Conceptually, tabular data is turned into microcubes within Dashboard Designer. Each tabular data source can define dimension and fact data types in the data source definition editor. Dimension values are populated through members that are currently available in the data column. For instance, take the example of a dimension column that can contain Yes or No values. If the data only contains No values, it will not be possible to select a Yes value when adding a dimension filter to a KPI until the data contains at least one Yes value. In addition, dimensions created from tabular data are also always flat. Therefore, it is not possible to create a parent/child relationship and hierarchies between dimension values. Fact data types are determined by the contents of the list. If all the data values are numbers, the data type is considered a number and can be aggregated as numbers. If just one value is text, the entire list will be considered as text fact data. The Data Source template allows you to select the appropriate data source for your KPIs. For KPIs, you can use all types of PPS data sources. For analytic chart and grid reports, a multidimensional data source is required.
Download at www.wowebook.com
92
CHAPTER 6
Data Sources
Data Source Security and Trusted Locations All data connections must be stored in a trusted data connection library. This is true for all data connections that you want to reference from SharePoint. The reason for this is to ensure that all external data connections are approved before they can be used. In other words, a user cannot upload a data connection file to a random document library and use it in PPS; the user needs proper permissions to add the data connection file to the proper library. By default, all data source locations are trusted and, if desired, need to be locked down by the farm administrator. This topic is discussed in more detail in Chapter 12, “Maintaining a PPS Deployment.”
Analysis Services Data Source To create a new Analysis Services data source, you need to have a deployed cube available. In addition, the unattended service account you use to connect should be configured to have at least read permissions. In this example, you connect to a cube named TheGreenOrange in a database named The Green Orange.
Create a New Analysis Services Data Source The following steps describe how to create an Analysis Services data source: 1. There are two ways to create a new data source in Dashboard Designer. You can either select Data Source from the Create tab or right-click on a Data Connections library in the Workspace Browser and then select New Data Source. 2. Select the type of data source you want to create. In this example, select Analysis Services.
NOTE After the data source has been created, you see three tabs called Editor, Properties, and Time, as shown in Figure 6.1. This example focuses on the Editor tab. The Properties tab was discussed in Chapter 5. In addition, the Time tab is discussed later in this chapter in the “Configuring Time Intelligence for an Analysis Services Data Source” section.
3. Specify the server and database connections by either specifying the name of the server and database or by providing a custom connection string. For this example, connect to localhost and a database named The Green Orange.
Download at www.wowebook.com
Analysis Services Data Source
93
FIGURE 6.1 This is where you specify settings for the new data source.
NOTE In step 3, if you use the connection string, you will have access to all connection string properties, such as packet size, timeout, and compression.
6
4. Select the cube by clicking the Cube drop-down, and then select the cube named TheGreenOrange from among the list of cubes available on the specific server. You have now configured the connection settings for the data source. Authentication is discussed in the “Authentication” section.
NOTE The Roles setting allows you to choose a specific Analysis Services database role that you want to use when you connect. The identity you are using to connect to the cube must be a member of the role you choose. This can be useful during development when you want to test different security settings.
Authentication After you have successfully connected to a cube, the next step is to specify how you want to connect to the cube. You have the following options: . Unattended Service Account . Unattended Service Account and Add Authenticated User Name in Connecting String . Per-User Identity
Download at www.wowebook.com
94
CHAPTER 6
Data Sources
Unattended Service Account In PPS 2007, the Unattended Service Account was the same as the application pool identity that was being used for the PPS web service, preview site, and SharePoint site. If you needed to change the identity, you had to change the application pool identity. In PPS 2010, the Unattended Service Account is defined separately from the application pool identity. The farm administrator defines the Unattended Service Account in the Central Administration tool located on the PerformancePoint Service Application Settings page. See Chapter 10 and Chapter 12 for more information about how to configure this setting.
NOTE A common issue that occurs when connecting to a newly deployed cube is that a role that was previously configured has been overwritten or deleted. Security settings may be set to prevent this issue. This is discussed in more detail in Chapter 10.
Using this configuration for authentication will scale better than the other two options because all users are connecting as the same user identity. Therefore, more caching can be done, which results in improved performance. On the other hand, this option does not allow you to filter data from the cube based on the user who is logged in. All users will have access to the same data. Unattended Service Account and Add Authenticated User Name in Connecting String The Unattended Service Account and Add Authenticated User Name in Connecting String setting is similar to the Unattended Service Account setting. The difference is that after you have connected to the cube, you can retrieve the name of the connected user using the CustomData() MDX function. This allows you to do a look up against a value in the cube and dynamically return a cell set. This is often called dynamic OLAP security, which can be useful if it is difficult to align security roles with Active Directory groups. Following is a script that uses CustomData() to look up a user in the Employee dimension. If the user exists, Reseller Sales data for every country that has a match in the Geography dimension is returned: Exists( [Geography].[Country].[Country].Members, Filter(Employee.Employee.Employee.Members, Employee.Employee.CurrentMember.Properties(“Login ID”) = CustomData()), “Reseller Sales”)
Because this setting depends on the CustomData() MDX function, it is available only when connecting to an Analysis Services cube. Per-User Identity The Per-User Identity setting allows you to connect to the cube using the identity of the logged-in user. You can also filter data in the cube based on its security settings. For
Download at www.wowebook.com
PowerPivot Data Sources
95
example, you can restrict certain dimension members to show up in a filter. The potential downside to using this option is scalability. If you have a large number of users that interact heavily with a dashboard, little data can be cached.
CAUTION There are two ways to utilize the Per-User Identity setting. The easiest is to do a standalone installation of SharePoint, which automatically configures per-user security for any requests that do not leave the box. This is useful in demo scenarios where the cube is deployed locally on the SharePoint server. Because this requires a standalone configuration, there are some limitations to the amount of content. Keep in mind that this scenario does not work in a single-machine farm scenario. The other way to accomplish this is to configure Kerberos authentication for the environment. This requires domain-level settings but enables this authentication mechanism for all farm scenarios. See the “Configuring Kerberos Security” section in Chapter 10 for more information.
Formatting Dimension and Cache Interval 6
The Formatting Dimension setting allows you to specify which of your cube dimensions has the data formatting information to use. The Cache Interval setting allows you to specify the time interval before queries will be resent to the cube. If the cube data changes within the specified time interval, the change will not be reflected until the cache has expired. Setting this to zero has the effect of always returning real-time data but will cause increased load on both the data source and SharePoint server.
PowerPivot Data Sources SQL Server 2008 R2 PowerPivot data sources are the only other type of multidimensional data source that can be accessed by PPS. The data is an Excel workbook saved on a SharePoint server with the PowerPivot components installed.
Server Requirements There are some increased server prerequisite requirements to enable PowerPivot data sources. If you are using PPS on the same SharePoint farm that has the PowerPivot components installed, there should be no additional requirements or software.
Download at www.wowebook.com
96
CHAPTER 6
Data Sources
If you are connecting to a different SharePoint farm, and the farm that PPS is running on does not have PowerPivot installed, the SQL native client on that server needs to be upgraded to SQL Server 2008 R2.
Creating a New PowerPivot Data Source PowerPivot data sources are not natively supported by PPS. However, because they support most of the same interfaces and functionality as Analysis Services, it is possible to connect to a PowerPivot workbook hosted in Excel through a connection string as follows using an Analysis Services data source (see Figure 6.2): provider=molap;datasource=http:////.xlsx
Notice the name of the cube used in Figure 6.2. All cubes used with PowerPivot are called Sandbox, and that is the only cube you will see in the cube dropdown list.
FIGURE 6.2 You can connect to a PowerPoint workbook hosted in Excel through a connection string.
Manipulating PowerPivot Data You work with PowerPivot data the same way you work with native mode Analysis Services data. The major differences are that PowerPivot does not have support for parentchild hierarchies so all dimensions will be flat attribute hierarchies, and Time Intelligence functionality is disabled for PowerPivot data sources. This is due to limitations in the PowerPivot DAX language, and may work for future releases or Service Packs of PerformancePoint and PowerPivot. Once you have connected to the PowerPivot data source, you can create any first class object based on that data source such as KPIs, scorecards, reports, filters.
Download at www.wowebook.com
Excel Services Data Source
97
Excel Services Data Source Before you can successfully configure an Excel Services data source, you need to have an Excel workbook deployed to a SharePoint document library. Whether you are using an Unattended Service Account or Per-User Identity, you also need to ensure that the identity you are using to connect has the proper permissions to connect to the SharePoint document library housing the Excel Services data source.
NOTE If you are using an external tabular or Analysis Services data source to populate the workbook, remember that the connecting user must also have the proper permissions to use the data source.
In this example, you are going to connect to a spreadsheet called TheGreenOrange.xlsx that is located in the Documents document library, as shown in Figure 6.3.
6
FIGURE 6.3 In this example, TheGreenOrange.xlsx is located in the Documents document library.
Create a New Excel Services Data Source 1. You create a new Excel Services the same way you created an Analysis Services data source. Either click Data Source on the Create tab or right-click Data Connections, and then select New Data Source.
Download at www.wowebook.com
98
CHAPTER 6
Data Sources
2. Next, specify the SharePoint server and document library where the workbook is located. After you have successfully connected to the document library, you can enumerate all workbooks in that document library. 3. This step is important. You need to specify the name of a table or named range within the workbook that you want to use. For this example, use a table named Affiliate_Table. The complete settings look like those shown in Figure 6.4.
FIGURE 6.4 Your settings for this example should look like this. 4. You do this step with all tabular data source options, including Excel Services, Import from Excel Workbook, SharePoint List, and SQL Server Table. Because Dashboard Designer understands only dimensional data, configure how to interpret the tabular columns as dimensions and facts by clicking the View tab, as shown in Figure 6.5. As you can see in Figure 6.5, the five columns in the original workbook appear, and either a dimension or a fact suggestion is provided based on the data type for each column. Notice that all the cells say No data. 5. Click the Preview Data button to get a data sample based on the contents in the workbook. The first 25 rows of data in the table appear. 6. Dashboard Designer will suggest that all numerical columns are facts and that all text columns are dimensions. In this example you only want to use the Aff_Market as a dimension and Potential_Viewers as a measure. You also need to modify the column type and column headers to make them more descriptive and useful. You can do this by changing the column type and column headers in the Details Properties pane on the right side. Figure 6.6 shows what your data will look like after the column header names have been changed.
Download at www.wowebook.com
Excel Services Data Source
99
FIGURE 6.5 Either a dimension or a fact suggestion is provided based on the data type for each column.
6
FIGURE 6.6 The column headers have been modified to be more descriptive and useful.
Download at www.wowebook.com
100
CHAPTER 6
Data Sources
NOTE In addition to changing the column names, you can change a column type. For example, there might be situations where Dashboard Designer suggests that a column should be a fact when you actually want to use it as a dimension. Table 6.1 lists the available column types you can specify.
TABLE 6.1 Tabular Data Source Column Types Column Type
Function
Dimension
Values in this column are treated as if they were members of a dimension based on the column.
Fact
Values in this column are treated as fact values.
Ignore
Values in this column are ignored.
Key
Values in this column are treated as tuples. Data in the column has to be formatted as a tuple, [Product].[Category].[Bike]. An example of using this would be using filter values from a filter that is based on a multidimensional data source. The values passed from the filter would also be formatted as tuples.
TimeDimension Values in this column are candidates for mapping to the master time dimension for time intelligence. 7. Configure the type of aggregation you want to use for your facts. The default is always going to be Sum, but you can change the default by selecting a different aggregation from the Aggregation drop-down list located in the details pane. The types of aggregations are explained in Table 6.2.
TABLE 6.2 Aggregation Types Aggregation
Usage
Average
Calculates the average of numeric fact values
Count
Determines the number of occurrences of unique members in the column
Minimum
Determines the smallest numeric fact value
None
Performs no aggregation
Statistical Standard Deviation
Calculates the standard deviation of numeric fact values
Sum
Calculates the sum of the numeric fact values
Statistical variance
Calculates the variance of the numeric fact values
First occurrence
Determines the first fact value that occurs for each unique column member
Download at www.wowebook.com
Excel Services Data Source
101
TIP None, Count, and First occurrences are the only aggregation types that can be used with textual data. Using any other aggregation types will result in errors when using the data source.
8. Configure the type of authentication model you want to use. The options are Unattended Services Account or Per-user Identity. The settings for these two options are the same as for the Analysis Services data source and are found on the Editor tab. 9. (Optional) The parameter configuration is optional because it applies only if the workbook has parameters defined (see Figure 6.7). When you deploy a workbook to SharePoint, you have the option to specify if you want to use a single-cell named range as a parameter. These parameters can then be referenced in the parameters settings. Figure 6.7 shows an example of a different workbook with parameters called param1 and param2.
TIP
6
Parameters can be used within an Excel workbook to pass some configuration data back to the workbook. In the data source scenario, they are primarily used to modify data when the parameters are used in formulas within the workbook. However, they first need to be configured in the workbook in the Excel Services Options dialog that is available when publishing the workbook to Excel Services.
FIGURE 6.7 The parameter configuration applies only if the workbook has parameters defined.
Download at www.wowebook.com
102
CHAPTER 6
Data Sources
Import from Excel Workbook The Import from Excel Workbook data source option behaves differently from the other data source options because it does not maintain a live connection. In other words, if you import a workbook and values within that workbook change, the changes will not be reflected until you import that data again. The workbook will be serialized and stored inside of the PPS content repository. Use Excel Services if you need to maintain a live connection to an Excel data source. The primary case for using an Excel workbook as a data source is when using static data that is not likely to change over time. For example, you might use this option when creating a set of custom filter values that can be passed to various reports on the dashboard. The Import from Excel Workbook option enables you to import data from an existing workbook or to create the workbook during the process of creating the data source. This option also requires Excel to be installed on the same computer as Dashboard Designer. Due to interoperability requirements from the .NET Framework, it is important that the processor architecture for the operating system match the processor architecture for the version of Excel that is installed. Table 6.3 illustrates the combinations that work on the client machine.
TABLE 6.3 Possible Interoperability Requirements Windows x86
Windows x64
Excel 2007 (x86 only)
Works
Does not work
Excel 2010 x86
Works
Does not work
Excel 2010 x64
N/A
Works
CAUTION Office introduced several new methods of running Office applications such as Excel in the 2010 release. Aside from the standard installation, you can use the Click2Run technology and run applications from Office Online. However, none of these work with PPS or Dashboard Designer. The only supported method for using Excel with PPS is the tried-and-true MSI-based installation.
Import Data from an Existing Workbook This example leads you through the steps of importing data located in a workbook named Actors.xlsx, as shown in Figure 6.8.
Download at www.wowebook.com
Import from Excel Workbook
103
FIGURE 6.8 Data for the scorecard is stored in this Excel workbook called Actors.xlsx.
1. After creating a new data source based on the Import from Excel Workbook template, the Import screen appears.
6
2. You have the option to either Import or Edit data. For this example, import data from the Actors.xlsx workbook. To do this, click the Import button to browse for the workbook.
NOTE It is also possible to start from a new Excel workbook by clicking the Edit button rather than the Import button. This launches a blank workbook where you can enter data.
3. If the first row contains header names, accept the default check, and then click Accept. 4. When the data is imported, preview the data to verify that the columns are tagged properly as either a dimension or a fact (see Figure 6.9). The data is imported successfully with the exception of the Actor_ID column, which was expected. This occurred because the data in this column is of type integer. Therefore, the import process assumes this column will be used as a fact, but you want to use it as a dimension. 5. To change the Actor_ID column type from a fact to a dimension, use the Column Type property in the Details Properties pane. Each column header indicates if it is of type Fact or Dimension.
Download at www.wowebook.com
104
CHAPTER 6
Data Sources
FIGURE 6.9 Verify that the columns are tagged properly as dimension or fact. After you make this change, the data source is ready for use. Figure 6.10 shows the data used in a scorecard. Again, notice that you are now working with a dimensional and not tabular data structure.
FIGURE 6.10 This scorecard is based on data imported from an Excel workbook.
Download at www.wowebook.com
SharePoint List Data Source
105
SharePoint List Data Source SharePoint lists are another form of tabular data that can be useful as a data source. SharePoint lists are quite easy to create and share with other business users. They also prove useful for gathering or sharing data in a persisted format.
CAUTION SharePoint data sources always connect to the default list view and will take into account any filtering or column hiding done in this view. It is not possible to work around this limitation. For example, if a column is hidden in the default view, it will not be shown in the list preview in Dashboard Designer, nor will it be available as a fact or dimension for a KPI or filter. In addition, if a filter is applied that obscures some rows in the list, that data will not be available in Dashboard Designer. This means that this data will be left out of aggregations.
To connect to a SharePoint list, you must have access to the list. In the following example, you connect to the SharePoint list, as shown in Figure 6.11.
6
FIGURE 6.11 This is an example of data stored in a SharePoint list. 1. After you create a new data source based on the SharePoint List data source template, a screen appears that allows the entry of connection information to the SharePoint list. On this screen, specify the SharePoint site that contains the list. 2. Select the list collection and list name from the drop-down menus. 3. Click Test Data Source to ensure that the connecting user has read permission to access the SharePoint list. See Figure 6.12 for an example of complete settings. Download at www.wowebook.com
106
CHAPTER 6
Data Sources
FIGURE 6.12 This is an example of complete settings for a SharePoint list data source. 4. Switch to the View tab to verify that all columns have been configured using the proper column type and that all facts use the correct aggregation function. This step applies to all tabular data sources.
TIP A common problem when working with existing SharePoint lists is that they were not designed with BI in mind. When working with SharePoint lists that do not have true fact data, a useful trick is to create a Count aggregation on the Attachments column. This will have the effect of counting the number of rows that are in a given query.
5. Check to make sure that all the columns are configured properly. There is an additional SharePoint list metadata column, called Attachments, listed in the preview. Because you probably are not interested in using that column, verify that the Attachments column is set to Ignore.
NOTE It is quite common for SharePoint lists to contain additional metadata columns that you can choose to ignore. These columns can either be ignored in SharePoint Designer or removed from the default view. The Authentication options, Unattended Service Account, and Per-User Identity behave the same as all other tabular data sources.
Download at www.wowebook.com
SQL Server Table Data Source
107
SQL Server Table Data Source The last type of data source examined in this chapter is the SQL Server table data source. As the name implies, this data source allows you to create a connection to SQL Server tables. You can also create a connection to SQL Server views. Like all other data sources discussed in this chapter, you need to have at least read access to the source before you can create a successful connection. In this example, connect to the RequestUsage table located in the WSS_Logging database. 1. After you create a new data source based on the SQL Server table data template, the SQL Connection Settings screen appears. 2. Next, specify the server, database, and table or view name. 3. You can also choose to configure the connection string manually to get access to all connection string properties, as you did with Analysis Services. As with all other tabular data sources, the authentication options available are Unattended Service Account and Per-user Identity. Figure 6.13 shows how the settings should look after you specify all the properties.
6
FIGURE 6.13 This is an example of complete settings for a SQL Server table data source. 4. As with all tabular data sources, verify that all columns have been properly configured as a dimension or fact. In addition, verify that all facts are using the proper aggregation column (see Figure 6.14).
Download at www.wowebook.com
108
CHAPTER 6
Data Sources
FIGURE 6.14 Verify that the columns are tagged properly as dimension or fact. As shown in Figure 6.14, all the columns except for the RowID are configured correctly. The RowID is interpreted as a dimension since it contains GUID’s, so it has been set to be a dimension. After you change the RowID column to be of type Key, the data source is ready to be used in a scorecard.
Time Intelligence A common requirement of clients is to allow end users to filter data from scorecards and reports on a dashboard based on a time intelligence formula. Time intelligence formulas allow users to view data over time, such as year over year (YOY), last period, rolling average, and year to date (YTD). For example, to implement this capacity in an Analysis Services cube, the cube implementer needs to create that type of formula using a language native to Analysis Services. In Analysis Services, the language used is Multidimensional Expressions (MDX). To implement this capacity against a tabular data source, you need to implement it using a language native to the data source. For example, if your data source is a SQL database, you need to use T-SQL. PPS provides its own expression language called Simple Time Period Specification (STPS). STPS enables you to create time intelligence formulas rapidly. For example, if you want to see aggregated data based on YTD, you can create a time intelligence filter and use the following formula: Year.FirstMonth:Month
Download at www.wowebook.com
Time Intelligence
109
If you want to apply this data to 2009 sales numbers and the current month is July, this STPS expression aggregates all 2009 sales data from the first month of the current year to the current month. Under the covers, this expression is translated to the data source’s native language. In this next section, you see this formula in action.
TIP Time intelligence can be a confusing topic. To gain a better understanding of how it works, use the SQL Profiler to see how your STPS formulas are translated into MDX or T-SQL depending on which data source you are working against.
Configuring Time Intelligence for an Analysis Services Data Source For STPS to work, you need to configure the data source so that your expressions properly match the time definition in the data source. Look at the previous code example: Year.FirstMonth:Month
For this expression to work, you need to explain to STPS how year and month are defined in the data source. In other words, you need to map how time is defined in the data source to an internal, conformed master time dimension against which STPS works. In this first example, you configure TheGreenOrange Analysis Services data connection that you created earlier.
6
The following steps describe how to configure the screen shown in Figure 6.15: 1. Notice that both the Analysis Services and tabular data sources have a Time tab. To successfully use time intelligence features, select a dimension named Date and a hierarchy named Year—Qtr—Month—Date to specify which dimension and hierarchy in the cube defines time. 2. Select a reference member and a hierarchy level because all Time Intelligence operations are calculated with these settings as a reference point. Any date within the cube should work fine because PPS can extrapolate other dates after one of them is selected.
CAUTION A best practice is to ensure that the cube you are working with has its time dimension starting at the beginning of the calendar year. There were some issues in PPS 2007 where calendars starting at random intervals returned the wrong data.
3. Specify how the hierarchy levels in the data source’s time dimension maps the internal, conformed master time dimension. The available hierarchy levels for the master time dimension are on the right side in the Time Member Associations area, as shown in Figure 6.15.
Download at www.wowebook.com
110
CHAPTER 6
Data Sources
FIGURE 6.15 This is an example of complete settings for the Time Member example. The Analysis Services data source is now configured to support STPS expression.
TIP Suppose you have a data source that has multiple time dimensions and you want to use both time dimensions. The solution is to create a new data source for each time dimension you want to use in your PPS solution. For example, if the cube you are using has both calendar year and fiscal year dimensions, you can create two data sources using the same server and cube information with the only difference being the time dimension selected in the Time tab of each data source. When creating KPIs or filters, select the data source with the time dimension that makes sense for that object.
Configuring a Tabular Data Source Configuring a time dimension for a tabular data source is slightly different from working with an Analysis Services data source. It is not necessary to select a reference member because PPS builds its own calendar and automatically maps it to the dimension. In this example, you configure a SQL Server table data source for which all tabular data is configured the same. You have two columns that are treated as time dimensions in the data source: LogTime and RowCreatedTime. Select the LogTime column for this example. Figure 6.16 shows the completed settings.
Download at www.wowebook.com
Time Intelligence
111
FIGURE 6.16 The tabular data source is now ready for time intelligence applications.
NOTE
6
Although it is possible to select multiple columns as time dimensions for tabular data sources, only the one with the check box selected is considered the “master” time dimension. If a time dimension is not the master time dimension, it is effectively just another dimension.
You now have the ability to use STPS expressions against the tabular data source.
STPS Syntax The STPS syntax language is meant to be similar to the Excel Macro language. It enables you to select time members based on logical calendar patterns on business logic focused selection criteria such as last week or last quarter. In contrast, regular dimensions do not support the ability to select dimension members in this way. Time members are always resolved to leaf members in the cube. For instance, if a month of time is selected and the cube has members stored in days, a collection of all days in that month will be returned. Likewise, if that cube stores data with hour granularity, all hours in that month will be returned instead.
NOTE When dealing with non-English builds of PPS, it is important to note that the STPS language is not localized into different languages. For example, a Japanese installation of PPS still uses the English terms for members and functions.
Download at www.wowebook.com
112
CHAPTER 6
Data Sources
Language Form For those who are mathematically inclined, the formal declaration of the STPS syntax is as follows: ::= , | :
For the rest of us, this means that a TI expression is a combination of time members. Time members, which are discussed later in this chapter, can consist of relative dates such as yesterday, relative date ranges such as last month, and functions such as quarter to date. Time Members Time members, which correspond to logical date units, are the core building blocks for the STPS syntax. Listed here are the levels of granularity available for users, which are referred to as members in the STPS syntax.
CAUTION Members are available for use only if they have been configured in the data source. For example, if you configure an Analysis Services data source that only contains Year, Month, and Day levels, the Semester and Quarter members will result in errors if you attempt to use them. . Year . Semester . Quarter . Month . Week . Day . Hour . Minute . Second
Download at www.wowebook.com
Time Intelligence
113
TIP Although granularity down to the minute and second is included, it does not have many practical applications. Given the default caching times of 10 minutes, and overall performance of PPS, it is probably a good idea to stay with hour or greater granularity when using time intelligence.
Operators The colon and comma are two operators used with time intelligence. These operators can be used to combine various members and functions of the STPS syntax. Table 6.4 summarizes the STPS operators you can use.
TABLE 6.4 STPS Operators Operator
Usage
Colon (:)
The colon is used to indicate a range of dates. For example, the statement Day1:Day-7 selects all the days between yesterday and a week ago inclusively.
Comma (,)
The comma is used to combine two members. For example, the statement Day1,Day-7 selects today and a week ago today as distinct dates.
6
Functions Several functions are available for traversing members. All parent and child references are relative to the configuration of the data source. For example, if a week level is configured directly above the day level, the Day.Parent function returns the current week. If there is no week configured and the next configured level up is a month, it returns the current month. The same applies to child references. Table 6.5 summarizes these functions.
CAUTION Be careful of the FirstChild and LastChild functions. They work just fine until the data source definition changes to add in new levels. For a more robust implementation, stay with expressions that use members rather than the parent/child relationship where possible.
Download at www.wowebook.com
114
CHAPTER 6
Data Sources
TABLE 6.5 STPS Functions Function
Description
Example Expression
Example Result
Parent
The parent of the specified member.
Day.Parent
Week
FirstChild
The first child of the specified member.
Month.FirstChild
First day of month
LastChild
The last child of the specified member.
Month.LastChild
Last day of month
First
Returns the first child member of the parent time period. Any member must be below the referenced member; otherwise, the expression will not be valid. For example, Week.FirstYear will return an error.
(Year-1).FirstWeek
First week of the previous year
Last
Returns the last child member of the parent time period. Any member must be below the referenced member; otherwise, the expression will not be valid. For example,
(Month-1).LastDay
The last day of last month
QuarterToDate
All days up until the current quarter
Week.FirstYear
returns an error. ToDate Returns the range of
dates between the beginning of the current period and now. Note that this function only supports members down to the Day level. This means that HourToDate, MinuteToDate, and SecondToDate are not valid expressions.
Download at www.wowebook.com
Time Intelligence
115
Continued TABLE 6.5 STPS Functions Description
Example Expression
Example Result
Full
Returns the last full YearToDate.FullQuarter The last full quarter for period as specified by the current year the member. Full is determined by calendar days, not by data in the data source. For example, FullMonth normally returns last month (month-1). However, in some cases it returns the previous parent periods last month. This function is primarily included to handle boundary cases around the beginning of periods when used in conjunction with the ToDate functions. For example, YearToDate.Month-1 is correct in all months except for January, in which case it returns an error because there are no months ahead of January in the current Year. YearToDate.FullMonth.
6
Function
NOTE The Full and ToDate functions are new with PPS 2010. All the other functions come from PPS 2007.
STPS Example This section includes an example of how to create a time intelligence filter. More details about this topic are included in Chapter 9. 1. To start, select the time intelligence filter template, and then select The Green Orange data source as seen in figure 6.17.
Download at www.wowebook.com
116
CHAPTER 6
Data Sources
FIGURE 6.17 Start by selecting the Time Intelligence filter template and the data source. 2. Next, create the STPS expressions. For this example, the STPS expression is a year-todate entry based on months, as shown in Figure 6.18.
FIGURE 6.18 Enter the time formula.
Download at www.wowebook.com
Time Intelligence
117
3. Click the Preview button to see the dimension members that are returned, as shown in Figure 6.19.
FIGURE 6.19 Use the Preview feature to see the dimension members. By using SQL Profiler, you can see how our STPS expression is translated to MDX (see Figure 6.20).
6 FIGURE 6.20 Use the SQL Server Profiler to see how the STPS expression translates to MDX.
Download at www.wowebook.com
118
CHAPTER 6
Data Sources
After the filter has been added to a dashboard and it has been used with a scorecard, you can verify that it returns the correct data, as shown in Figure 6.21.
FIGURE 6.21 Verify the time intelligence filter and the formula on the dashboard.
Summary This chapter provided an overview of working with the two primary types of data sources supported by PPS: multidimensional and tabular. After reading this chapter, you should have a good understanding of how to configure data sources to allow users to consume data from Analysis Services, Excel Services, Excel workbooks, SharePoint lists, and SQL Server tables and views. You should also understand the most appropriate scenarios for each data source and what to consider when selecting and preparing a data source for use in BI monitoring solutions. With the information on how to configure time intelligence formulas using STPS expressions with Analysis Services and tabular data sources, you can create KPIs and scorecards that allow business users to monitor and view their organization’s performance over time.
Download at www.wowebook.com
Best Practices
119
Best Practices . Consider the quality, accessibility, and format of the data before embarking on a BI solution. . If you do not have any data in multidimensional format, consider porting some of it to a multidimensional format to take full advantage of the features of PPS. . Use Excel workbooks as data sources to hardwire in data that is not likely to change over time. . Use SharePoint lists as a data source to share data in a persisted format. . A best practice when using time intelligence formulas is to ensure that the cube you work with has its time dimension starting at the beginning of the calendar year. . A best practice when using time intelligence formulas is to use hour granularity or greater.
6 Download at www.wowebook.com
This page intentionally left blank
Download at www.wowebook.com
CHAPTER
7
Using Indicators, KPIs, and Scorecards
IN THIS CHAPTER . Understanding and Working with Indicators 122 . Understanding and Working with KPIs 128 . Understanding and Working with Scoring 142
Scorecards, which are a key component of dashboards, are
. Understanding and Working with Scorecards 154
one of the most versatile objects in the PPS world. Scorecards display indicators and key performance indicators (KPIs), which are the metrics used for monitoring performance. Indicators are the images used to display the value of KPIs visually in a scorecard. Together these objects make up a monitoring system that can communicate critical business information quickly. This chapter provides an overview of how to work with indicators and KPIs and how to integrate these objects into a scorecard view. Examples are provided throughout the chapter. Each section includes information to explain the main features of indicators, KPIs, and scorecards, and examples to illustrate implementation. The chapter includes in-depth information on scoring patterns, thresholds, and methods. This can help PPS users understand the calculations that occur behind the scenes and help users understand how to refine KPIs and scorecards to best meet their monitoring needs. The chapter also examines how to select the data you want to use for a metric in a KPI. This discussion includes adding dimensions and measures to create scorecards and using calculated metrics to provide refined and complex views into the business information of an organization. Refer to the following chapters for information on other topics relevant to this chapter: . Chapter 5, “Introducing PerformancePoint Dashboard Designer,” provides additional information on using PerformancePoint Dashboard Designer to create indicators, KPIs, and scorecards.
Download at www.wowebook.com
122
CHAPTER 7
Using Indicators, KPIs, and Scorecards
. Chapter 6, “Data Sources,” provides details about the different types of data sources you can use with KPIs. . Chapter 9, “Page Filters, Dashboards, and SharePoint Integration” provides information on integrating scorecards into dashboards and different filter options available after a scorecard is rendered on a SharePoint site.
Understanding and Working with Indicators Indicators are the images used to display the approximate value of a KPI visually in a scorecard. Typical indicators include the popular traffic light icons that display green (on target), amber (needs attention), and red (off target) to indicate status. Indicators prove useful when displaying a large amount of data on a scorecard. For example, a scorecard might contain hundreds of different KPI metrics. Visual indicators on a scorecard heavily populated with KPIs can communicate a high-level status and make performance understandable with a single glance.
Examining Indicator Styles In PPS there are two types of indicators: . Standard indicators . Centered indicators Standard indicators are indicators that have increasingly better statuses. For example, a metric with no upper limit to its goodness, such as profit, would be best represented by a standard indicator. Likewise, a metric such as spending that gets better as it decreases should also be represented by a standard indicator. The decision to choose which end is better can be made when creating the KPI to be associated with the indicator, not when you are creating the indicator. Centered indicators are used for KPIs that aim for a specific target. For example, monitoring headcount in a department is the type of metric that could use a centered indicator. With headcount, a manager generally has a target number, which means it could be bad to go too far above or too far below the target number.
Examining Indicator Sources Indicators are stored as objects within the SharePoint content database. In PPS, there are two indicator sources: . Built-in indicators . Custom indicators PPS comes with a variety of free indicator images out of the box. All of these built-in indicators can be used royalty free. Download at www.wowebook.com
Understanding and Working with Indicators
123
NOTE There is also a set of built-in indicators on trending. These trending indicators can be tricky to use. They also require a form of time intelligence to be applied to the scorecard. Trending indicators are discussed in the “Designing Scorecards” section of this chapter.
It is also possible to upload your own images and make custom indicators, either from scratch or by modifying an existing indicator. Custom indicators are useful for adding corporate branding or a personalized touch to scorecards.
Creating Custom Indicators Custom indicators are best created through Dashboard Designer. Follow these steps to create a custom indicator: 1. Open Dashboard Designer, shown in Figure 7.1, and then open the PerformancePoint content list in which you want to create the custom indicator.
7
FIGURE 7.1 Use Dashboard Designer to create custom indicators.
2. Select the Create tab on the ribbon, shown in Figure 7.2, and then click the Indicator button to launch the Select an Indicator Template Wizard. Download at www.wowebook.com
124
CHAPTER 7
Using Indicators, KPIs, and Scorecards
FIGURE 7.2 Click the Indicator button from the Create tab. 3. From the Select an Indicator Template Wizard, shown in Figure 7.3, select Blank Indicator, and then click OK.
FIGURE 7.3 The Indicator Template Wizard helps you create custom indicators.
Download at www.wowebook.com
Understanding and Working with Indicators
125
TIP In this example, you use the Blank Indicator template, which allows the greatest amount of customization. However, if you just want to modify an existing indicator, choose a built-in indicator with which to start. For example, you can choose a built-in indicator to change the background highlight of the indicator’s display cell. After you have created an indicator, it is only possible to change images and colors. You cannot add or remove levels after an indicator has been created.
4. When the Create New Indicator dialog page appears, shown in Figure 7.4, you have the option to choose which style of indicator you want, such as standard or centered. You can also choose the number of levels in the indicator. Choose suitable values for this task, and then click Finish.
7
FIGURE 7.4 Select the suitable type and number of levels.
NOTE The number of levels for a centered indicator indicates the number of levels from the center. For example, if you create a centered indicator with three levels, you will have three levels above center and three levels below center. The “best” score for all centered indicators is made up of two halves, one on the top half and one on the bottom half of true center.
Download at www.wowebook.com
126
CHAPTER 7
Using Indicators, KPIs, and Scorecards
In addition, all indicators have a No Data level that is used when the indicators do not have associated data. This may occur in cases when the data source is not available or when there are no valid intersections between dimensions.
At this point, Dashboard Designer creates the indicator for you in the root of the PPS Content List currently selected, as shown in Figure 7.5. In addition, the Dashboard Designer displays the Indicator editing page.
FIGURE 7.5 This is an example of the Indicator editing page in Dashboard Designer.
Editing a Custom Indicator When your custom indicator has been created, Dashboard Designer has functionality that enables you to modify some of the custom indicator’s properties. Much like other objects within the PPS world, changes you make are viewed and applied locally in Dashboard Designer. These changes become “live” for all users when they are saved to the server. You can make changes to the following values on the Editor tab when viewing an indicator: . Display name . Image
Download at www.wowebook.com
Understanding and Working with Indicators
127
. Text color . Background Edit Display Name The display name is an edit box field. Edit the field by selecting the cell and then changing or entering the new text to display in the field. Edit Image The image used for the indicator can be in JPG, BMP, GIF, or PNG format. Select the image by selecting the Image cell on the level where you want to edit the indicator. Next, you can either use the Edit—Picture from File option or double-click the cell. Select the picture file you want to use as an indicator. Indicator images must be 255-by-255 pixels or smaller. When using larger images for indicators, consider how many of those types of indicators you want to have on a scorecard.
TIP Keep in mind that a scorecard can become crowded and lose its effectiveness in communicating performance.
CAUTION The Reset Indicator button that is available in the Edit tab clears the selection of the Image and Text Color fields. However, because there is not a good reason to do this, it is better to avoid using this button.
7
Edit Text Color The Text Color field controls the color of the text displayed in a cell on a scorecard. When a KPI on a scorecard has a value corresponding to that level, the text color of the target cell for that value changes to the color selected. Edit Background Color The Background Color field is similar to the Text Color field. When a KPI on a scorecard has a value corresponding to that level, the background color of the target cell for that value changes to the color selected.
CAUTION By default, target metrics are not configured to honor text and background color changes as defined by indicators. If you want these changes to take effect, right-click the target metric header on the scorecard where you want the text changes. When you want background color changes to be displayed, select the Metric Settings from the context menu, and then select the Indicator section of the dialog box. At this point, you can configure several options such as text and background color that control how this metric is displayed.
Download at www.wowebook.com
128
CHAPTER 7
Using Indicators, KPIs, and Scorecards
Understanding and Working with KPIs As mentioned earlier, a KPI is a metric for monitoring performance. In other words, a KPI is a metric or set of metrics used to provide the status of how close the actual value of a metric is to its target value. Financial metrics are typical applications of KPIs. For example, suppose that The Green Orange has a production budget for each show. The producer allocates a fixed budget for the show and the director must work within this budget to complete the show. If the financial metric indicates that the director is tracking toward spending less than the budgeted amount, he is considered to be on target with his spending. If the financial metric indicates that the director is tracking toward spending more than the budgeted amount, he is considered to be off target with his spending. In each case, the KPI enables the producer to monitor the budget for the show and take action if required. KPIs can be complex, and they aggregate data from multiple sources such as other KPIs. On the other hand, they can be quite simple measures based on a single point of data. The complexity or simplicity of a KPI depends on business needs and requirements.
Creating an Analysis Services KPI In this example, you create a KPI that tracks the number of viewers per episode and compares this number to a fixed target: 1. Launch Dashboard Designer and ensure that The Green Orange Analysis Services data source is included in your workspace, as shown in Figure 7.6.
FIGURE 7.6 Include The Green Orange Analysis Services data source in your workspace. Download at www.wowebook.com
Understanding and Working with KPIs
129
2. Open the Create tab, and then click the KPI button to launch the Select a KPI Template Wizard. 3. Select Blank KPI on the Select a KPI Template page in the wizard, as shown in Figure 7.7, and then click OK. A KPI is created and the KPI editor appears in Dashboard Designer (see Figure 7.8).
FIGURE 7.7 Select Blank KPI from the KPI Template Wizard.
7
FIGURE 7.8 Use the KPI editor to map the data source. Download at www.wowebook.com
130
CHAPTER 7
Using Indicators, KPIs, and Scorecards
NOTE A Blank KPI template has no predefined content or data mappings. Data mappings will be added after the KPI is created in step 5.
4. To map the actual value of the data source to The Green Orange data source, click the 1 (Fixed Values) link at the intersection of the Actual row and the Data Mappings column. The Data Source Mapping dialog box appears. 5. Click the Change Source button at the bottom right of the Source Mapping dialog. The Select a Data Source dialog box appears, as shown in Figure 7.9.
FIGURE 7.9 Select the data source from this dialog box.
6. From the Select a Data Source dialog box, find The Green Orange data source, and then click OK. 7. Now that The Green Orange Data Source has been selected, you need to select a measure that you want the KPI to display, as shown in Figure 7.10. To do this, select the Viewers measure, and then click OK.
Download at www.wowebook.com
Understanding and Working with KPIs
131
FIGURE 7.10 Select the measure to display for the KPI from this dialog box.
NOTE There are other options you can select, such as adding dimension filters, adding time intelligence filters, and changing data source aggregation. You can also select a custom Multidimensional Expressions (MDX) formula to represent the KPI. MDX is a query language used for online analytical processing (OLAP) databases. Within PPS, MDX is used primarily for querying multidimensional data for cases where the PPS dimension selection UI does not meet your needs.
7
MDX was more necessary in PPS 2007 because the product lacked features such as dynamic hierarchy selection that selects all children of a dimension member. For the most part, these functionality gaps have been closed in the SharePoint 2010 release. Therefore, the MDX feature remains primarily for backward-compatibility purposes.
8. At this point, you have mapped the actual value to the KPI. Notice that the Data Mappings field for the Actual row now displays your selections, as shown in Figure 7.11. Next you need to set an appropriate target by clicking the 1 (Fixed Values) link at the intersection of the Target row and the Data Mappings column. 9. In the Data Source Mapping dialog box, enter 30,000,000 as the fixed value you are going to target for the Viewer KPI, and then click OK.
NOTE It is possible to map actual and target data to values that reside in different data sources. This is especially useful in scenarios where target data is not formally captured in a cube and it is necessary to provide target data from a separate data source, such as a SharePoint list or Excel Services.
Download at www.wowebook.com
132
CHAPTER 7
Using Indicators, KPIs, and Scorecards
FIGURE 7.11 The Data Mappings selections appear for the actual. This completes the process for configuring the KPI, shown in Figure 7.12. At this point, it is not possible to preview the rendered KPI within the KPI editor. You see the values displayed from the data source when the Viewer KPI is placed on a scorecard. This is discussed in the “Understanding and Working with Scorecards” section of this chapter.
NOTE The Properties tab is a shared tab among all the different objects in the PPS world. From the Properties tab, you can rename the object, change the folder path, or define custom properties that can ultimately be displayed on a scorecard. See Chapter 5 for more information on how to use the Properties tab.
Download at www.wowebook.com
Understanding and Working with KPIs
133
FIGURE 7.12 The data mappings selections appear for the target.
Understanding Multiple Targets and Actuals 7
With PPS 2010, you can define multiple metrics in a single KPI. Doing so proves particularly useful when defining KPIs that have multiple success factors associated with them. In The Green Orange example, the producers want to know both the popularity of the show, measured in viewers, and the revenue earned per viewer, shown in Figure 7.13. The producers also want to view this on the same scorecard, as shown in Figure 7.14. . Actual (Actual Viewers): The total number of viewers that see each show. This metric comes directly from cube data. . Actual (License Fee): A value contained within the cube that indicates how much incoming revenue comes from the affiliate stations broadcasting each episode. This metric is not shown on the final scorecard. . Actual (Revenue per Viewer): A calculated metric determined by dividing the total number of viewers by the fees collected from the affiliates broadcasting the show. . Target (Potential Viewers): A value contained within the data source indicating the total number of potential viewers for the show. This is compared to the Actual (Actual Viewers) metric. . Actual (Revenue per Viewer): There is no metric in the cube for this value, so it is implemented as a fixed value with the goal of making about $85 per viewer. This is compared to the Actual (Revenue per Viewer) metric.
Download at www.wowebook.com
134
CHAPTER 7
Using Indicators, KPIs, and Scorecards
FIGURE 7.13 Multiple actuals and targets defined for a single KPI.
FIGURE 7.14 Scorecard with multiple actuals and targets shown.
Download at www.wowebook.com
Understanding and Working with KPIs
135
With the KPI editor, you can create multiple metrics in a single KPI. This is useful when there is a KPI that may have multiple actual values such as products sold and products in inventory. These multiple values would be compared against multiple target values either on the same or different scorecards. This functionality can be accessed by clicking the New Actual or New Target buttons in the KPI toolbar. The Compare To column for target metrics controls which actual metric will be used in scoring calculations for that target value.
Examining Data Mapping Several different dialog boxes and options are available for selecting the data you want to use for a metric in a KPI, including the following: . Fixed value . Data sources . Existing metrics . Calculated metrics Fixed Value A fixed-value KPI is a hard-coded numeric value. This is used primarily for setting a target when you have a static target that is not stored in a data source. For example, in The Green Orange scenario, a fixed value might be used to measure an average of critic rating of three stars or higher per show. The number three for a target will not change, so using a static or fixed value is appropriate.
7
This option always appears at the top of the Workspace tab in the Select a Data Source dialog box. Data Sources It is also possible to select any data source that PPS supports through the Date Source dialog box. All data sources currently in the workspace that is loaded in Dashboard Designer appear in the Workspace tab. If you want to pick a data source that is not yet loaded in the workspace, the SharePoint Site tab shows all data connection libraries that have been loaded in this workspace. Choosing a data source from the SharePoint Site tab automatically adds the selected data source to the current workspace. The various options for data sources are discussed in-depth in Chapter 6. Dimensional Data Source Mapping Dialog Box The standard way to create a KPI involves mapping a measure from a data source to a KPI, as shown in Figure 7.15.
Download at www.wowebook.com
136
CHAPTER 7
Using Indicators, KPIs, and Scorecards
FIGURE 7.15 Use the Dimensional Data Source Mapping dialog box to map a measure from a data source to a KPI.
NOTE Several levels of filtering can occur on a scorecard. The first level of filtering, which can occur at the KPI level, is accessible through the Dimensional Data Source Mapping dialog box. Filtering can also happen at the level of the scorecard or on the dashboard itself. This is also the order of precedence. Filters placed on a KPI override any filters applied at a higher level in the scorecard or on the dashboard. It is important to note that placing filters at the KPI level is the least flexible option for filtering KPIs.
Listed here are the different options available when mapping data sources to metrics. Most likely, you will not need to use all of them on each data mapping that you do: . Select a Measure: Enables you to select a measure to use from the cube or tabular data source. This is a required field. . New Dimension Filter: Enables you to filter on a specific dimension. For example, in The Green Orange scenario, you can select to filter only on a particular season or a particular episode. . New Time Intelligence Filter: Enables you to enter a time intelligence expression that will be used as a filter for the KPI. . Aggregate Members By: Enables you to override the aggregation used in the cube for this metric. For example, you can change this option from Default to Sum if you want this KPI to represent the total number of 60-second commercial segments per episode rather than the default average.
Download at www.wowebook.com
Understanding and Working with KPIs
137
. Use MDX Tuple Formula: This check box and associated edit box enable you to enter your own custom MDX to represent this KPI.
TIP MDX refers to a language in which it is possible to select expressions from Analysis Services. Because this is a complex language, it is recommended that you refer to Microsoft SQL Server 2008 Analysis Services Unleashed (ISBN: 0672330016) for in-depth information on this topic.
Existing Metrics It is possible to copy the settings from an existing metric from this KPI into the metric being edited. For example, doing so proves useful when making a series of similar metrics within a KPI. Instead of selecting all dimension filters from scratch each time, this will create an identical copy that can be edited independently of the source metric. This option always appears at the bottom of the Workspace tab of the Select a Data Source dialog box, as shown in Figure 7.16. This option enables you to select any existing metric within the current KPI.
7
FIGURE 7.16 Selecting an existing metric to copy.
CAUTION Keep in mind that the data is copied one time only. This means that if the source metric changes, the destination or copy of the metric will not automatically inherit changes made to the source version.
Download at www.wowebook.com
138
CHAPTER 7
Using Indicators, KPIs, and Scorecards
Calculated PPS includes a sophisticated engine that allows for calculation and manipulation of data. This is particularly useful if the data source you are working with does not have the complete data set or structure required for your metrics. To access the functionality for calculated metrics, open the Calculated Metric tab from the Select a Data Source dialog, and then select a calculation template. When you select a template, all the basic mathematical operations are supported as well as some special functions. The Calculated Metrics Data Source Mapping dialog provides the following functionality (see Figure 7.17):
FIGURE 7.17 Use the Calculated Metrics Data Source Mapping dialog box to enhance the value of your data source.
. New Mapping and Delete: Use these buttons to add or remove mappings. Not all mappings need to be used in the formula field. . Mappings: This grid displays the current mappings for the calculated KPI. It is possible to rename existing mappings here. Click the Source link to select a new mapping, which may include another calculated KPI. . Formula: You can enter any mathematical formula you want for the calculated KPI in the Formula edit box. All standard mathematical functions (+, -, *, /) and parenthesis are accepted in this edit box. The special functions listed in Table 7.1 are also accepted in the Formula edit box.
Download at www.wowebook.com
Understanding and Working with KPIs
139
. Disable Scorecard Filters for this Metric: Use this option to prevent filters from affecting any of the values mapped for the calculated KPI. This is useful if you do not want the metric to be affected by any filter settings that the user may set on the dashboard rendered in SharePoint. . Change Source: This button offers the ability to change the KPI from a calculated metric to another type of data source, which, in effect, cancels the calculated metric functionality.
TABLE 7.1 Special Functions for Calculated Metrics Function Example Syntax
Description
Sum
Sums all the specified comma-delimited values.
Sum(val1,val2,val3)
Average Average(val1,val2,val3) Averages (via arithmetic mean) all the specified comma-
delimited values. Min(val1,val2,val3)
Returns the minimum value of the collection of specified comma-delimited values.
Max
Max(val1,val2,val3)
Returns the maximum value of the collection of specified comma-delimited values.
Round
Round(20.333,1)
Rounds the number to the specified number of decimal places. Zero decimal places.
If
If(val1 Id=”USINGUIINSTALLMODE” Value=”1”/> Id=”SETUPTYPE” Value=”CLEAN_INSTALL”/> Id=”SETUP_REBOOT” Value=”Never”/> Id=”AllowWindowsClientInstall” Value=”True”/>
11